Labour Force Survey, November 2015
Archived Content
Information identified as archived is provided for reference, research or recordkeeping purposes. It is not subject to the Government of Canada Web Standards and has not been altered or updated since it was archived. Please "contact us" to request a format other than those available.
Released: 2015-12-04
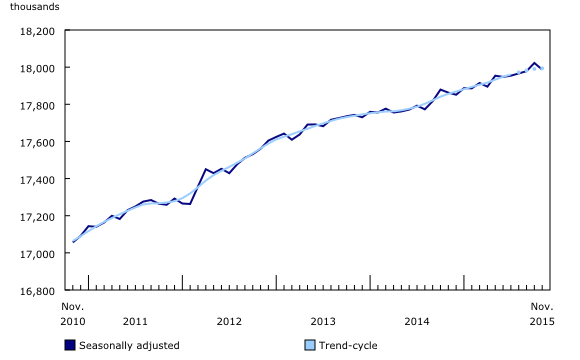
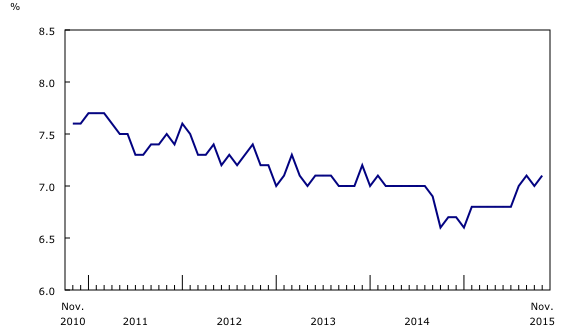
Employment decreased by 36,000 (-0.2%) in November, the result of losses in part-time work. The overall employment decline in November followed a similar-sized increase in October. The unemployment rate increased by 0.1 percentage points to 7.1% in November.
Compared with 12 months earlier, employment increased by 124,000 or 0.7%, with all the growth in full-time work. Over the same period, the number of hours worked grew by 1.1%.
In November, employment declined among youths aged 15 to 24, while there was little change among the other demographic groups.
Provincially, employment fell in Alberta, Manitoba, New Brunswick and Prince Edward Island. In the other provinces, employment was virtually unchanged.
There were fewer people employed in public administration; wholesale and retail trade; information, culture and recreation; as well as finance, insurance, real estate and leasing. At the same time, there were more people employed in professional, scientific and technical services, manufacturing, construction, and agriculture.
The number of employees decreased in both the private and public sectors in November, while the number of self-employed increased.
Youth employment down
In November, employment fell by 24,000 among youths aged 15 to 24. However, as fewer youths participated in the labour market, their unemployment rate declined 0.6 percentage points to 12.7%, the lowest rate since 2008. Compared with 12 months earlier, employment for youths decreased by 46,000 (-1.8%), while their population declined by 41,000 (-0.9%).
Among people aged 25 to 54, employment was virtually unchanged in both November and on a year-over-year basis. Compared with November 2014, the unemployment rate for people in this group increased 0.6 percentage points to 6.1% as more of them searched for work.
Employment among people aged 55 and older was little changed in November. However, their unemployment rate increased 0.6 percentage points to 6.0% as more of them were seeking work. In the 12 months to November, employment for this group rose 184,000 (+5.3%). Over the same period, the population of this group increased by 311,000 (+3.1%).
Employment losses in several provinces
In Alberta, employment declined for the second consecutive month, down 15,000 in November. The unemployment rate increased by 0.4 percentage points to 7.0%, the highest rate since April 2010. Compared with 12 months earlier, employment in the province was virtually unchanged.
After three months of increase, employment in Manitoba fell by 5,400 in November. This decline pushed the unemployment rate up 0.8 percentage points to 6.1%. On a year-over-year basis, employment in the province was little changed.
Employment in New Brunswick decreased by 3,000 in November. The unemployment rate was little changed at 8.7% as fewer people participated in the labour market. Compared with November 2014, employment in the province was little changed.
In Quebec, employment was little changed for the fourth consecutive month in November, and the unemployment rate was 7.5%. Compared with 12 months earlier, employment in the province was up 30,000 (+0.7%), the result of gains in full-time work.
In Ontario, employment was also little changed in November, and the unemployment rate was 6.9%. In the 12 months to November, gains in full-time work were offset by declines in part-time work.
Employment in British Columbia was virtually unchanged in November, and the unemployment rate was 6.2%. However, employment in this province has been on an upward trend since the spring, bringing year-over-year gains to 60,000 or 2.6%, the highest employment growth rate among the provinces.
Industry perspective
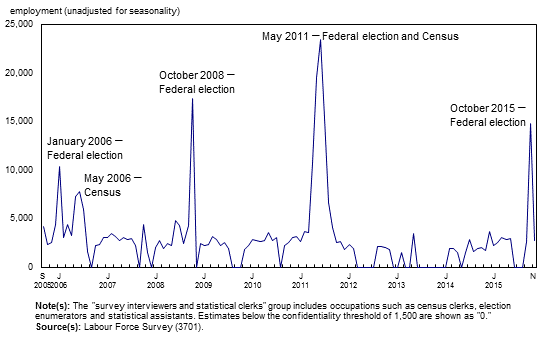
Employment in public administration declined by 33,000 in November, offsetting an increase of 32,000 in October that coincided with activities related to the federal election. On a year-over-year basis, employment in this industry was virtually unchanged.
The decline in public administration in November was seen across all provinces, mainly in federal public administration and temporary work. The decrease was concentrated among survey interviewers and statistical clerks, an occupational group that corresponds with the type of work done during the election. Similar movements in this occupation group were observed during previous federal elections and censuses.
In November, there were 16,000 fewer people employed in the wholesale and retail trade industry, with most of the decline in the wholesale sector. Employment in this industry was little changed compared with a year earlier.
Employment fell by 12,000 in information, culture and recreation in November, bringing employment back to a level similar to that of 12 months earlier.
The number of workers in finance, insurance, real estate and leasing was down 11,000 in November. Compared with 12 months earlier, however, employment in this industry was virtually unchanged.
In professional, scientific and technical services, employment increased by 18,000 in November. Employment in this industry trended up throughout most of the year, with gains totalling 56,000 (+4.2%) on a year-over-year basis.
In November, there were 17,000 more people employed in manufacturing, the first notable increase since May. In the 12 months to November, employment in this industry was little changed.
In construction, employment rose by 15,000 in November, but was virtually unchanged compared with the same month a year earlier.
Employment in agriculture was also up 15,000 in November. Before adjusting for seasonal factors, the number of people working in agriculture declined less than usual from October to November, resulting in a seasonally adjusted increase. On a year-over-year basis, employment was little changed in this industry.
In November, the number of employees declined by 41,000 in the private sector, and by 21,000 in the public sector. On the other hand, the number of self-employed increased by 26,000.
Compared with 12 months earlier, public sector employment was up 55,000 (+1.5%), driven by gains in health care and social assistance. Over the same period, the number of private sector employees and the number of self-employed were little changed.
Upcoming revisions
A standard revision to the Labour Force Survey (LFS) data will be released on January 26 and 27, 2016.
Occupation data estimates will be reclassified to the 2011 National Occupational Classification from the 2006 National Occupational Classification for Statistics.
New CANSIM tables will be created for all occupation-related series and will be available from the start of each respective series. A list of the occupation tables is now available.
At the same time, the North American Industry Classification System (NAICS) 2012 will replace the NAICS 2007. This change will not affect the LFS CANSIM tables as there were only minor changes at the four-digit level.
In addition to updating the classification systems, the LFS seasonally adjusted estimates will be revised back to January 2013 using the latest seasonal factors. The revised estimates will be available in CANSIM on January 26, 2016.
Note to readers
The LFS estimates for November are for the week of November 8 to 14.
The LFS estimates are based on a sample and are therefore subject to sampling variability. As a result, monthly estimates will show more variability than trends observed over longer time periods. For more information, see Interpreting Monthly Changes in Employment from the Labour Force Survey. Estimates for smaller geographic areas or industries also have more variability. For an explanation of sampling variability of estimates and how to use standard errors to assess this variability, consult the "Data quality" section of the publication Labour Force Information (71-001-X).
This analysis focuses on differences between estimates that are statistically significant at the 68% confidence level.
The employment rate is the number of employed persons as a percentage of the population 15 years of age and older. The rate for a particular group (for example, youths aged 15 to 24) is the number employed in that group as a percentage of the population for that group.
The unemployment rate is the number of unemployed as a percentage of the labour force (employed and unemployed).
The participation rate is the number of employed and unemployed as a percentage of the population.
For more detailed information, see the Guide to the Labour Force Survey (71-543-G).
Seasonal adjustment
Unless otherwise stated, this release presents seasonally adjusted estimates, which facilitates comparisons by removing the effects of seasonal variations. For more information on seasonal adjustment, see Seasonally adjusted data – Frequently asked questions.
Chart 1 shows trend-cycle data on employment. These data represent a smoothed version of the seasonally adjusted time series, which provide information on longer-term movements, including changes in direction underlying the series. These data are available in CANSIM table 282-0087 for the Canada-level employment series. For more information, see the StatCan Blog and Trend-cycle estimates – Frequently asked questions.
Sample redesign
Every 10 years, the LFS undergoes a sample redesign to reflect changes in population and labour market characteristics, as well as new definitions of geographical boundaries. The redesigned sample was introduced in January 2015 and was fully implemented in June 2015.
Next release
The next release of the LFS will be on January 8, 2016.
Products
A more detailed summary, Labour Force Information (71-001-X), is now available for the week ending November 14. From the Browse by key resource module of our website under Publications, choose All subjects then Labour.
Summary tables are now available online. From the Browse by subject module of our website, choose Labour.
With this release, the nine seasonally adjusted CANSIM tables as well as an economic region table will include a new data quality dimension. The seasonally adjusted tables will include the standard error of the estimate, of the month-to-month change, and of the year-over-year change. The economic region table will include the standard error of the estimate and of the year-over-year change. These data quality indicators go back to 2001, and they are included in CANSIM tables 282-0087 to 282-0089, 282-0092 to 282-0094, 282-0100, 282-0122, 282-0135 and 282-0136.
Eight new tables for the off-reserve Aboriginal population are available in CANSIM. These tables provide annual data going back to 2007, and are the following: 282-0226, 282-0227, 282-0228, 282-0229, 282-0230, 282-0231, 282-0232 and 282-0233.
Contact information
For more information, contact us (toll-free 1-800-263-1136; 514-283-8300; STATCAN.infostats-infostats.STATCAN@canada.ca).
To enquire about the concepts, methods or data quality of this release, contact Andrew Fields (613-951-3551; andrew.fields@canada.ca) or Emmanuelle Bourbeau (613-951-3007; emmanuelle.bourbeau@canada.ca), Labour Statistics Division.
- Date modified:


