Canadian international merchandise trade, January 2016
Archived Content
Information identified as archived is provided for reference, research or recordkeeping purposes. It is not subject to the Government of Canada Web Standards and has not been altered or updated since it was archived. Please "contact us" to request a format other than those available.
Released: 2016-03-04
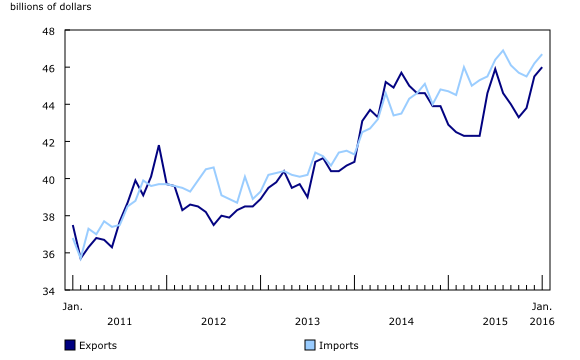
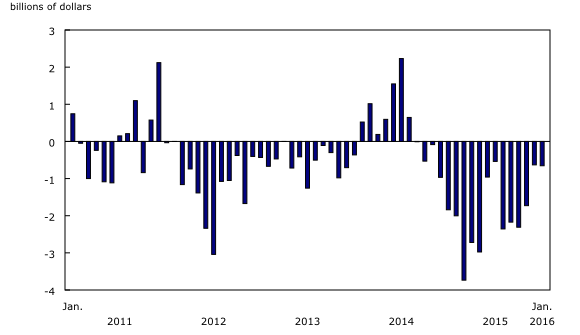
Canada's imports increased 1.1% in January to $46.7 billion. Import volumes increased 1.6% while prices were down 0.5%. Exports totalled $46.0 billion, up 1.0% from December. Export volumes rose 3.6% and prices declined 2.5%. Consequently, Canada's merchandise trade deficit with the world widened from $631 million in December to $655 million in January.
Trade up with the US, mixed results elsewhere
Exports to countries other than the United States declined 3.7% to $11.1 billion in January. Meanwhile, imports from countries other than the United States increased 1.1% to $15.4 billion. Countries other than Canada's principal trading partners were the main drivers behind both the decrease in exports and increase in imports. As a result, Canada's trade deficit with countries other than the United States widened from $3.8 billion in December to $4.4 billion in January.
Exports to the United States advanced 2.6% to $34.9 billion in January. Meanwhile, imports from the United States were up 1.1% to $31.2 billion. Consequently, Canada's trade surplus with the United States widened from $3.1 billion in December to $3.7 billion in January.
Motor vehicles and parts lead the rise in imports
Total imports were up 1.1% to $46.7 billion in January, as 9 of 11 sections increased. Gains in motor vehicles and parts as well as consumer goods were partially offset by the decline in aircraft and other transportation equipment and parts. Year over year, imports rose 4.4%.
Imports of motor vehicles and parts were up 3.3% to a record $9.0 billion. The main contributor was motor vehicle engines and motor vehicle parts, up 8.2% to $4.1 billion, the fourth consecutive monthly gain. Overall, volumes were up 1.7% and prices increased 1.6%.
Imports of consumer goods rose 1.8% to $10.3 billion. Prices increased 1.0% and volumes were up 0.8%. Widespread increases throughout the section were led by pharmaceutical and medicinal products (+2.7%), meat products (+9.4%), and clothing, footwear and accessories (+2.2%).
Partially offsetting these gains, imports of aircraft and other transportation equipment and parts declined 16.1% to $1.7 billion, after reaching a record $2.0 billion in December 2015. Imports of aircraft decreased $373 million to reach $276 million in January. Meanwhile, imports of ships, locomotives, railway rolling stock, and rapid transit equipment rose $134 million to reach $202 million.
Large offsetting movements underlie the increase in exports
Total exports increased 1.0% to a record $46.0 billion in January. Increases in consumer goods as well as motor vehicles and parts were moderated by decreases in aircraft and other transportation equipment and parts as well as energy products. Exports excluding energy products increased 2.3%. Year over year, total exports were up 7.3%.
Exports of consumer goods rose 13.7% to $7.3 billion on higher volumes. Exports of miscellaneous goods and supplies increased 52.3% to $1.2 billion; the growth in this commodity grouping was led by "articles of precious metal." In addition, pharmaceutical and medicinal products were up 30.9% to a record $1.4 billion.
Exports of motor vehicles and parts increased 7.2% to $9.1 billion. Exports of passenger cars and light trucks rose 5.9% to $6.3 billion, the fourth consecutive monthly increase. Motor vehicle engines and motor vehicle parts were up 12.9% to $2.2 billion. For the section as a whole, volumes increased 5.4% and prices were up 1.7%.
Moderating these gains, exports of aircraft and other transportation equipment and parts fell 35.2% to $1.5 billion. The main contributor was aircraft exports, down 74.2% to $287 million following an 88.5% increase in December 2015.
Exports of energy products declined 7.7% to $5.5 billion in January. Overall, prices decreased 14.4% while volumes increased 7.8%. Exports of crude oil and crude bitumen fell 11.3% to $3.6 billion.
Real exports advance at a higher pace
In real (or volume) terms, exports increased 3.6% in January, led by energy products and consumer goods. At the same time, import volumes were up 1.6%. Consequently, Canada's trade surplus in real terms widened from $2.5 billion in December to $3.4 billion in January, the eighth consecutive monthly real surplus. Year over year, real exports rose 8.8% while imports declined 0.9%.
Revisions to December imports and exports
Revisions reflect initial estimates being updated or replaced with administrative and survey data as they became available, as well as amendments made for late documentation of high-value transactions. Imports in December, originally reported as $45.9 billion in last month's release, were revised to $46.2 billion with the current month release. Exports, originally reported as $45.4 billion in last month's release, were revised to $45.5 billion.
Note to readers
Merchandise trade is one component of Canada's international balance of payments (BOP), which also includes trade in services, investment income, current transfers as well as capital and financial flows.
International trade data by commodity are available on both a BOP and a customs basis. International trade data by country are available on a customs basis for all countries, and on a BOP basis for Canada's 27 principal trading partners (PTPs). The list of PTPs is based on their annual share of total merchandise trade—imports and exports—with Canada in 2012. BOP data are derived from customs data by making adjustments for factors such as valuation, coverage, timing and residency. These adjustments are made to conform to the concepts and definitions of the Canadian System of National Accounts.
For a BOP versus customs-based data conceptual analysis, see "Balance of Payments trade in goods at Statistics Canada: Expanding geographic detail to 27 principal trading partners."
Data in this release are on a BOP basis, seasonally adjusted and in current dollars. Constant dollars are calculated using the Laspeyres volume formula (2007=100).
For information on seasonal adjustment, see Seasonally adjusted data – Frequently asked questions.
Revisions
In general, merchandise trade data are revised on an ongoing basis for each month of the current year. Current year revisions are reflected in both the customs and BOP based data.
The previous year's customs data are revised with the release of the January and February reference months as well as on a quarterly basis. The previous two years of customs based data are revised annually and are released in February with the December reference month.
The previous year's BOP based data are revised with the release of the January, February, March and April reference months. To remain consistent with the Canadian system of macroeconomic accounts, revisions to BOP based data for previous years are released annually in December with the October reference month.
Factors influencing revisions include late receipt of import and export documentation, incorrect information on customs forms, replacement of estimates produced for the energy section with actual figures, changes in classification of merchandise based on more current information, and changes to seasonal adjustment factors.
For information on data revisions for crude oil and natural gas, see "Revisions to trade data for crude oil and natural gas."
Revised data are available in the appropriate CANSIM tables.
Real-time CANSIM tables
Real-time CANSIM table 228-8059 will be updated on March 15. For more information, consult the document Real-time CANSIM tables.
Next release
Data on Canadian international merchandise trade for February will be released on April 5.
Products
Customs based data are now available in the Canadian International Merchandise Trade Database (65F0013X). From the Browse by key resource module of our website, choose Publications.
The January 2016 issue of Canadian International Merchandise Trade, Vol. 70, no. 1 (65-001-X), is also available from the Browse by key resource module of our website under Publications.
Contact information
For more information, contact us (toll-free 1-800-263-1136; 514-283-8300; STATCAN.infostats-infostats.STATCAN@canada.ca).
To enquire about the concepts, methods or data quality of this release, contact Nita Boushey (613-404-4965; nita.boushey@canada.ca), International Accounts and Trade Division.
- Date modified:


