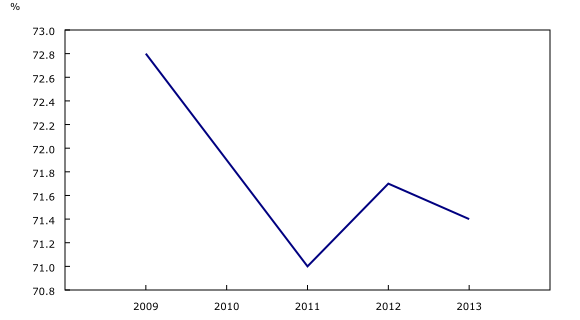
Gross domestic product at basic prices, by census metropolitan area, 2009 to 2013
Archived Content
Information identified as archived is provided for reference, research or recordkeeping purposes. It is not subject to the Government of Canada Web Standards and has not been altered or updated since it was archived. Please "contact us" to request a format other than those available.
Released: 2017-01-27
The gross domestic product (GDP) of Canada's 33 census metropolitan areas (CMAs) totalled $1.3 trillion in 2013. The share of GDP in current dollars coming from the CMAs declined from 72.8% in 2009 to 71.4% in 2013. The main reason for the decline was increased mining and oil and gas extraction activities in non-CMA areas, which coincided with commodity price shifts during the period.
Mining and oil and gas extraction was one of only two sectors—the other being agriculture, forestry, fishing and hunting—where the CMAs did not account for more than half of the value of production.
Edmonton, Calgary increase share of gross domestic product
From 2009 to 2013, more than half of Canada's GDP was produced in the six CMAs with a population of 1 million or more. Among these CMAs, the share of GDP coming from Edmonton and Calgary increased during this period, while it declined in Toronto, Montréal and Ottawa–Gatineau. Vancouver's share was essentially unchanged.
Calgary's share of GDP rose from 5.2% in 2009 to 5.7% in 2013, while Edmonton saw an increase from 4.8% to 5.5% over the same time period. The higher shares of GDP were linked to commodity price shifts, as the main sources of growth came from oil and gas and engineering construction in both CMAs. These increases were also the result of mining, quarrying and oil and gas extraction in Calgary and petroleum refining in Edmonton.
The contribution of the Toronto CMA to GDP declined from 19.2% in 2009 to 18.6% in 2013, as a result of lower contributions from manufacturing as well as finance, insurance, real estate, rental and leasing, and holding companies.
Montréal's share of GDP decreased from 10.8% in 2009 to 10.2% in 2013. The CMA's share of manufacturing GDP declined from 14.1% in 2009 to 12.8% in 2013, as a result of lower output from petroleum refineries, and pharmaceutical and medicine manufacturing.
Ottawa–Gatineau's contribution to GDP declined from 4.3% in 2009 to 4.0% in 2013, the result of lower output from the telecommunications industry.
Vancouver's share of GDP averaged 6.8% from 2009 to 2013. Lower contributions to GDP from government as well as finance, insurance, real estate, rental and leasing and holding companies were offset by higher contributions from mining, quarrying and oil and gas extraction, construction and owner-occupied housing.
Winnipeg is the largest contributor to provincial gross domestic product
Among the 33 CMAs, Winnipeg was the most dominant in its province, accounting for an average of 65% of Manitoba's GDP from 2009 to 2013. Winnipeg's main industries were the government sector, trade and transportation as well as finance, insurance, rental, real estate and holding companies.
Vancouver was the second most dominant CMA in a province with an average contribution of 56% to British Columbia's GDP. The other CMAs contributing more than half of their province's GDP were Halifax, Montréal and Toronto.
In 2013, Windsor was the CMA most dependent on manufacturing for its economic activity, with this sector accounting for 28% of its GDP. Ottawa–Gatineau and Victoria were the least dependent on manufacturing at about 3%.
Following Ottawa–Gatineau, Kingston, Ontario, was the CMA most dependent on the government sector, which accounted for over 40% of its GDP. Calgary was the least dependent at about 10%.
The Greater Sudbury CMA in Ontario was the most dependent on commodity price fluctuations, with almost one-quarter of its GDP coming from mining. No other CMA had a dependence on the extraction industries that exceeded 15%, even when mining and oil and gas extraction were combined.
Gross domestic product per capita
Edmonton overtook Calgary as the CMA with the highest per capita GDP in 2013. The top five cities in 2013 in terms of per capita GDP (Edmonton, Calgary, Regina, St. John's and Saskatoon) all had a significant part of their economy depending on oil and gas (including extraction, petroleum refining and construction).
Two of the CMAs that were among the top 10 for per capita GDP in 2009 had fallen out of the leading group by 2013. Victoria slipped from 8th to 13th place, while Kitchener–Waterloo–Cambridge slipped from 9th to 11th place. They were replaced by Guelph (which rose from 15th to 7th place) and Greater Sudbury (up to 8th place from 16th). The increase in Guelph was due to higher output from its manufacturing sector, while mining was the main contributor to the increase in Greater Sudbury.
Gross domestic product of large census metropolitan areas, 2009 and 2013 (in current dollars)
Note to readers
This release of gross domestic product by census metropolitan area provides revised estimates for 2009 and new estimates for 2010 to 2013. The release completes the conversion of the experimental estimates for 2001 to 2009 (published in CANSIM table 381-5000 in November 2014) into an annual product. Moving forward, the annual production cycle will lag the reference year by approximately three and a half years.
Contact information
For more information, or to enquire about the concepts, methods or data quality of this release, contact us (toll-free 1-800-263-1136; 514-283-8300; STATCAN.infostats-infostats.STATCAN@canada.ca) or Media Relations (613-951-4636; STATCAN.mediahotline-ligneinfomedias.STATCAN@canada.ca).
- Date modified:


