
Impaired driving in Canada, 2011

Archived Content
Information identified as archived is provided for reference, research or recordkeeping purposes. It is not subject to the Government of Canada Web Standards and has not been altered or updated since it was archived. Please "contact us" to request a format other than those available.
By Samuel Perreault
- Fourth increase in five years for the police-reported impaired driving rate
- Impaired driving rates highest in the territories, Saskatchewan and Prince Edward Island
- Impaired driving rates highest outside of metropolitan areas
- Impaired driving rates highest for 20- to 24-year-olds
- Impaired driving rates increase for women
- Impaired driving incidents peak shortly after bars close
- Impaired driving cases in adult criminal courts
- Impaired driving is the most common offence in cases completed in adult criminal courts
- Slight increase in the median time to complete an impaired driving case
- More than 4 out of 5 impaired driving cases resulted in a guilty outcome
- Fewer prison sentences but average sentence length is increasing
- More than four in ten admissions to sentenced custody for impaired driving are served intermittently
- Summary
- Survey descriptions
- Detailed data tables
- References
- Notes
Impaired driving has been a recognized criminal act in Canada since 1921. Despite a sizeable drop in the impaired driving rate since the mid-1980s, impaired driving is the leading cause of criminal death in Canada.Note 1 Impaired driving continues to be an important issue for governments throughout Canada, as well as for police services, the justice system, community organizations and the general public.
In Canada, the Criminal Code prohibits driving while one's ability to operate a vehicle is impaired by alcohol or drugs. It is also an offence to drive with a blood alcohol concentration (BAC) in excess of 80 mg of alcohol per 100 ml of blood. In recent decades, the federal government has implemented numerous measures to combat impaired driving. For example, a number of amendments have been made to the Criminal Code to increase the minimum and maximum penalties for impaired driving, with the most recent amendment introduced in July 2008.
In addition to the measures taken by the federal government, the provinces and territories have instituted administrative penalties or controls that allow immediate action to be taken against suspected impaired drivers. All jurisdictions except Quebec have also implemented temporary preventive suspensions for drivers with a BAC that is considered elevated, but still below the criminal limit of .08 set out in the Criminal Code. As well, all provinces have adopted zero BAC limits for novice drivers as part of graduated driver-licensing schemes (Standing Committee on Justice and Human Rights 2009), while half have adopted similar limits for all young drivers, whether or not they are novice.
These provincial and territorial administrative sanctions enable police to remove drivers who have been drinking from the road, yet avoid the longer time required for the police to process a Criminal Code impaired driving charge (Standing Committee on Justice and Human Rights 2009).
This Juristat article analyzes trends in police-reported impaired driving in Canada, as defined by the Criminal Code, the penalties imposed by the courts, as well as characteristics of those admitted to correctional services for an impaired driving conviction.
Fourth increase in five years for the police-reported impaired driving rate
According to data from the Uniform Crime Reporting (UCR) survey, police reported 90,277 impaired driving incidents in Canada in 2011, about 3,000 more than in 2010 (Table 1). The rate of 262 incidents per 100,000 population was 2% higher than in 2010, the fourth increase in the last five years.Note 2 (Chart 1).
Chart 1
Police-reported impaired driving incidents, Canada, 1986 to 2011
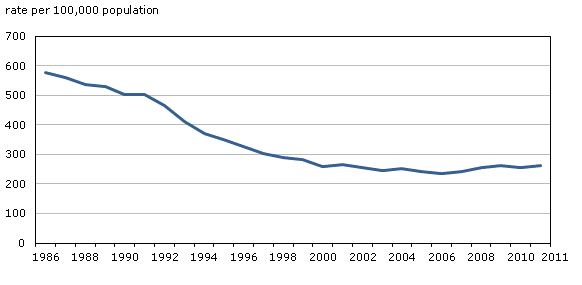
Note: Rates are calculated on the basis of 100,000 population (all ages). Populations based upon July 1st estimates from Statistics Canada, Demography Division. Based on incidents where impaired driving was the most serious offence.
Source: Statistics Canada, Canadian Centre for Justice Statistics, Uniform Crime Reporting Survey.
The impaired driving rate generally declined from the mid-1980s to 2006, when it reached its lowest point in over 25 years, at 234 incidents per 100,000 population. Over time, the number of police-reported impaired driving incidents can vary depending on various factors such as legislative changes, law enforcement practices (e.g., increased use of roadside checks) and changing attitudes toward drunk driving.
Police reported 121 incidents of impaired driving causing death in 2011, a rate of 0.35 per 100,000 population. The rate of impaired driving causing death dropped 29% in 2011, reaching its lowest point in over 25 years. According to Transport Canada (2011), alcohol use was a factor in almost 30% of deaths from vehicle crashes during the period 2003 to 2005.Note 3, Note 4
Police also reported a further 839 incidents of impaired driving causing bodily harm in 2011, half the number reported 25 years ago. The rate of impaired driving causing bodily harm has declined 60% over this period.
According to data provided by selected police services,Note 5 the average blood alcohol concentration (BAC) of those charged with impaired driving in 2010 ranged from 144 to 169 mgs, about twice the legal limit of 80 mg per 100 ml of blood. According to the Traffic Injury Research Foundation (2009), impaired drivers with a BAC over 160 mg/100 ml represented close to 70% of impaired drivers killed in car accidents.
In July 2008, Criminal Code provisions came into force allowing police to perform compulsory roadside analyses and assessments of drivers suspected of drug impairment. In 2011, 1,886 incidents of drug-impaired driving were reported by police, 157 more than the previous year. This represented 2% of all impaired driving incidents. Of these drug-impaired driving incidents in 2011, 18 had caused injury and 2 had caused death.
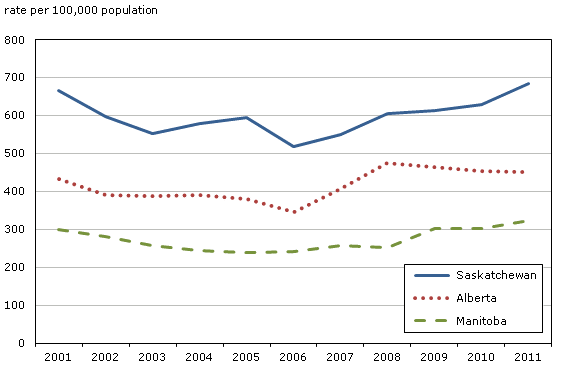
Impaired driving rates highest in the territories, Saskatchewan and Prince Edward Island
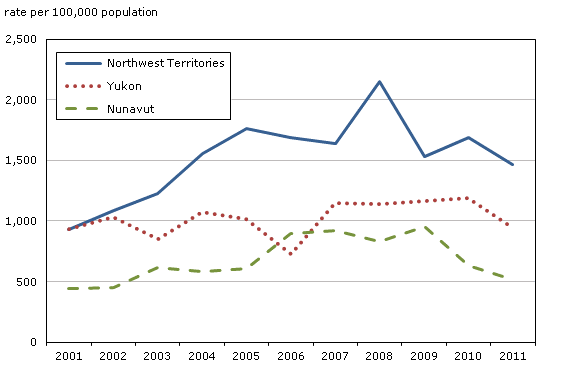
Among the provinces, Saskatchewan and Prince Edward Island had the highest impaired driving rates in 2011. Only the Northwest Territories and Yukon had higher rates than Saskatchewan. In contrast, Ontario and Quebec reported the lowest rates (Chart 2 and Table 2).
Chart 2
Police-reported impaired driving incidents, by province and territory, 2011
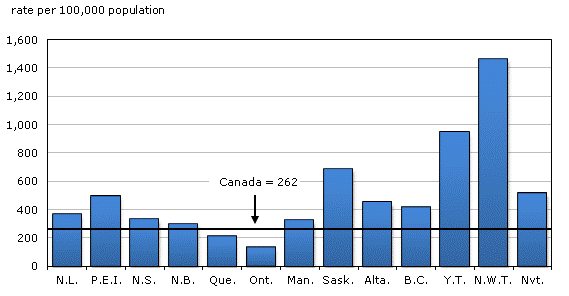
Note: Rates are calculated on the basis of 100,000 population (all ages). Populations based upon July 1st estimates from Statistics Canada, Demography Division. Based on incidents where impaired driving was the most serious offence.
Source: Statistics Canada, Canadian Centre for Justice Statistics, Uniform Crime Reporting Survey.
Trends in impaired driving rates have varied across the country over the last decade. Since 2001, the largest increases among the provinces have been seen in Newfoundland and Labrador (despite a drop in 2011) and British Columbia. While most of the other provinces have generally followed the national trend of increasing rates since 2006, the impaired driving rate has continued to decline in Quebec and Ontario (Charts 3, 4, 5 and 6).
Chart 3
Police-reported impaired driving incidents, Atlantic provinces, 2001 to 2011
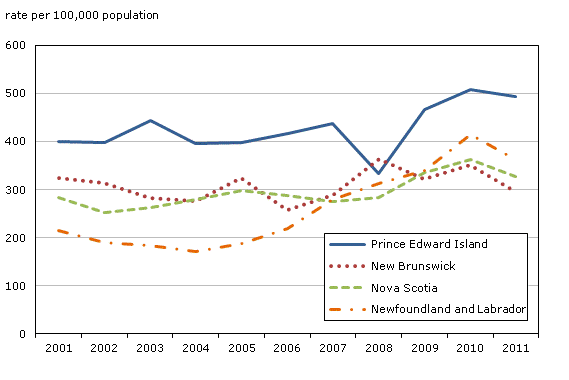
Note: Rates are calculated on the basis of 100,000 population (all ages). Populations based upon July 1st estimates from Statistics Canada, Demography Division. Based on incidents where impaired driving was the most serious offence.
Source: Statistics Canada, Canadian Centre for Justice Statistics, Uniform Crime Reporting Survey.
Chart 4
Police-reported impaired driving incidents, Quebec, Ontario and British Columbia, 2001 to 2011
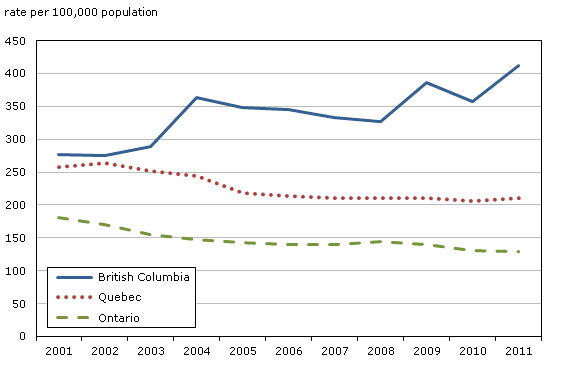
Note: Rates are calculated on the basis of 100,000 population (all ages). Populations based upon July 1st estimates from Statistics Canada, Demography Division. Based on incidents where impaired driving was the most serious offence.
Source: Statistics Canada, Canadian Centre for Justice Statistics, Uniform Crime Reporting Survey.
Chart 5
Police-reported impaired driving incidents, Prairie provinces, 2001 to 2011
Note: Rates are calculated on the basis of 100,000 population (all ages). Populations based upon July 1st estimates from Statistics Canada, Demography Division. Based on incidents where impaired driving was the most serious offence.
Source: Statistics Canada, Canadian Centre for Justice Statistics, Uniform Crime Reporting Survey.
Chart 6
Police-reported impaired driving incidents, territories, 2001 to 2011
Note: Rates are calculated on the basis of 100,000 population (all ages). Populations based upon July 1st estimates from Statistics Canada, Demography Division. Based on incidents where impaired driving was the most serious offence.
Source: Statistics Canada, Canadian Centre for Justice Statistics, Uniform Crime Reporting Survey.
Impaired driving rates highest outside of metropolitan areas
Impaired driving rates reported by police services in census metropolitan areas (CMAs)Note 6 are generally lower than rates reported by police outside of Canada's CMAs. The average rate reported by the 33 CMAs in 2011 was 181 incidents per 100,000 population, less than one-half the rate of 436 reported in non-CMAs (Table 3).
The rate for the 10 largest CMAs (population of more than 500,000) was even lower, at 165 per 100,000 population. The lower rates recorded in CMAs could be related to greater access to public transportation compared with smaller communities.
Among the CMAs, the highest rates were recorded in Kelowna and St. John's, well above the rate reported in the next highest CMA, Regina. In contrast, Ottawa, London and Kingston had the lowest impaired driving rates (Table 3).
Two-thirds of CMAs reported declines in their impaired driving rate over the past decade. The largest declines (50% and over) were reported in London and Windsor. However, impaired driving rates increased in a number of CMAs, most noticeably in St. John's and Abbotsford–Mission where the rates more than doubled since 2001. Increases of 50% or more over the past decade were also reported in Kelowna, Victoria, MonctonNote 7 and Vancouver.
Text box 1
How many Canadians drive while impaired?
Police-based statistics are limited to those incidents that come to the attention of legal authorities, leaving a gap in our knowledge of unreported crime. Self-reported data, which consists of asking Canadians about their own impaired driving experiences, can be used to address this gap.
In 2008 and 2010, Canadians in selected provinces who responded to the Canadian Community Health Survey (CCHS) were asked if, in the year prior to the survey, they ever drove after having two or more drinks in the preceding hour. Overall, the proportion of people who reported they had varied from 3% in Newfoundland and Labrador and 4% in Ontario to 10% in Saskatchewan and 11% in Yukon (Table 4). Males were more likely than females to report driving after having two or more drinks in the preceding hour. In particular, in Ontario, males were nine times more likely than females to report they had driven a vehicle within an hour of consuming two or more alcoholic drinks.
Other surveys show similar results. The Traffic Injury Research Foundation (2011) found that, in 2011, 5.4% of Canadians reported driving when they thought they were over the legal limit in the previous 12 months. The 2004 Canadian Addiction Survey revealed that 12% of drivers had driven a vehicle within an hour of consuming two or more alcoholic drinks and that less than 5% of drivers were responsible for 86% of impaired driving occurrences (Beirness and Davis 2007).
End of text box 1.
Characteristics of impaired driving
Impaired driving rates highest for 20- to 24-year-olds
Young adults are over-represented among accused persons for most crimes, including impaired driving. In 2011, based on the number of licensed drivers, the highest impaired driving rates were recorded for those aged 20 to 24 (Chart 7). The rate then declines with increasing age.
Chart 7
Persons accused of impaired driving, by age group, Canada, 2011
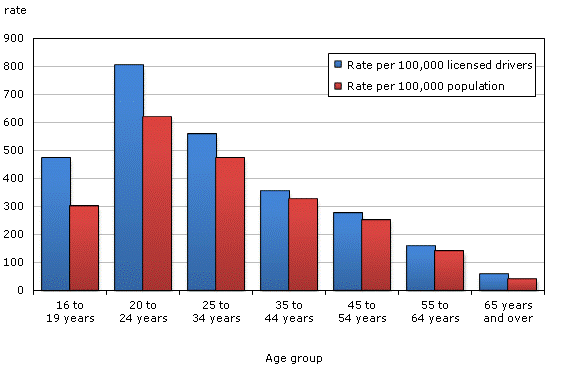
Note: Includes persons who were formally charged by police (or recommended for charging), as well as those who were dealt with by other means than the formal laying of a charge (e.g., diversion programs). Rates per 100,000 population are calculated based upon July 1st, 2011 population estimates from Statistics Canada, Demography Division. Rates per 100,000 licensed drivers are calculated based upon licensed drivers 2010 numbers from Transport Canada. Based upon incidents with at least one impaired driving offence.
Source: Statistics Canada, Canadian Centre for Justice Statistics, Uniform Crime Reporting Survey (2011). Data for licensed drivers come from Transport Canada (2010).
The youngest age group, those aged 16 to 19, had an impaired driving rate per 100,000 licensed drivers slightly lower than that for 25- to 34-year-olds and about 40% lower than the rate for 20- to 24-year-olds. Most provinces impose more severe restrictions on young or novice drivers, which might have an influence on their attitudes, opportunities and actions related to drinking and driving. Also, in all provinces, it is illegal for those under the age of either 18 or 19 to drink or buy alcohol.
Drivers under 35 years of age were particularly over-represented for the most serious incidents. While they account for about one-third of licensed drivers, they accounted for two-thirds of those accused of impaired driving causing death and causing injury in 2011.
Impaired driving rates increase for women
The vast majority (82%) of persons charged with impaired driving are male. However, the impaired driving rate for males has been steadily declining for the past 25 years. The trend for females is somewhat different. The rate for females declined until 1997, remained stable until 2005, and then generally increased since. As a result, females now account for 1 in every 6 impaired drivers compared to 1 in 13 in 1986 (Table 1).
Impaired driving incidents peak shortly after bars close
One-half (50%) of impaired driving incidents reported by police take place between 11 p.m. and 4 a.m. The peak is usually reached between 2 a.m. and 3 a.m.—the hour after bars close in most provinces. For example, in Quebec, where bars stop serving alcohol at 3 a.m., the peak is instead reached between 3 a.m. and 4 a.m.
Impaired driving incidents are also more likely to occur on weekends, defined here as from midnight Friday to 11:59 p.m. Sunday, during which nearly two-thirds of such incidents are reported. Generally, reports of impaired driving incidents are lowest on Mondays and Tuesdays, after which the number of incidents gradually rises, peaking on Saturdays (Chart 8).
Chart 8
Number of police-reported impaired driving incidents, by time and day, Canada, 2011
Note: Includes all incidents where there was at least one impaired driving offence.
Source: Statistics Canada, Canadian Centre for Justice Statistics, Uniform Crime Reporting Survey.
Some periods of the year might be perceived as more likely times for impaired driving incidents. For example, many roadside checks take place during the holiday period (RCMP 2010). However, variations from season to season are relatively small, ranging from 21% of impaired driving offences being recorded during winter to 27% in summer.Note 8 While there is little variation in the number of impaired driving incidents reported by police from season to season, there are some variations from month to month, and from one weekend to another. A number of factors, such as roadside checks, can influence the prevalence of reporting of impaired driving during a specific month or a specific weekend.
In 2011, July was the busiest month, with an average of 305 impaired driving incidents reported per day. In comparison, January was the quietest month, with an average of 195 incidents per day. The busiest weekend was also in July, the weekend around Canada Day. Interestingly, although it is not a holiday, the weekend around Halloween was the third busiest weekend in 2011 and the busiest in 2010 (Text table 1). In contrast, the weekend around Christmas was among the quietest. In addition to roadside checks, this might be related to greater awareness of, and access to, free drive-home services.
| Rank | 2010 | 2011 | ||||
|---|---|---|---|---|---|---|
| Date | Event or holiday | number | Date | Event or holiday | number | |
| 1 | Oct. 29 to 31 | Halloween | 1,352 | July 1 to 3 | Canada Day | 1,449 |
| 2 | Dec. 17 to 19 | Christmas approaching | 1,291 | July 29 to 31 | Civic/Heritage Day long weekend | 1,411 |
| 3 | Dec. 3 to 5 | Christmas approaching | 1,273 | Oct. 28 to 30 | Halloween | 1,403 |
| 4 | Oct. 8 to 10 | Thanksgiving long weekend | 1,247 | July 15 to 17 | No event or holiday | 1,355 |
| 5 | May 21 to 23 | Victoria Day long weekend | 1,236 | May 20 to 22 | Victoria Day long weekend | 1,341 |
| 6 | Oct. 1 to 3 | No event or holiday | 1,235 | Nov. 25 to 27 | Grey Cup | 1,271 |
| 7 | Sept. 3 to 5 | Labour Day long weekend | 1,234 | Oct. 7 to 9 | Thanksgiving long weekend | 1,243 |
| Note ...: not applicable | Average | Note ...: not applicable | 1,086 | Average | Note ...: not applicable | 1,137 |
| 46 | March 5 to 7 | No event or holiday | 970 | March 4 to 6 | No event or holiday | 967 |
| 47 | Apr. 9 to 11 | No event or holiday | 940 | Feb. 18 to 20 | No event or holiday | 956 |
| 48 | Jan. 22 to 24 | No event or holiday | 934 | March 11 to 13 | No event or holiday | 941 |
| 49 | Jan. 15 to 17 | No event or holiday | 929 | Jan. 21 to 23 | No event or holiday | 906 |
| 50 | Jan. 8 to 10 | No event or holiday | 800 | Jan. 14 to 16 | No event or holiday | 881 |
| 51 | Jan. 1 to 3 | New Year's | 774 | Dec. 23 to 25 | Christmas | 792 |
| 52 | Dec. 24 to 26 | Christmas | 610 | Jan. 7 to 9 | No event or holiday | 707 |
| ... not applicable Note: Weekends include the period from Friday, midnight to Sunday, 11:59 p.m. Includes all incidents where there was at least one impaired driving offence. Source: Statistics Canada, Canadian Centre for Justice Statistics, Uniform Crime Reporting Survey. |
||||||
Text box 2
History of selected amendments to the Criminal Code
1921: Parliament creates, under the Criminal Code, the summary conviction offence of driving while intoxicated.
1969: The 1921 offence of driving while intoxicated is repealed. The offence of driving while impaired is retained and the "exceeds 80 mg of alcohol in 100 ml of blood" offence and the refusal to provide a breath sample on an "approved instrument" offence are added as summary conviction offences.
1985: The prohibition of operating a vehicle while impaired is extended to aircraft and vessels. The maximum sentence is raised to 14 years where impaired operation causes death and to 10 years where it causes bodily harm. A mandatory driving prohibition period is introduced and some adjustments are made to penalties.
1999: Driving with a blood alcohol concentration exceeding 160 mg of alcohol per 100 ml of blood becomes an aggravating factor. Judges can now impose treatment or the use of an ignition interlock device. Driving prohibition periods are increased and the minimum fine for a first impaired driving offence is raised from $300 to $600.
2000: The maximum penalty for impaired driving causing death is increased to life imprisonment.
2008: The minimum fine for a first offence is raised from $600 to $1,000. The minimum penalty for a second offence goes from 14 days to 30 days and for a subsequent offence, from 90 days to 120 days. Also, Parliament introduces new provisions limiting recourse to the so-called "two-beer" defence, which allowed the defence to dispute the results of samples by bringing in an expert to assess the state of inebriation based on the number of drinks consumed, the physical characteristics of the accused and the amount of time during which alcohol was consumed (Department of Justice Canada 2008). Moreover, police are now allowed to perform roadside analysis and assessment of drivers suspected of drug impairment.
End of text box 2.
Impaired driving cases in adult criminal courts
Adult criminal courts data reflect information on the number of criminal court cases, the length of cases, the proportion found guilty and the types of sentences imposed. Data from criminal courts are provided on a fiscal year basis (April to March) and the most recent data are for 2010/2011.Note 9
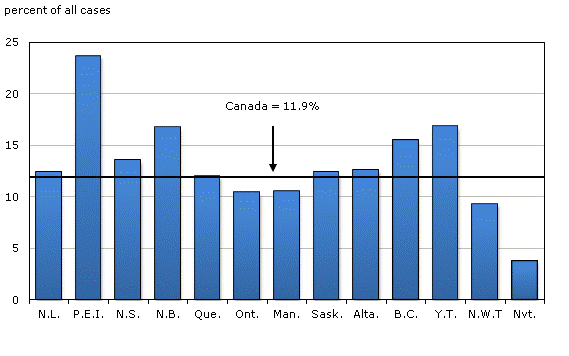
Impaired driving is the most common offenceNote 10 in cases completed in adult criminal courts
In 2010/2011, Canadian courts disposed of just over 48,000 completed cases where impaired driving was the most serious offence, a number similar to the previous year and the past decade (Table 5).Note 11, Note 12 In 2010/2011, completed cases where impaired driving was the most serious offence accounted for 12% of all adult court cases (Chart 9), the highest proportion among all offence types.
Chart 9
Proportion of impaired driving cases among adult criminal courts caseload, by province and territory, 2010/2011
Note: A case is one or more charges against an accused person or corporation that were processed by the courts at the same time and received a final disposition. Counts are based on the most serious offence in a case. Excludes information from superior courts in Prince Edward Island, Quebec, Ontario, Manitoba and Saskatchewan as well as municipal courts in Quebec due to the unavailability of data. Jurisdictional differences in the structure and operation of courts may have an impact on survey results. Therefore, any comparisons between jurisdictions should be made with caution.
Source: Statistics Canada, Canadian Centre for Justice Statistics, Integrated Criminal Courts Survey (Adult component).
In Prince Edward Island, impaired driving cases represented one-quarter (24%) of all cases disposed of in criminal courts in 2010/2011, the highest of any jurisdiction, followed by Yukon and New Brunswick, at 17%. In contrast, the lowest proportions were found in Nunavut (4%) and the Northwest Territories (9%).
Slight increase in the median time to complete an impaired driving case
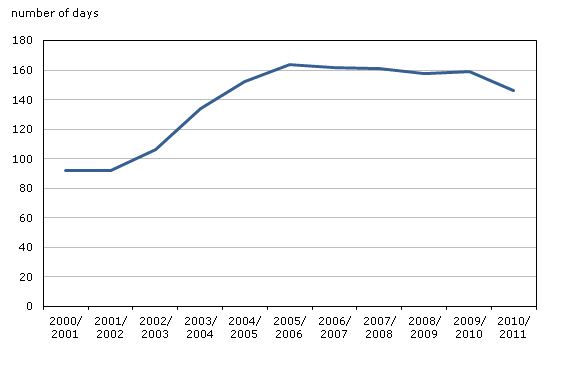
Not only is impaired driving the most common offence in cases completed in adult criminal courts, but these cases generally take longer than other cases to complete. Close to 1 in 4 (24%) impaired driving cases in 2010/2011 lasted more than one year, compared to 1 in 6 (17%) for overall cases. However, the medianNote 13 length of impaired driving cases has decreased slightly over the last five years to 146 days in 2010/2011, although it is still much higher than the low of 92 days in 2000/2001 (Chart 10).Note 14
Chart 10
Median length of impaired driving cases heard by adult criminal courts, Canada, 2000/2001 to 2010/2011
Note: Based upon information from ten provinces and territories that have consistently reported to the adult component of the Integrated Criminal Courts Survey since 2000/2001. The median represents the mid-point of the number of days taken to complete a case, from the first to last court appearance. A case is one or more charges against an accused person or company that were processed by the courts at the same time and received a final disposition. Counts are based on the most serious offence in a case.
Source: Statistics Canada, Canadian Centre for Justice Statistics, Integrated Criminal Courts Survey (Adult component).
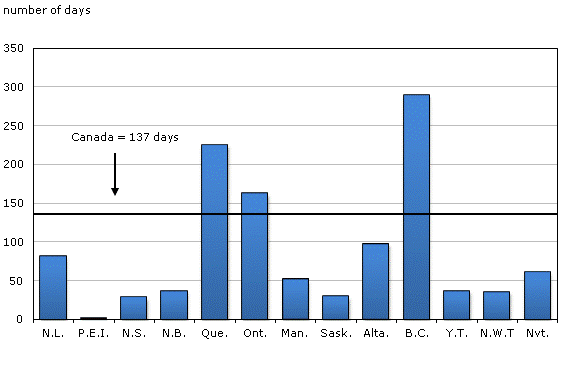
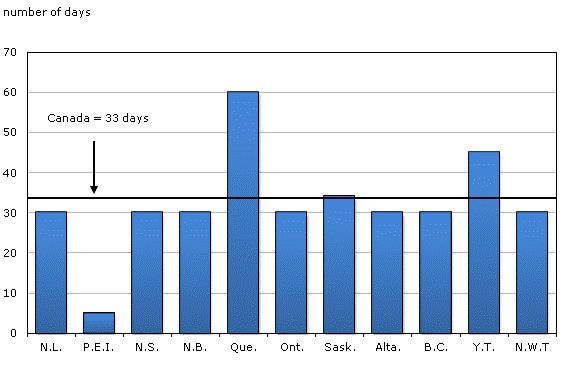
There is wide variation in the length of time to complete an impaired driving case among the provinces and territories. While the median length is below 100 days in most provinces and territories, it was over 150 days in the three largest provinces (Chart 11).
Chart 11
Median length of impaired driving cases in adult criminal courts, by province and territory, 2010/2011
Note: The median represents the mid-point of the number of days taken to complete a case, from the first to last court appearance. A case is one or more charges against an accused person or company that were processed by the courts at the same time and received a final disposition. Counts are based on the most serious offence in a case. Excludes information from superior courts in Prince Edward Island, Quebec, Ontario, Manitoba and Saskatchewan as well as municipal courts in Quebec due to the unavailability of data. Jurisdictional differences in the structure and operation of courts may have an impact on survey results. Therefore, any comparisons between jurisdictions should be made with caution. Median for Prince Edward Island is 1 day.
Source: Statistics Canada, Canadian Centre for Justice Statistics, Integrated Criminal Courts Survey (Adult component).
More than 4 out of 5 impaired driving cases resulted in a guilty outcome
Compared to most other offences, impaired driving cases are more likely to result in a guilty outcome.Note 15 In 2010/2011, more than 4 in 5 (84%) cases resulted in a guilty finding, a proportion that has remained stable over the past ten years. This is higher than the proportion for completed cases in general, at 64%.
There was some variation among jurisdictions in the proportion of impaired driving cases that resulted in a guilty outcome, ranging from 81% in Ontario and Alberta to 93% in Prince Edward Island.
Fewer prison sentences but average sentence length is increasing
In July 2008, the Canadian government introduced amendments to Criminal Code provisions on impaired driving. In addition to raising minimum fines, the minimum prison sentences for repeat offenders were increased from 14 days to 30 days for a second offence, and from 90 days to 120 days for subsequent offences (see Text box 2).
Less than 1 in 10 (8%) impaired driving cases with a finding of guilt resulted in a prison sentence in 2010/2011, a decrease from the 14% sentenced to prison in 2000/2001.Note 16
Over the past decade, the median custodial sentence length has remained stable at around 30 days. However, the mean sentence length continues to increase, from 67 days in 2000/2001 to 90 days in 2010/2011. The longer mean sentences are due to the fact that the number of cases resulting in longer custodial sentences of over 6 months has increased by 22%.
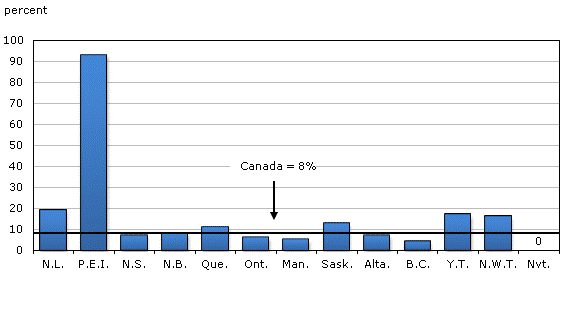
The proportion of persons found guilty of impaired driving who are sentenced to custody varies by jurisdiction. For example, Prince Edward Island imposes a minimum 2 days of sentenced custody for an impaired driving first offence (Chart 12).Note 17 However, the median length of sentence in this province is the lowest for any jurisdiction, at 5 days (Chart 13).
Chart 12
Proportion of impaired driving cases sentenced to custody in adult criminal court, by province and territory, 2010/2011
Note: A case is one or more charges against an accused person or company that were processed by the courts at the same time and received a final disposition. Counts are based on the most serious offence in a case. Excludes information from superior courts in Prince Edward Island, Quebec, Ontario, Manitoba and Saskatchewan as well as municipal courts in Quebec due to the unavailability of data. Jurisdictional differences in the structure and operation of courts may have an impact on survey results. Therefore, any comparisons between jurisdictions should be made with caution.
Source: Statistics Canada, Canadian Centre for Justice Statistics, Integrated Criminal Courts Survey (Adult component).
Chart 13
Median length of custodial sentence for impaired driving cases in adult criminal court, by province and territory, 2010/2011
Note: The median represents the midpoint, where exactly one-half the custody sentences are longer than the median and one-half are shorter. This excludes unknown and indeterminate sentence lengths. Nunavut is excluded as there were no custodial sentences for impaired driving cases in 2010/2011. Excludes information from Manitoba, superior courts in Prince Edward Island, Quebec, Ontario, and Saskatchewan as well as municipal courts in Quebec due to the unavailability of data. Jurisdictional differences in the structure and operation of courts may have an impact on survey results. Therefore, any comparisons between jurisdictions should be made with caution. Counts are based on the most serious offence in a case.
Source: Statistics Canada, Canadian Centre for Justice Statistics, Integrated Criminal Courts Survey (Adult component).
Among the provinces, British Columbia has the lowest proportion of impaired drivers sentenced to prison (4%), followed by Manitoba (5%) and Ontario (6%).
Those persons found guilty of impaired driving were more likely to receive a fine than any other form of sanction. In 2010/2011, fines were imposed in 9 in 10 guilty cases (89%) (Table 6). The median fine amount was $1,000, up from $700 in 2000/2001. This increase may have been the result of the 2008 Criminal Code amendment which raised the minimum fine for a first impaired driving offence from $600 to $1,000.
Admissions to sentenced custody in adult correctional services for impaired driving
More than four in ten admissions to sentenced custody for impaired driving are served intermittently
In fiscal year 2010/2011, about 3,800 admissions to sentenced custody for impaired driving were reported, representing 6% of all admissions.Note 18 Prince Edward Island reported the highest proportion by a large margin, with 53% of its overall admissions to sentenced custody being for impaired driving. By contrast, admissions for impaired driving accounted for about 3% of overall admissions to sentenced custody in the Northwest Territories and Ontario (Table 7).
Correctional Service Canada (CSC), which is responsible for inmates sentenced to two or more years of custody, reported 70 admissions for impaired driving in 2010/2011. This represented about 1% of all admissions to sentenced custody to CSC.
Admissions to provincial sentenced custody for impaired driving are more likely to be intermittent than admissions for other offences. An intermittent sentence allows a person sentenced to custody to serve their sentence in separate time periods, usually on weekends. About four in ten (41%) admissions to provincial sentenced custody for impaired driving in 2010/2011 were intermittent sentences, according to the five jurisdictions reporting that information, compared to 15% for all offences.Note 19
Previous studies show that the proportion of Aboriginal people among admissions to correctional services is usually higher than their proportion in the population (Calverley 2010; Perreault 2009). The pattern is similar for impaired driving. For the jurisdictions that provided detailed data on Aboriginal identity,Note 20 Aboriginal people accounted for 3% of the overall population in 2006. However, they accounted for 16% of admissions to correctional services for impaired driving in 2010/2011. Still, this proportion is lower than the proportion of Aboriginal people among overall admissions to provincial sentenced custody (18%) (Table 8).
Previous research also shows that single people tend to be over-represented among admissions to sentenced custody (Calverley 2010). While single people accounted for 28% of the overall population at the time of the 2011 Census, they accounted for 48% of admissions for impaired driving (Table 8).Note 21 These differences might be related to differences in lifestyle between singles and non-singles. Data from Statistics Canada's 2009 General Social Survey show that single people, compared with non-singles, go to bars more often and are more likely to have five or more drinks on the same occasion.
Summary
Police services across Canada reported 90,277 impaired driving incidents in 2011. The rate of impaired driving per 100,000 population increased for the fourth time in five years, up 2% in 2011. The impaired driving rate steadily decreased from the mid-1980's until 2006, when it reached its lowest point in over 25 years.
There are very different trends in impaired driving rates across the country over the last decade. Since 2001, the largest increases among the provinces have been seen in Newfoundland and Labrador (despite a drop in 2011) and British Columbia. While most of the other provinces have generally followed the national trend of increasing rates since 2006, the impaired driving rate has continued to decline in Quebec and Ontario.
In 2011, Saskatchewan and Prince Edward Island recorded the highest impaired driving rates among the provinces, while Ontario and Quebec had the lowest.
About 4 in 5 impaired driving cases resulted in a guilty outcome in 2010/2011. The most common sentence was the payment of a fine. About 1 in 10 received a prison sentence, with a median of 33 days. Of all admissions to provincial sentenced custody for impaired driving in the reporting jurisdictions, about four in ten were for sentences to be served intermittently.
Survey descriptions
Uniform Crime Reporting Survey
The Uniform Crime Reporting (UCR) Survey was established in 1962 with the co-operation and assistance of the Canadian Association of Chiefs of Police. The survey is a compilation of police-reported crimes that have been substantiated through investigation from all federal, provincial and municipal police services in Canada.
Coverage of the UCR aggregate data reflects virtually 100% of the total caseload for all police services in Canada. One incident can involve multiple offences. Counts from the UCR survey presented in this article are based upon the most serious offence in the incident in order to allow for enhanced comparability among police services. Counts based upon all violations are available upon request.
Incident-based Uniform Crime Reporting Survey
The incident-based Uniform Crime Reporting (UCR2) Survey is a microdata survey that captures detailed information on crimes reported to and substantiated by police, including the characteristics of victims, accused persons and incidents. Counts from the UCR2 survey presented in this article are based upon all incidents with at least one impaired driving offence in the incident. Coverage from the UCR2 Survey in 2011 is estimated at 99% of the population of Canada.
Integrated Criminal Courts Survey
The Integrated Criminal Court Survey (ICCS) collects statistical information on adult and youth court cases involving Criminal Code and other federal statute offences.Data contained in this article represent the adult criminal court portion of the survey, namely, individuals who were 18 years of age or older at the time of the offence.
In 2010/2011, coverage of the ICCS represented approximately 95% of the total adult caseload completed in Canadian criminal courts. As in previous years, information from superior courts in Prince Edward Island, Quebec, Ontario, Manitoba and Saskatchewan as well as municipal courts in Quebec (which accounted for about one-quarter of all Criminal Code charges in that province) was not available.
The absence of data from superior courts in these five jurisdictions may have resulted in a slight underestimation of the severity of sentences since some of the most serious cases, which are likely to result in the most severe sanctions, are processed in superior courts. There may also be a slight underestimation of case elapsed times as more serious cases generally require more court appearances and take more time to complete.
Integrated Correctional Services Survey
The Integrated Correctional Services Survey (ICSS), which is currently being implemented, collects microdata on adults and youth under the responsibility of the federal and provincial/territorial correctional systems. Data include socio-demographic characteristics of offenders (e.g., age) as well as information pertaining to legal hold status (e.g. sentenced custody, probation). Jurisdictions reporting adult data to the ICSS are: Newfoundland and Labrador, Nova Scotia, New Brunswick, Ontario, Saskatchewan and Correctional Service Canada.
Adult Correctional Services Survey
The Adult Correctional Services (ACS) Survey collects aggregate data on the number and case characteristics of admissions to and releases from adult custodial and non-custodial correctional services from the provincial, territorial and federal systems. With the exception of British Columbia and Nunavut, all provinces and territories reported 2010/2011 admissions data for adults. Furthermore, offence information on admissions to custody was not available for Alberta in 2010/2011.
Canadian Community Health Survey
The Canadian Community Health Survey (CCHS) is a cross-sectional survey that collects information related to health status, health care utilization and health determinants for the Canadian population. It relies upon a large sample of respondents and is designed to provide reliable estimates at the health region level. For CCHS data, this article uses the coefficient of variation (CV) as a measure of the sampling error. Any estimate that has a high CV (over 33.3%) has not been published because the estimate is too unreliable. In these cases, the symbol 'F' is used in place of an estimate in the charts and data tables. An estimate that has a CV between 16.6% and 33.3% should be used with caution and the symbol 'E' is referenced with the estimate.
Detailed data tables
Table 1 Police-reported impaired driving incidents, by sex of accused, Canada, 1986 to 2011
Table 2 Police-reported impaired driving incidents, by province and territory, 2011
Table 3 Police-reported impaired driving incidents, by census metropolitan area, 2011
Table 7 Admissions to adult correctional services, by jurisdiction, 2010/2011
References
Beirness, Douglas J. and Christopher G. Davis. 2007. "Driving after drinking in Canada: findings from the Canadian Addiction Survey." Canadian Journal of Public Health. Vol. 98, no. 6.
Calverley, Donna. 2010. "Adult correctional services in Canada, 2008/2009." Juristat. Vol. 30, no. 3. Statistics Canada Catalogue no. 85-002-X. (accessed May 7, 2012).
Department of Justice Canada. 2008. Tackling Violent Crime Act. (accessed May 7, 2012).
Perreault, Samuel. 2009. "The incarceration of Aboriginal people in adult correctional services." Juristat. Statistics Canada Catalogue no. 85-002-X. (accessed May 7, 2012).
Royal Canadian Mounted Police (RCMP). 2010. RCMP Pleased with First R.I.D.E. Program of the Holiday Season. (accessed May 7, 2012).
Standing Committee on Justice and Human Rights. 2009. "Ending alcohol-impaired driving: A common approach." Report of the Standing Committee on Justice and Human Rights. 40th Parliament, 2nd Session, House of Commons of Canada, Ottawa. (accessed May 7, 2012).
Traffic Injury Research Foundation. 2011. The Road Safety Monitor 2011: Drinking and Driving: National. (accessed May 7, 2012).
Traffic Injury Research Foundation. 2009. Alcohol-Crash Problem in Canada: 2006. (accessed May 7, 2012).
Transport Canada. 2011. A Quick Look at Alcohol-Related Crashes in Canada. (accessed May 7, 2012).
Notes
- In 2008, the most recent data available from Transport Canada show that at least 438 drivers killed in car crashes were determined to be legally-impaired. In addition, in that same year, 197 incidents of impaired driving causing death were reported by police services—these incidents exclude incidents where only the impaired driver was killed but include the related death of passengers, drivers of other vehicles and pedestrians. This means at least 635 persons were killed in a car crash involving an impaired driver in 2008, compared to a total of 611 homicide victims in that same year.
- Rates are calculated on the basis of 100,000 population of all ages.
- Includes 119 alcohol-impaired incidents and 2 drug-impaired incidents.
- Uniform Crime Reporting (UCR) Survey numbers are likely to be lower than numbers from other sources (see, for example Note 1), as an incident where only the impaired driver was killed would likely not be sent as an impaired driving causing death incident to the UCR Survey but rather as an impaired driving incident, cleared by death of the accused.
- Data was provided by the Sûreté du Québec, Waterloo Regional Police, York Regional Police, Calgary Police, Vancouver Police and Victoria Police.
- A census metropolitan area (CMA) consists of one or more neighbouring municipalities situated around a major urban core. A CMA must have a total population of at least 100,000 of which 50,000 or more live in the urban core. To be included in the CMA, other adjacent municipalities must have a high degree of integration with the central urban area, as measured by commuting flows derived from census data. A CMA typically comprises more than one police service.
- The rate change for Moncton was calculated from 2006, when it became a census metropolitan area.
- For the purpose of this report, winter covers the January 1st to March 20th and December 21st to December 31st periods, while summer covers the June 21st to September 20th period.
- This section focuses only on cases that proceed through adult criminal courts and therefore excludes information from the youth criminal courts.
- Based on the most serious offence in the case.
- A case is one or more charges against an accused person or company that were processed by the courts at the same time and received a final disposition. Counts are based on the most serious offence in a case.
- Trend analysis over the past decade is based upon information from ten provinces and territories that have consistently reported to the adult component of the Integrated Criminal Courts Survey since 2000/2001. Excludes data from Manitoba, Nunavut and the Northwest Territories.
- The median represents the mid-point of the distribution of the number of days taken to complete a case, from the first to last court appearance.
- Trend analysis over the past decade is based upon information from ten provinces and territories that have consistently reported to the adult component of the Integrated Criminal Courts Survey since 2000/2001. As such, the median presented here will differ from the median based on data from all jurisdictions. Excludes data from Manitoba, Nunavut and the Northwest Territories.
- Guilty cases include absolute and conditional discharges as well as guilty pleas.
- Data excludes time served in remand although it might have been taken into account in the sentence decision.
- Ibid.
- Includes both federal and provincial admissions to sentenced custody. Excludes data from British Columbia, Alberta and Nunavut. The remainder of this section focuses on admissions to provincial custody.
- Based upon data provided by Newfoundland and Labrador, Nova Scotia, New Brunswick, Ontario and Saskatchewan.
- Ibid.
- Ibid.
- Date modified: