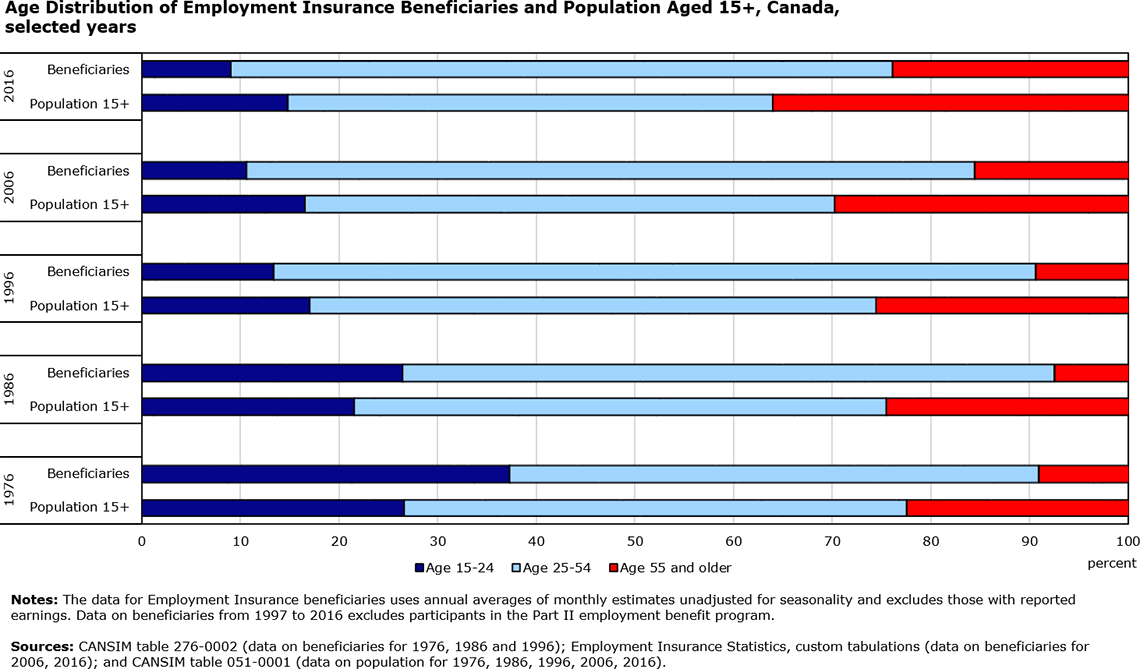
Data table for the graph
| Age 15-24 | Age 25-54 | Age 55 and older | |
|---|---|---|---|
| 1976 | |||
| Population 15+ | 26.6 | 50.9 | 22.4 |
| Beneficiaries | 37.4 | 53.6 | 9.1 |
| 1986 | |||
| Population 15+ | 21.6 | 53.9 | 24.5 |
| Beneficiaries | 26.5 | 66.0 | 7.5 |
| 1996 | |||
| Population 15+ | 17.1 | 57.4 | 25.5 |
| Beneficiaries | 13.5 | 77.2 | 9.4 |
| 2006 | |||
| Population 15+ | 16.6 | 53.7 | 29.7 |
| Beneficiaries | 10.7 | 73.7 | 15.6 |
| 2016 | |||
| Population 15+ | 14.9 | 49.2 | 35.9 |
| Beneficiaries | 9.1 | 67.1 | 23.8 |
|
Notes: The data for Employment Insurance beneficiaries uses annual averages of monthly estimates unadjusted for seasonality and excludes those with reported earnings. Data on beneficiaries from 1997 to 2016 excludes participants in the Part II employment benefit program. Sources: CANSIM table 276-0002 (data on beneficiaries for 1976, 1986 and 1996); Employment Insurance Statistics, custom tabulations (data on beneficiaries for 2006, 2016); and CANSIM table 051-0001 (data on population for 1976, 1986, 1996, 2006, 2016). |
|||