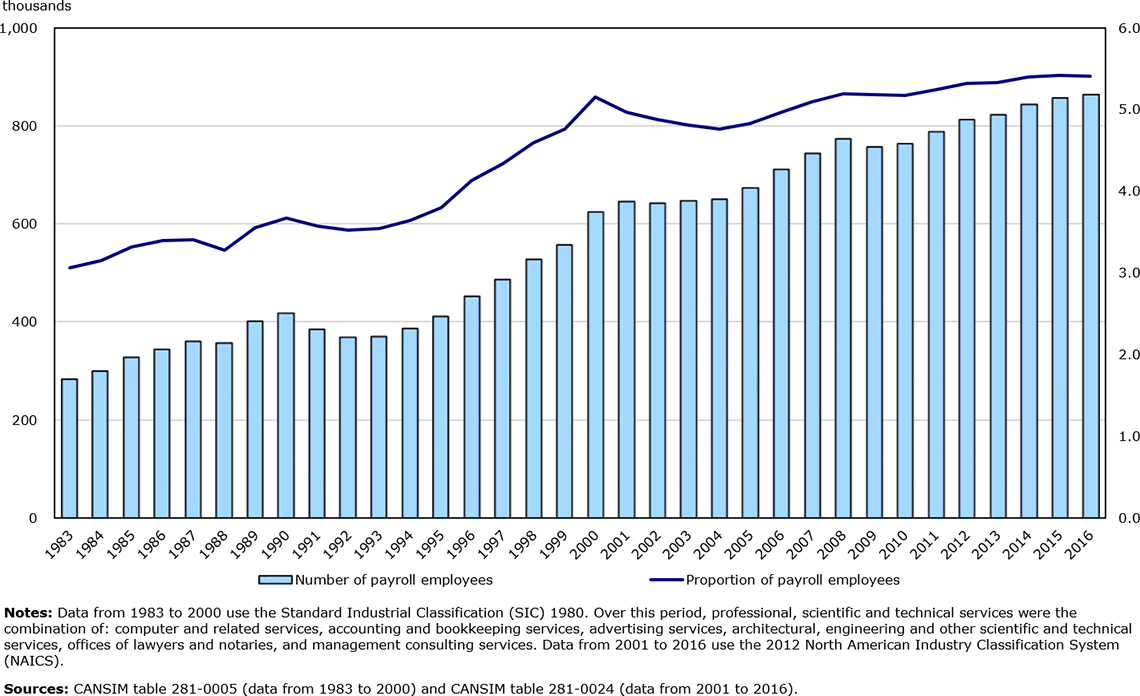
Data table for the graph
| Number of payroll employees | Proportion of payroll employees | |
|---|---|---|
| 1983 | 283.4 | 3.1 |
| 1984 | 299.3 | 3.2 |
| 1985 | 326.1 | 3.3 |
| 1986 | 343.9 | 3.4 |
| 1987 | 358.8 | 3.4 |
| 1988 | 356.6 | 3.3 |
| 1989 | 400.6 | 3.6 |
| 1990 | 416.8 | 3.7 |
| 1991 | 384.1 | 3.6 |
| 1992 | 367.7 | 3.5 |
| 1993 | 370.2 | 3.5 |
| 1994 | 385.4 | 3.6 |
| 1995 | 411.1 | 3.8 |
| 1996 | 450.7 | 4.1 |
| 1997 | 485.7 | 4.3 |
| 1998 | 527.2 | 4.6 |
| 1999 | 555.9 | 4.8 |
| 2000 | 623.7 | 5.2 |
| 2001 | 643.8 | 5.0 |
| 2002 | 641.3 | 4.9 |
| 2003 | 645.5 | 4.8 |
| 2004 | 648.6 | 4.8 |
| 2005 | 672.4 | 4.8 |
| 2006 | 709.9 | 5.0 |
| 2007 | 743.2 | 5.1 |
| 2008 | 771.9 | 5.2 |
| 2009 | 756.3 | 5.2 |
| 2010 | 762.2 | 5.2 |
| 2011 | 786.0 | 5.2 |
| 2012 | 810.7 | 5.3 |
| 2013 | 821.8 | 5.3 |
| 2014 | 841.8 | 5.4 |
| 2015 | 854.6 | 5.4 |
| 2016 | 862.6 | 5.4 |
Notes: Data from 1983 to 2000 use the Standard Industrial Classification (SIC) 1980. Over this period, professional, scientific and technical services were the combination of: computer and related services, accounting and bookkeeping services, advertising services, architectural, engineering and other scientific and technical services, offices of lawyers and notaries, and management consulting services. Data from 2001 to 2016 use the 2012 North American Industry Classification System (NAICS).
Sources: CANSIM table 281-0005 (data from 1983 to 2000) and CANSIM table 281-0024 (data from 2001 to 2016).