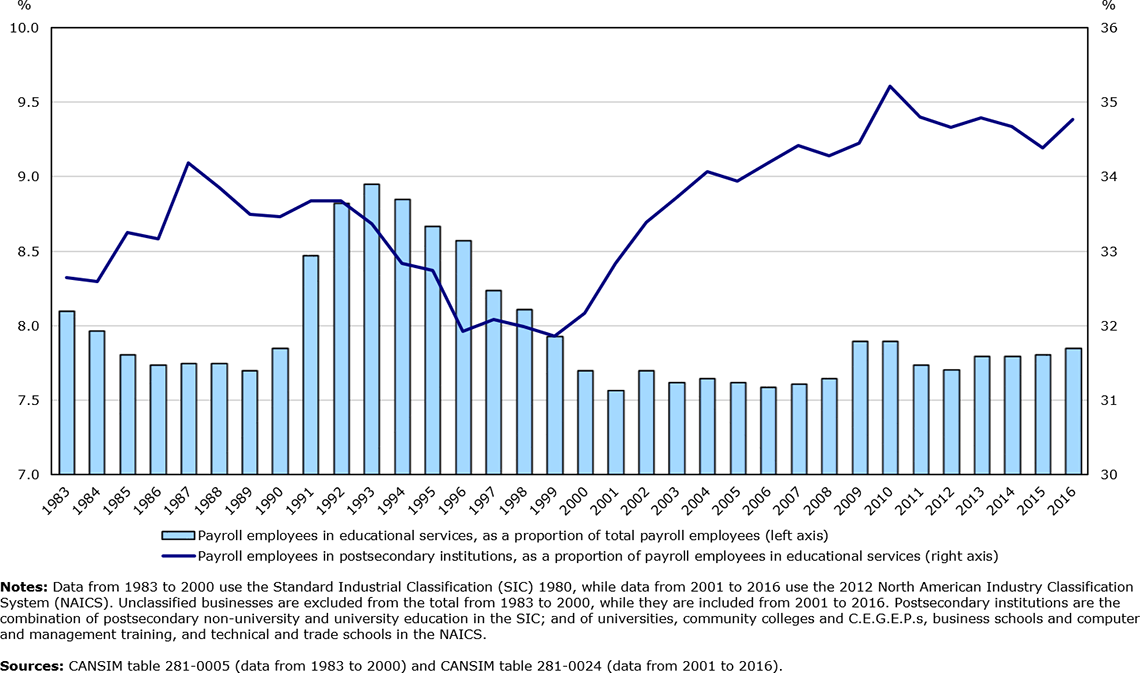
Data table for the graph
| Payroll employees in educational services, as a proportion of total payroll employees | Payroll employees in postsecondary institutions, as a proportion of payroll employees in educational services | |
|---|---|---|
| 1983 | 8.10 | 32.65 |
| 1984 | 7.97 | 32.59 |
| 1985 | 7.81 | 33.25 |
| 1986 | 7.74 | 33.17 |
| 1987 | 7.75 | 34.19 |
| 1988 | 7.75 | 33.86 |
| 1989 | 7.70 | 33.50 |
| 1990 | 7.85 | 33.46 |
| 1991 | 8.47 | 33.68 |
| 1992 | 8.82 | 33.68 |
| 1993 | 8.95 | 33.37 |
| 1994 | 8.85 | 32.84 |
| 1995 | 8.67 | 32.74 |
| 1996 | 8.57 | 31.92 |
| 1997 | 8.24 | 32.08 |
| 1998 | 8.11 | 31.99 |
| 1999 | 7.93 | 31.86 |
| 2000 | 7.70 | 32.17 |
| 2001 | 7.57 | 32.84 |
| 2002 | 7.70 | 33.39 |
| 2003 | 7.62 | 33.72 |
| 2004 | 7.65 | 34.07 |
| 2005 | 7.62 | 33.94 |
| 2006 | 7.59 | 34.19 |
| 2007 | 7.61 | 34.42 |
| 2008 | 7.65 | 34.28 |
| 2009 | 7.90 | 34.45 |
| 2010 | 7.90 | 35.21 |
| 2011 | 7.74 | 34.80 |
| 2012 | 7.71 | 34.66 |
| 2013 | 7.80 | 34.79 |
| 2014 | 7.80 | 34.67 |
| 2015 | 7.81 | 34.39 |
| 2016 | 7.85 | 34.77 |
|
Notes: Data from 1983 to 2000 use the Standard Industrial Classification (SIC) 1980, while data from 2001 to 2016 use the 2012 North American Industry Classification System (NAICS). Unclassified businesses are excluded from the total from 1983 to 2000, while they are included from 2001 to 2016. Postsecondary institutions are the combination of postsecondary non-university and university education in the SIC; and of universities, community colleges and C.E.G.E.P.s, business schools and computer and management training, and technical and trade schools in the NAICS. Sources: CANSIM table 281-0005 (data from 1983 to 2000) and CANSIM table 281-0024 (data from 2001 to 2016). |
||