Employment services: CVs for operating revenue - 2020
Table summary
This table displays the results of Employment services: CVs for operating revenue - 2020. The information is grouped by Geography (appearing as row headers), and percentage (appearing as column headers).
Retail Commodity Survey: CVs for Total Sales July 2021
Table summary
This table displays the results of Retail Commodity Survey: CVs for Total Sales (July 2021). The information is grouped by NAPCS-CANADA (appearing as row headers), and Month (appearing as column headers).
NAPCS-CANADA
Month
202104
202105
202106
202107
Total commodities, retail trade commissions and miscellaneous services
0.63
0.76
0.63
0.66
Retail Services (except commissions) [561]
0.63
0.75
0.62
0.65
Food at retail [56111]
0.65
0.64
0.58
0.60
Soft drinks and alcoholic beverages, at retail [56112]
0.56
0.63
0.65
0.64
Cannabis products, at retail [56113]
0.00
0.00
0.00
0.00
Clothing at retail [56121]
1.75
1.77
1.41
1.04
Footwear at retail [56122]
1.81
2.22
1.83
1.61
Jewellery and watches, luggage and briefcases, at retail [56123]
6.63
8.17
6.36
5.28
Home furniture, furnishings, housewares, appliances and electronics, at retail [56131]
0.81
0.62
0.70
0.59
Sporting and leisure products (except publications, audio and video recordings, and game software), at retail [56141]
3.06
3.51
2.79
2.07
Publications at retail [56142]
7.33
6.41
8.68
7.60
Audio and video recordings, and game software, at retail [56143]
4.17
4.57
3.21
2.47
Motor vehicles at retail [56151]
1.96
2.68
2.24
2.55
Recreational vehicles at retail [56152]
4.42
5.75
2.54
2.58
Motor vehicle parts, accessories and supplies, at retail [56153]
1.92
2.03
1.78
1.85
Automotive and household fuels, at retail [56161]
2.45
1.84
1.59
1.61
Home health products at retail [56171]
2.33
2.73
2.68
2.63
Infant care, personal and beauty products, at retail [56172]
2.18
1.98
2.03
2.09
Hardware, tools, renovation and lawn and garden products, at retail [56181]
1.87
1.94
2.02
1.68
Miscellaneous products at retail [56191]
2.94
3.18
3.21
3.17
Total retail trade commissions and miscellaneous services Footnote 1
1.74
2.08
2.04
1.58
Footnotes
Footnote 1
1. Comprises the following North American Product Classification System (NAPCS): 51411, 51412, 53112, 56211, 57111, 58111, 58121, 58122, 58131, 58141, 72332, 833111, 841, 85131 and 851511.
Retail Commodity Survey: CVs for total sales (second quarter 2021)
Table summary
This table displays the results of Retail Commodity Survey: CVs for total sales (second quarter 2021). The information is grouped by NAPCS-CANADA (appearing as row headers), and Quarter (appearing as column headers).
NAPCS-CANADA
Quarter
2020Q2
2020Q3
2020Q4
2021Q1
2021Q2
Total commodities, retail trade commissions and miscellaneous services
0.53
0.61
0.54
0.67
0.54
Retail Services (except commissions) [561]
0.53
0.60
0.53
0.66
0.54
Food at retail [56111]
0.69
0.66
0.71
1.16
0.63
Soft drinks and alcoholic beverages, at retail [56112]
0.48
0.52
0.58
0.61
0.60
Cannabis products, at retail [56113]
0.00
0.00
0.00
0.00
0.00
Clothing at retail [56121]
1.35
0.80
1.00
0.98
1.36
Footwear at retail [56122]
2.87
1.93
1.76
1.98
1.95
Jewellery and watches, luggage and briefcases, at retail [56123]
18.57
9.67
2.02
2.53
6.65
Home furniture, furnishings, housewares, appliances and electronics, at retail [56131]
0.57
0.55
0.56
0.58
0.63
Sporting and leisure products (except publications, audio and video recordings, and game software), at retail [56141]
1.98
3.23
2.19
1.70
2.45
Publications at retail [56142]
9.43
7.47
6.14
6.31
8.46
Audio and video recordings, and game software, at retail [56143]
3.27
5.69
5.95
4.61
3.81
Motor vehicles at retail [56151]
2.03
2.18
1.91
2.45
1.76
Recreational vehicles at retail [56152]
4.20
2.68
5.37
3.94
2.25
Motor vehicle parts, accessories and supplies, at retail [56153]
1.40
1.57
1.31
1.95
1.54
Automotive and household fuels, at retail [56161]
2.94
2.23
2.04
2.48
1.70
Home health products at retail [56171]
2.70
2.62
3.36
3.05
2.70
Infant care, personal and beauty products, at retail [56172]
2.82
2.12
2.76
2.97
1.93
Hardware, tools, renovation and lawn and garden products, at retail [56181]
1.84
1.46
1.14
1.52
1.83
Miscellaneous products at retail [56191]
2.69
2.34
2.36
1.99
3.23
Total retail trade commissions and miscellaneous services Footnotes 1
1.54
1.71
1.65
1.58
1.57
Footnotes
Footnote 1
Comprises the following North American Product Classification System (NAPCS): 51411, 51412, 53112, 56211, 57111, 58111, 58121, 58122, 58131, 58141, 72332, 833111, 841, 85131 and 851511.
In 2020–21, Statistics Canada made significant investments in modernizing its operations and developing the resourcefulness of its employees, enabling the agency to rapidly adapt to sudden changes in priorities during the COVID-19 pandemic. The demand for relevant and trustworthy data was never more urgent and essential to fulfill, both in helping Canadians respond to the crisis and in charting a path towards an inclusive and sustainable recovery.
Results of Statistics Canada’s pan-Canadian partnerships for pandemic response
Measured the supply and demand of personal protective equipment to help public health officials better manage the nation’s inventory.
Mobilized Statistics Canada’s expert interviewers to make the equivalent of 1.2 million 15-minute calls to support COVID-19 contact tracing operations across the country.
Developed the first-ever nationally representative survey to measure the levels of immunity among Canadians against the virus that causes COVID-19.
Assessed the extent of COVID-19 infection rates across Canada and established models to identify COVID-19 geographical hotspots, which have helped public health officials with pandemic response and vaccine rollout.
Provided Canadian researchers with secure digital access to timely, high-quality microdata, which have improved public understanding of the economic impact of public health measures during the pandemic.
Providing user-centric services
Statistics Canada provides timely, high-quality data to Canadians. During the COVID-19 pandemic, which dominated its agenda in 2020–21, the agency developed the following new methods and technology-based solutions:
In April 2020, Statistics Canada pivoted to provide Canadians with crucial data about the impacts of the pandemic on employment, health, safety, business closures, consumption trends, immigration levels, interest rates and housing prices and provided evidence of the unequal impacts of the pandemic on diverse populations.
As the pandemic disrupted Canadians’ way of life, municipalities requested more granular data to support local decision making. Building on the results of a pilot project with the City of Vancouver, Statistics Canada has established a partnership with the Federation of Canadian Municipalities to produce more data broken down to the community level.
Developing leading-edge methods of data collection and integration
In 2020–21, Statistics Canada continued to invest in leading-edge methods of data collection, which included integrating more alternative data sources that went beyond the agency’s traditional survey-first approach. The methods below have reduced the time and effort required of Canadians to fill out surveys and have created opportunities to incorporate richer datasets into the agency’s products:
Canadians had access to timely and relevant survey findings provided using innovative data collection methods such as crowdsourcing, which enabled Statistics Canada to publish its first-ever study of how Canadians experienced discrimination during the pandemic.
Statistics Canada’s investments in data science and machine learning resulted in the development of artificial intelligence tools to help the Public Health Agency of Canada’s response to COVID-19. These tools enabled the development of data models aimed at helping to reduce transmission of the virus that causes COVID-19 and to evaluate the impact of public health measures to determine the extent to which these measures should be eased to allow businesses and schools to reopen and social gatherings to resume.
Building statistical capacity and leadership
Statistics Canada is a leader in fostering data literacy and numeracy. In the middle of a pandemic, the agency continued to lead a whole-of-government approach by using data as a strategic asset to better serve Canadians, which included improving the data analysis skills of Government of Canada employees.
The Data Science Network for the Federal Public Service was launched in 2020 with the goal of establishing a strategy to enable data science expertise to be shared across all orders of government and beyond.
As part of the Government of Canada’s efforts to address gender gaps and systemic racism, Statistics Canada’s Centre for Gender, Diversity and Inclusion Statistics gave more than 20 presentations on a diverse range of topics aimed at bringing fairness and inclusion to decisions that affect all the people in Canada.
Sharing and collaborating
Collaboration enabled Canadians to share data and use them to make evidence-based decisions about effective pandemic response.
In partnership with Health Canada, the Public Health Agency of Canada and other organizations, Statistics Canada developed a dashboard to track the supply and demand of personal protective equipment, forecast ventilator capacity, and automate the national COVID-19 vaccine supply tracker.
The agency’s interviewers, who are specially trained to conduct high-volume survey-based interviews, were mobilized to provide surge capacity in contact tracing for the provinces and territories. By March 31, 2021, they had made the equivalent of 1.2 million 15-minute calls for contact tracing, conducting everything from daily health check-ins with Canadians to in-depth case investigations, while still juggling their ongoing survey collection duties.
Together with the Canadian Chamber of Commerce, the country’s largest business group, Statistics Canada launched the Canadian Survey on Business Conditions within weeks of the pandemic’s first wave. The goal of this survey was to track the impact of the nationwide economic shutdown on the nation’s firms. The results of this survey were vital in providing the Government of Canada with the information it needed to design and implement emergency income-support programs that met the urgent needs of the moment.
Designing a modern and flexible workplace
When the COVID-19 pandemic hit Canada, Statistics Canada’s employees quickly adapted to deliver timely and accurate data and insights in a rapidly changing environment.
Statistics Canada led the Government of Canada in adopting cloud-based computing solutions during the pandemic to address the urgent need for advanced technology solutions in a digital and data-driven world.
For more information on Statistics Canada’s plans, priorities and results achieved, see the “Results: what we achieved” section of this report.
Environment and Energy Statistics Division
Energy Section
This guide is designed to assist you as you complete the
Monthly Electricity Supply and Disposition Survey 2022.
Help Line: 1-877-604-7828 (TTY: 1-866-753-7083)
Confidentiality
Statistics Canada is prohibited by law from releasing any information it collects which could identify any person, business, or organization, unless consent has been given by the respondent or as permitted by the Statistics Act. Statistics Canada will use the information from this survey for statistical purposes.
Please report information for the month indicated on the front of the questionnaire, and return it within 10 days of receipt.
Please complete all sections as applicable.
If the information requested is unknown, please provide your best estimate.
This guide is designed to assist you as you complete the Monthly Electricity Supply and Disposition Survey. If you need more information, please call 1-877-604-7828.
B – Electricity Generation Method
Combustible fuels: see section C
Nuclear: Electricity generated at an electric power plant whose turbines are driven by steam generated in a reactor by heat from the fission of nuclear fuel.
Hydro: Electric power generated from a plant in which the turbine generators are driven by flowing water.
Tidal: Electric power generated from a plant in which turbine generators are driven from tidal movements.
Wind: A power plant in which the prime mover is a wind turbine. Electric power is generated by the conversion of wind power into mechanical energy.
Solar: Electricity created using Photovoltaic (PV) technology which converts sunlight into electricity or electricity created using solar thermal technology where sunlight heats a liquid or gas to drive a turbine or engine.
Wave: Electricity generated from mechanical energy derived from wave motion.
Geothermal: Electricity generated from heat emitted from within the earth's crust, usually in the form of hot water or steam.
Other non-combustible sources: This includes fuels such as waste heat, steam, and steam purchased from another company. Specify in the space provided.
C – Combustible fuels
Coal: A readily combustible, black or brownish-black rock-like substance, whose composition, including inherent moisture, consists of more than 50% by weight and 70% by volume of carbonaceous material. It is formed from plant remains that have been compacted, hardened, chemically altered and metamorphosed by heat and pressure over geologic time without access to air.
Natural gas: A mixture of hydrocarbons (principally methane) and small quantities of various hydrocarbons existing in the gaseous phase or in solution with crude oil in underground reservoirs.
Petroleum: This covers both naturally occurring unprocessed crude oil and petroleum products that are made up of refined crude oil and used as a fuel source (i.e., crude oil, synthetic crude oil, natural gas liquids, naphtha, kerosene, jet fuel, gasoline, diesel, and fuel oil; excludes Petroleum coke, bitumen and other oil products not specified).
Other non-renewable combustible fuels: This includes fuels such as propane, orimulsion, petroleum coke, coke oven gas, ethanol and any other type of non-renewable combustible fuels not otherwise identified on the questionnaire. Specify in the space provided.
Wood and wood waste: Wood and wood energy used as fuel, including round wood (cord wood), lignin, wood scraps from furniture and window frame manufacturing, wood chips, bark, sawdust, shavings, lumber rejects, forest residues, charcoal and pulp waste from the operation of pulp mills, sawmills and plywood mills.
Spent pulping liquor (Black liquor): A recycled by-product formed during the pulping of wood in the paper-making process. It is primarily made up of lignin and other wood constituents, and chemicals that are by-products of the manufacture of chemical pulp. It is burned as fuel or in a recovery boiler which produces steam which can be used to produce electricity.
Methane (Landfill gas): A biogas composed principally of methane and carbon dioxide produced by anaerobic digestion of landfill waste.
Municipal and other waste: Wastes (liquids or solids) produced by households, industry, hospitals and others (examples: paper, cardboard, rubber, leather, natural textiles, wood, brush, grass clippings, kitchen waste and sewage sludge).
Other type of Biomass: Any other type of biomass not otherwise identified on the questionnaire. This includes fuels such as food waste/food processing residues, used diapers, and biogases – example, gas produced from anaerobic digesters. Specify in the space provided.
D – Receipts of electricity from the U.S.A.
If applicable, please report the total quantity of electricity (MWh) and Canadian dollar value (thousands of dollars) this business imported/purchased from the United States.
E – Receipts of electricity from within Canada
If applicable, please report the total quantities of electricity (MWh) and total dollar value (thousands of dollars) purchased or received from within and/or other provinces (e.g., other utilities/producers, transmitters, distributors).
F – Total Supply
This is the sum of Total Generation, Total Receipts from United States, Total Receipts from other Provinces and Total Receipts from Within Province. The Total Supply number must equal the Total Disposition number.
G – Deliveries of electricity to the U.S.A.
If applicable, please report the total quantity of electricity (MWh) and Canadian dollar value (thousands of dollars) this business exported/sold to the United States.
H – Deliveries of electricity within Canada
If applicable, please report the total quantity of electricity (MWh) and total dollar value (thousands of dollars) your company sold to other domestic companies, by province or territory.
I – Unallocated and/or losses
Include
transmission losses
adjustments
"unaccounted for" amounts which are subject to variation because of cyclical billing
losses in the main generator transformers and the electrical energy absorbed by the generating auxiliaries
Thank you for your participation.
Business or organization information
1. Which of the following categories best describes this business or organization?
Government agency
Private sector business
Non-profit organization
Who does this organization primarily serve?
Households or individuals
e.g., child and youth services, community food services, food bank, women's shelter, community housing services, emergency relief services, religious organization, grant and giving services, social advocacy group, arts and recreation group
Businesses
e.g., business association, chamber of commerce, condominium association, environment support or protection services, group benefit carriers (pensions, health, medical)
Don't know
2. In what year was this business or organization first established?
Year business or organization was first established:
OR
Don't know
3. In the last 12 months, did this business or organization conduct any of the following international activities?
Select all that apply.
Export goods outside of Canada
Include both intermediate and final goods.
Export services outside of Canada
Include services delivered virtually and in person.
e.g., cloud services, legal services, environmental services, architectural services, digital advertising
Make investments outside of Canada
Sell goods to businesses or organizations in Canada who then resold them outside of Canada
Import goods from outside of Canada
Include both intermediate and final goods.
Import services from outside of Canada
Include services received virtually and in person.
e.g., cloud services, legal services, environmental services, architectural services, digital advertising
Relocate any business or organizational activities or employees from another country into Canada
Exclude temporary foreign workers.
Engage in other international business or organizational activities
OR
None of the above
4. Over the next three months, how are each of the following expected to change for this business or organization?
Exclude seasonal factors or conditions.
Number of employees
Increase
Stay about the same
Decrease
Not applicable
Don't know
Vacant positions
Increase
Stay about the same
Decrease
Not applicable
Don't know
Sales of goods and services offered by this business or organization
Increase
Stay about the same
Decrease
Not applicable
Don't know
Selling price of goods and services offered by this business or organization
Increase
Stay about the same
Decrease
Not applicable
Don't know
Demand for goods and services offered by this business or organization
Increase
Stay about the same
Decrease
Not applicable
Don't know
Imports
Increase
Stay about the same
Decrease
Not applicable
Don't know
Exports
Increase
Stay about the same
Decrease
Not applicable
Don't know
Operating income
Increase
Stay about the same
Decrease
Not applicable
Don't know
Operating expenses
Increase
Stay about the same
Decrease
Not applicable
Don't know
Profitability
Increase
Stay about the same
Decrease
Not applicable
Don't know
Cash reserves
Increase
Stay about the same
Decrease
Not applicable
Don't know
Capital expenditures
e.g., machinery, equipment
Increase
Stay about the same
Decrease
Not applicable
Don't know
Training expenditures
Increase
Stay about the same
Decrease
Not applicable
Don't know
Marketing and advertising budget
Increase
Stay about the same
Decrease
Not applicable
Don't know
Business or organization obstacles
5. Over the next three months, which of the following are expected to be obstacles for this business or organization?
Select all that apply.
Shortage of labour force
Recruiting skilled employees
Retaining skilled employees
Shortage of space or equipment
Rising cost of inputs
An input is an economic resource used in a firm's production process.
e.g., labour, capital, energy and raw materials
Cost of personal protective equipment (PPE), additional cleaning or implementing distancing requirements
Difficulty acquiring inputs, products or supplies from within Canada
Difficulty acquiring inputs, products or supplies from abroad
Maintaining inventory levels
Insufficient demand for goods or services offered
Fluctuations in consumer demand
Attracting new or returning customers
Cost of insurance
Transportation costs
Obtaining financing
Government regulations
Travel restrictions and travel bans
Increasing competition
Challenges related to exporting goods and services
Maintaining sufficient cash flow or managing debt
Speed of internet connection
Other
Specify other:
OR
None of the above
Flow condition: If “Difficulty acquiring inputs, products or supplies from within Canada”, “Difficulty acquiring inputs, products or supplies from abroad”, or “Maintaining inventory levels” is selected in Q5, go to Q6. Otherwise, go to Q7.
6. How long does this business or organization expect the following to continue to be an obstacle?
Difficulty acquiring inputs, products or supplies from within Canada
Less than 3 month
3 months to less than 6 months
6 months to less than 12 months
12 months or more
Don't know
Difficulty acquiring inputs, products or supplies from abroad
Less than 3 month
3 months to less than 6 months
6 months to less than 12 months
12 months or more
Don't know
Maintaining inventory levels
Less than 3 month
3 months to less than 6 months
6 months to less than 12 months
12 months or more
Don't know
Flow condition: If the business or organization is a private sector business or non-profit organization, go to Q7. Otherwise, go to Q8.
Expectations for the next year
7. In the next 12 months, are there any plans to expand or restructure this business or organization, or acquire or invest in other businesses or organizations?
Restructuring involves changing the financial, operational, legal or other structures of a business or organization to make it more efficient or more profitable.
Yes
Does this business plan to:
Select all that apply.
Expand current location of this business
Expand this business or organization to other locations
Expand this business or organization without increasing physical space
i.e., hiring more staff who will work remotely
Restructure this business or organizations
Acquire other businesses, organizations or franchises
Invest in other businesses or organizations
Merge with other businesses or organizations
No
Don't know
Flow condition: If the business or organization is a private sector business, go to Q8. Otherwise, go to Q9.
8. In the next 12 months, are there any plans to transfer, sell or close this business?
Yes
Does this business plan to:
Transfer to family members without money changing hands
Sell to family members
Sell to employees
Sell to external parties
Close the business
Don't know
No
Don't know
Trade agreements
9. Is this business or organization aware of the existence of any of the following trade agreements?
Canada-United States-Mexico Agreement (CUSMA)
Previously the North American Free Trade Agreement (NAFTA).
Not aware of existence of agreement
Aware of existence but not familiar with details of agreement
Familiar with details of agreement
Canadian-European Union Comprehensive Economic and Trade Agreement (CETA)
Not aware of existence of agreement
Aware of existence but not familiar with details of agreement
Familiar with details of agreement
Comprehensive and Progressive Agreement for Trans-Pacific Partnership (CPTPP)
Not aware of existence of agreement
Aware of existence but not familiar with details of agreement
Familiar with details of agreement
Flow condition: If “Export or sell goods outside of Canada”, “Export or sell services outside of Canada”, “Import or buy goods outside of Canada” or “Import or buy services outside of Canada” is selected in Q3, go to Q10. Otherwise, go to Q11.
10. Which of the following trade agreements does this business or organization currently carry out trade under?
Canada-United States-Mexico Agreement (CUSMA)
Previously the North American Free Trade Agreement (NAFTA).
Currently carry out trade under this agreement
Does not currently carry out trade under this agreement
Don’t know
Canadian-European Union Comprehensive Economic and Trade Agreement (CETA)
Currently carry out trade under this agreement
Does not currently carry out trade under this agreement
Don’t know
Comprehensive and Progressive Agreement for Trans-Pacific Partnership (CPTPP)
Currently carry out trade under this agreement
Does not currently carry out trade under this agreement
Don’t know
Flow condition: If “Does not currently carry out trade under this agreement” for “Canada-United States-Mexico Agreement (CUSMA)” is selected in Q10, go to Q11. Otherwise, go to Q12.
11. What is the primary reason this business or organization does not carry out trade under the Canada-United States-Mexico Agreement (CUSMA)?
This business or organization does not trade with the United States or Mexico
Do not understand the process
Documents are too complicated
Benefits of using are too small
Products do not qualify for Rules of Origin (ROO)
Too difficult to prove that products qualify for Rules of Origin (ROO)
Importer chooses not to claim
Other
Specify other:
Flow condition: If “Does not currently carry out trade under this agreement” for “Canadian-European Union Comprehensive Economic and Trade Agreement (CETA)” is selected in Q10, go to Q12. Otherwise, go to Q13.
12. What is the primary reason this business or organization does not carry out trade under the Canadian-European Union Comprehensive Economic and Trade Agreement (CETA)?
This business or organization does not trade with the European Union
The European Union includes Austria, Belgium, Bulgaria, Croatia, Cyprus, Czechia, Denmark, Estonia, Finland, France, Germany, Greece, Hungary, Ireland, Italy, Latvia, Lithuania, Luxembourg, Malta, Netherlands, Poland, Portugal, Romania, Slovakia, Slovenia, Spain, and Sweden.
Do not understand the process
Documents are too complicated
Benefits of using are too small
Products do not qualify for Rules of Origin (ROO)
Too difficult to prove that products qualify for Rules of Origin (ROO)
Importer chooses not to claim
Other
Specify other:
Flow condition: If “Does not currently carry out trade under this agreement” for “Comprehensive and Progressive Agreement for Trans-Pacific Partnership (CPTPP)” is selected in Q10, go to Q13. Otherwise, go to Q14.
13. What is the primary reason this business or organization does not carry out trade under the Comprehensive and Progressive Agreement for Trans-Pacific Partnership (CPTPP)?
This business or organization does not trade with the Trans-Pacific countries
Trans-Pacific countries includes Australia, Brunei, Chile, Japan, Malaysia, Mexico, New Zealand, Peru, Singapore, and Vietnam.
Do not understand the process
Documents are too complicated
Benefits of using are too small
Products do not qualify for Rules of Origin (ROO)
Too difficult to prove that products qualify for Rules of Origin (ROO)
Importer chooses not to claim
Other
Specify other:
Flow condition: If “Import or buy goods outside of Canada” or “Import or buy services outside of Canada” is selected in Q3, go to Q14. Otherwise, go to Q19.
Digital ordering
Extranet:
A closed network that uses internet protocols to securely share enterprise's information with suppliers, vendors, customers or other businesses partners. It can take the form of a secure extension of an Intranet that allows external users to access some parts of the enterprise's Intranet. It can also be a private part of the enterprise's website, where business partners can navigate after being authenticated in a login page.
Electronic Data Interchange (EDI):
The electronic transmission of data suitable for automated processing between businesses or organisations. Generally, EDI allows for the sending or receiving of messages (e.g., payment transactions, tax declarations, orders) in an agreed or standard format suitable for automated processing, and does not require an individual to type a message manually.
14. It was reported in a previous question that in the last 12 months, this business or organization imported goods or services from outside of Canada. What percentage of these import purchases were digitally ordered?
Include all purchases of goods and services by this business or organization where the order was placed, and the commitment to purchase was received over the Internet, including through web pages, applications, platforms, extranet or Electronic Data Interchange (EDI).
Exclude orders placed by telephone, facsimile and email.
100%
50% to less than 100%
1% to less than 50%
None
Flow condition: If “Import or buy goods outside of Canada” is selected in Q3 and “100%”, “50% to less than 100%” or “1% to less than 50%” is selected in Q14, go to Q15. Otherwise, go to the next flow.
Digital ordering of goods and services
15. In the last 12 months, which digital methods were used by this business or organization to order goods from suppliers in other countries?
Select all that apply.
Electronic data interchange (EDI)
The electronic transmission of data suitable for automated processing between businesses or organizations. Generally, EDI allows for the sending or receiving of messages (e.g., payment transactions, tax declarations, orders) in an agreed or standard format suitable for automated processing, and does not require an individual to type a message manually.
E-commerce, through the supplier’s website, application or platform
E-commerce, through a third-party website, application or platform
Extranet
A closed network that uses internet protocols to securely share enterprise's information with suppliers, vendors, customers or other businesses partners. It can take the form of a secure extension of an Intranet that allows external users to access some parts of the enterprise's Intranet. It can also be a private part of the enterprise's website, where business partners can navigate after being authenticated in a login page.
Email
OR
Goods were not digitally ordered from suppliers in other countries by this business or organization
Flow condition: If “Import or buy services outside of Canada” is selected in Q3 and “100%”, “50% to less than 100%” or “1% to less than 50%” is selected in Q14, go to Q16. Otherwise, go to Q19.
16. In the last 12 months, which digital methods were used by this business or organization to order services from suppliers in other countries?
Select all that apply.
Electronic data interchange (EDI)
The electronic transmission of data suitable for automated processing between businesses or organizations. Generally, EDI allows for the sending or receiving of messages (e.g., payment transactions, tax declarations, orders) in an agreed or standard format suitable for automated processing, and does not require an individual to type a message manually.
E-commerce, through the supplier’s website, application or platform
E-commerce, through a third-party website, application or platform
Extranet
A closed network that uses internet protocols to securely share enterprise's information with suppliers, vendors, customers or other businesses partners. It can take the form of a secure extension of an Intranet that allows external users to access some parts of the enterprise's Intranet. It can also be a private part of the enterprise's website, where business partners can navigate after being authenticated in a login page.
Email
OR
Services were not digitally ordered from suppliers in other countries by this business or organization
Flow condition: If any digital method to order services was selected in Q16, go to Q17. Otherwise, go to Q19.
Digital ordering of services
17. In the last 12 months, for services digitally ordered from suppliers in other countries, what percentage of these import purchases of services were digitally delivered to this business or organization?
Include services delivered digitally.
e.g., service provider and client remain in their respective countries with services delivered to Canada via electronic data interchange (EDI), video conferencing with clients, file sharing, websites, applications or platforms, or extranet
Exclude services delivered in person through a subsidiary or sub-contractor in Canada, or travel of service provider or supplier to have service delivered in-person.
e.g., services related to the installation of goods, on-site environmental assessments
None
1% to less than 50%
50% to less than 100%
100%
Flow condition: If “1% to less than 50%”, “50% to less than 100%” or “100%” is selected in Q17, go to Q18. Otherwise, go to Q19.
18. In the last 12 months, how have purchases of digitally delivered services made by this business or organization from suppliers in other countries changed?
e.g., Service provider and client remain in their respective countries with services delivered to Canada via electronic data interchange (EDI), video conferencing with clients, file sharing, websites, applications or platforms, or extranet
Increased
Remained stable
Decreased
Don’t know
Ransomware
19. In the last 12 months, was this business or organization impacted by ransomware incidents?
Ransomware is a type of malware that restricts access to your computer or your files and displays a message that demands payment in order for the restriction to be removed.
Yes
Did this business or organization pay the ransom?
Yes
No
Don't know
No
Don't know
Flow condition: If “Yes, this business or organization was impacted by ransomware incidents” is selected in Q19, go to Q20. Otherwise, go to Q21.
20. In the last 12 months, has this business or organization reported a ransomware attack to an insurance company?
Ransomware is a type of malware that restricts access to your computer or your files and displays a message that demands payment in order for the restriction to be removed.
Yes
No
Don't know
Recruitment, retention and training
21. Over the next 12 months, does this business or organization plan to do any of the following?
Select all that apply.
Increase wages offered to new employees
Increase wages offered to existing employees
Increase benefits offered to new employees
Increase benefits offered to existing employees
Offer signing bonuses or incentives to new employees
Apply for learning and development programs provided by governments in order to upskill or reskill current employees
Work with education and training institutions to offer work-integrated learning programs such as co-ops, internships, and apprenticeships
Provide tuition support to employees to take courses or programs
Provide employees with paid time to engage in learning and development programs
Encourage employees to participate in on-the-job training
Encourage employees to acquire micro-credentials which help individuals develop job-related competencies
Micro-credentials are short, concentrated groups of courses that are based on industry needs. They are generally offered in shorter or more flexible timespans and tend to be more narrowly focused in comparison with traditional degrees and certificates. Some micro-credentials may be stackable and can be combined to form a part of a larger credential.
OR
None of the above
Funding or credit
22. Over the next 12 months, how would the absence of government support programs impact the survival of this business or organization?
Examples of government support programs include the Canada Emergency Business Account (CEBA), the Canada Emergency Wage Subsidy (CEWS), and the Canada Emergency Rent Subsidy (CERS).
No impact
Low impact
Medium impact
High impact
Don’t know
23. Over the next 12 months, to what extent does this business or organization foresee challenges in repaying funding received from repayable government support programs put in place because of the COVID-19 pandemic?
Examples of repayable government support programs include the Canada Emergency Business Account (CEBA) or the Indigenous Business Initiative (sometimes referred to as the Emergency Loan Program (ELP), issued through an Aboriginal Financial Institutions (AFI) or Métis Capital Corporations (MCCs)).
Not a challenge
A minor challenge
A major challenge
Don’t know
This business or organization did not receive any repayable funding from government support programs related to the COVID-19 pandemic
Liquidity and debt
24. Does this business or organization have the cash or liquid assets required to operate for the next three months?
Yes
No
Will this business or organization be able to acquire the cash or liquid assets required?
Yes
No
Don't know
Don't know
25. Does this business or organization have the ability to take on debt?
Yes
No
For which of the following reasons is this business or organization unable to take on debt?
Select all that apply.
Cash flow
Lack of confidence or uncertainty in future sales
Request would be turned down
Too difficult or time consuming to apply
Terms and conditions are unfavourable
e.g., interest rate, payment period
Credit rating
Other
Specify other:
Don't know
Teleworking
26. Over the next three months, what percentage of the employees of this business or organization is anticipated to do each of the following?
Exclude staff that are primarily engaged in providing driving or delivery services or staff that primarily work at client premises.
Provide your best estimate rounded to the nearest percentage.
If the percentages are unknown, leave the question blank.
Work exclusively on-site
Percentage of employees:
Telework exclusively
Percentage of employees:
Have a hybrid telework and on-site work arrangement
Percentage of employees:
Flow condition: If 1% or more of this business’s or organization’s workforce is anticipated to telework exclusively in Q26, go to Q27. Otherwise, go to Q28.
27. It was indicated that at least some of the employees of this business or organization are anticipated to telework exclusively. What percentage of these employees are based in a different province or territory than this business or organization?
Include employees that will be working outside of Canada.
Provide your best estimate rounded to the nearest percentage.
Percentage of employees based in a different province or territory as employer:
OR
Don't know
Flow condition: If 100% of this business’s or organization’s workforce is anticipated to work exclusively on-site in Q26, go to Q29. Otherwise, go to Q28.
Cybersecurity
28. In the last 12 months, did this business or organization review its cybersecurity policies in response to employees working remotely?
Yes
No
Not applicable
Don't know
Future outlook
29. Over the next 12 months, what is the future outlook for this business or organization?
Very optimistic
Somewhat optimistic
Somewhat pessimistic
Very pessimistic
Don’t know
30. Compared to sales from October to December 2019, how does this business or organization expect sales from October to December 2021 to change?
Sales are expected to be lower
How long is it expected to take for sales to return to their pre-pandemic levels?
3 to 6 months
6 to 12 months
More than 12 months
Unlikely to return to pre-pandemic level
Don’t know
Sales are expected to be about the sameo
Sales are expected to be higher
Don’t know
Flow condition: If the business or organization is a private sector business, go to Q31. Otherwise, go to “Contact person”.
Ownership
(i) The groups identified within the following questions are included in order to gain a better understanding of businesses owned by members of various communities across Canada.
31. What percentage of this business or organization is owned by women?
Provide your best estimate rounded to the nearest percentage.
Percentage:
OR
Don't know
32. What percentage of this business or organization is owned by First Nations, Métis or Inuit peoples?
Provide your best estimate rounded to the nearest percentage.
Percentage:
OR
Don't know
33. What percentage of this business or organization is owned by immigrants to Canada?
Provide your best estimate rounded to the nearest percentage.
Percentage:
OR
Don't know
34. What percentage of this business or organization is owned by persons with a disability?
Include visible and non-visible disabilities.
Provide your best estimate rounded to the nearest percentage.
Percentage:
OR
Don't know
35. What percentage of this business or organization is owned by LGBTQ2 individuals?
The term LGBTQ2 refers to persons who identify as lesbian, gay, bisexual, transgender, queer and/or two-spirited.
Provide your best estimate rounded to the nearest percentage.
Percentage:
OR
Don't know
36. What percentage of this business or organization is owned by members of visible minorities?
A member of a visible minority in Canada may be defined as someone (other than an Indigenous person) who is non-white in colour or race, regardless of place of birth.
Provide your best estimate rounded to the nearest percentage.
Percentage:
OR
Don't know
Flow condition: If more than 50% of this business or organization is owned by members of visible minorities, go to Q37. Otherwise, go to “Contact person”.
37. It was indicated that at least 51% of this business or organization is owned by members of visible minorities. Please select the categories that describe the owner or owners.
Select all that apply.
South Asian
e.g., East Indian, Pakistani, Sri Lankan
Chinese
Black
Filipino
Latin American
Arab
Southeast Asian
e.g., Vietnamese, Cambodian, Laotian, Thai
Statement of Management Responsibility Including Internal Control over Financial Reporting
Responsibility for the integrity and objectivity of the accompanying financial statements for the year ended March 31, 2021, and all information contained in these statements rests with the management of Statistics Canada (the agency). These financial statements have been prepared by management using the Government of Canada's accounting policies, which are based on Canadian public sector accounting standards.
Management is responsible for the integrity and objectivity of the information in these financial statements. Some of the information in the financial statements is based on management's best estimates and judgment, and gives due consideration to materiality. To fulfill its accounting and reporting responsibilities, management maintains a set of accounts that provides a centralized record of the agency's financial transactions. Financial information submitted in the preparation of the Public Accounts of Canada, and included in the agency's Departmental Results Report, is consistent with these financial statements.
Management is also responsible for maintaining an effective system of internal control over financial reporting (ICFR) designed to provide reasonable assurance that financial information is reliable, that assets are safeguarded, and that transactions are properly authorized and recorded in accordance with the Financial Administration Act and other applicable legislation, regulations, authorities and policies.
Management seeks to ensure the objectivity and integrity of data in its financial statements through careful selection, training and development of qualified staff; through organizational arrangements that provide appropriate divisions of responsibility; through communication programs aimed at ensuring that regulations, policies, standards, and managerial authorities are understood throughout the agency and through conducting an annual risk-based assessment of the effectiveness of the system of ICFR.
The system of ICFR is designed to mitigate risks to a reasonable level based on an ongoing process to identify key risks, to assess the effectiveness of associated key controls, and to make any necessary adjustments.
A risk-based assessment of the system of ICFR for the year ended March 31, 2021 was completed in accordance with the Treasury Board Policy on Financial Management and the results and action plans are summarized in the annex, which can be found at the end of the notes to these financial statements.
The effectiveness and adequacy of the agency's system of internal control is reviewed by the work of internal finance staff, who conduct periodic assessments of different areas of the agency's operations, and by the Departmental Audit Committee (DAC), who provide advice to the Chief Statistician on the adequacy and effectiveness of the agency's risk management, control and governance frameworks and processes.
The financial statements of Statistics Canada have not been audited.
Anil Arora, Chief Statistician
Ottawa, Canada
September 3, 2021
Monia Lahaie, Chief Financial Officer
Ottawa, Canada
September 3, 2021
Statement of Financial Position (Unaudited)
As at March 31 (in thousands of dollars)
Services provided without charge by other federal government departments (note 11a)
-92,622
-83,756
Transfer of emergency salary advances to other federal government departments
-152
20
Transition payments for implementing salary payments in arrears
2
0
Variations in Statement of Financial Position:
Decrease (increase) in accounts receivable and advances
-5,816
4,919
Increase in prepaid expenses
2,083
1,676
Increase in consumable supplies
370
463
Increase (decrease) in accounts payable and accrued liabilities
-14,600
4,326
Increase in vacation pay and compensatory leave
-18,395
-7,097
Decrease in deferred revenue
465
5
Decrease (increase) in employee future benefits
2,450
-1,240
Cash used in operating activities
574,061
524,602
Capital investing activities
Acquisitions of tangible capital assets, excluding capital leases (note 8)
29,018
28,447
Cash used in capital investing activities
29,018
28,447
Financing activities
Payments of lease obligation for tangible capital assets
0
6
Cash used in financing activities
0
6
Net cash provided by Government of Canada
603,079
553,055
The accompanying notes form an integral part of these financial statements.
Notes to the Financial Statements (Unaudited)
For the Year Ended March 31
1. Authority and objectives
Statistics Canada (the agency) was established in 1918, pursuant to the Statistics Act. The agency received full departmental status by order-in-council in 1965.
The agency is a division of the public service named in Schedule I.1 of the Financial Administration Act. The minister responsible for Statistics Canada is the Minister of Innovation, Science and Economic Development, who represents the agency in Parliament and in Cabinet.
The agency's mandate derives primarily from the Statistics Act. The act requires the agency — under the direction of the minister — to collect, compile, analyze, and publish statistical information on the economic, social, and general conditions of the country and its citizens. Statistics Canada has a mandate to coordinate and manage the country's statistical system.
The agency's mandate has two primary objectives:
Provide statistical information and analysis of the economic and social structure and functioning of Canadian society as a basis for the development, operation and evaluation of public policies and programs. This information is used for public and private decision-making, and for the general benefit of all Canadians.
Promote the quality, coherence, and international comparability of Canada's statistics through collaboration with other federal departments and agencies, with the provinces and territories, and in accordance with sound scientific standards and practices.
The agency reports on the two core responsibilities described below.
Statistical information - The agency has a responsibility to produce objective high-quality statistical information for the whole of Canada. The statistical information produced relates to the commercial, industrial, financial, social, economic, environmental and general activities and conditions of the people of Canada.
Internal services - Internal services are groups of related activities and resources that are administered to support the needs of programs and other corporate obligations of an organization.
2. Summary of significant accounting policies
These financial statements have been prepared using the agency's accounting policies stated below, which are based on Canadian public sector accounting standards. The presentation and results using the stated accounting policies do not result in any significant differences from Canadian public sector accounting standards.
The significant accounting policies are as follows:
a) Parliamentary authorities
The agency is financed by the Government of Canada through Parliamentary authorities. Financial reporting of authorities provided to the agency do not parallel financial reporting according to generally accepted accounting principles since authorities are primarily based on cash flow requirements. Consequently, items recognized in the Statement of Financial Position and in the Statement of Operations and Departmental Net Financial Position are not necessarily the same as those provided through authorities from Parliament. Note 3 provides a reconciliation between the bases of reporting. The planned results amounts in the "Expenses" and "Revenues" sections of the Statement of Operations and Departmental Net Financial Position are the amounts reported in the Future-oriented Statement of Operations included in the 2020-21 Departmental Plan. Planned results are not presented in the "Government funding and transfers" section of the Statement of Operations and Departmental Net Financial Position and in the Statement of Change in Departmental Net Debt because these amounts were not included in the 2020-21 Departmental Plan.
b) Net cash provided by Government
The agency operates within the Consolidated Revenue Fund (CRF), which is administered by the Receiver General for Canada. All cash received by the agency is deposited into the CRF, and all cash disbursements made by the agency are paid from the CRF. The net cash provided by the Government is the difference between all cash receipts and all cash disbursements, including transactions between federal government departments.
c) Amounts due from or to the CRF
Amounts due from or to the CRF are the result of timing differences at year-end between the time when a transaction affects authorities and when it is processed through the CRF. Amounts due from the CRF represent the net amount of cash that the agency is entitled to draw from the CRF without further authorities to discharge its liabilities.
d) Revenues
Revenues received for special statistical services are recorded as deferred revenue upon receipt. These amounts are recognized as revenue in the period in which the services are rendered and related expenses are incurred.
Other revenues are recognized in the period the event giving rise to the revenues occurred.
Revenues that are non-respendable are not available to discharge the agency's liabilities. While the Chief Statistician is expected to maintain accounting control, he has no authority regarding the disposition of non-respendable revenues. As a result, non-respendable revenues are considered to be earned on behalf of the Government of Canada and are therefore presented as a reduction of the entity's gross revenues.
e) Expenses
Transfer payments are recorded as an expense in the year the transfer is authorized and all eligibility criteria have been met by the recipient.
Vacation pay and compensatory leave are accrued as the benefits are earned by employees under their respective terms of employment.
Services provided without charge by other federal government departments for accommodation, employer contributions to the health and dental insurance plans, and workers' compensation are recorded as operating expenses at their carrying value.
f) Employee future benefits
Pension benefits — Eligible employees participate in the Public Service Pension Plan, a multi-employer pension plan administered by the Government. The agency's contributions to the Plan are charged to expenses in the year incurred and represent the total departmental obligation to the Plan. The agency's responsibility with regard to the Plan is limited to its contributions. Actuarial surpluses or deficiencies are recognized in the financial statements of the Government of Canada, as the Plan's sponsor.
Severance benefits — The accumulation of severance benefits for voluntary departures ceased for applicable employee groups. The remaining obligation for employees who did not withdraw benefits is calculated using information derived from the results of the actuarially determined liability for employee severance benefits for the Government as a whole.
g) Accounts receivable
Accounts receivable are initially recorded at cost. When necessary, an allowance for valuation is recorded to reduce the carrying value of accounts receivable to amounts that approximate their net recoverable value.
h) Non-financial assets
All tangible capital assets and leasehold improvements having an initial cost of $10,000 or more are recorded at their acquisition cost. Tangible capital assets do not include immovable assets located on reserves as defined in the Indian Act, works of art, museum collection and Crown land to which no acquisition cost is attributable; and intangible assets.
Consumable supplies include items held for future program delivery and are not intended for resale. These supplies are recorded at the acquisition cost. If there is no longer a service potential, the supplies are valued at the lower of cost or net realizable value.
i) Contingent liabilities
Contingent liabilities are potential liabilities which may become actual liabilities when one or more future events occur or fail to occur. If the future event is likely to occur or fail to occur, and a reasonable estimate of the loss can be made, a provision is accrued and an expense recorded to other expenses. If the likelihood is not determinable or an amount cannot be reasonably estimated, the contingency is disclosed in the notes to the financial statements.
j) Contingent assets
Contingent assets are possible assets which may become actual assets when one or more future events occur or fail to occur. If the future even is likely to occur or fail to occur, the contingent asset is disclosed in the notes to the financial statements.
k) Transactions involving foreign currencies
Transactions involving foreign currencies are translated into Canadian dollar equivalents using rates of exchange in effect at the time of those transactions. Gains and losses resulting from foreign currency transactions are reported on the Statement of Operations and Departmental Net Financial Position according to the activities to which they relate.
l) Measurement uncertainty
The preparation of these financial statements requires management to make estimates and assumptions that affect the reported and disclosed amounts of assets, liabilities, revenues and expenses reported in the financial statements and accompanying notes at March 31. The estimates are based on facts and circumstances, historical experience, general economic conditions and reflect the Government's best estimate of the related amount at the end of the reporting period. The most significant items where estimates are used are the liability for employee future benefits and the useful life of tangible capital assets. Actual results could significantly differ from those estimated. Management's estimates are reviewed periodically and, as adjustments become necessary, they are recorded in the financial statements in the year they become known.
m) Related party transactions
Inter-entity transactions are transactions between commonly controlled entities. Inter-entity transactions, other than restructuring transactions, are recorded on a gross basis and are measured at the carrying amount, except for the following:
Services provided on a recovery basis are recognized as revenues and expenses on a gross basis and measured at the exchange amount.
Certain services received on a without charge basis are recorded for departmental financial statement purposes at the carrying amount.
3. Parliamentary authorities
The agency receives most of its funding through annual parliamentary authorities. Items recognized in the Statement of Operations and Departmental Net Financial Position and the Statement of Financial Position in one year may be funded through parliamentary authorities in prior, current, or future years. Accordingly, the agency has different net results of operations for the year on a government funding basis than on an accrual accounting basis. The differences are reconciled in the following tables:
a) Reconciliation of net cost of operations to current year authorities used
Reconciliation of net cost of operations to current year authorities used
2021
2020
(in thousands of dollars)
Net cost of operations before government funding and transfers
732,166
635,502
Adjustments for items affecting net cost of operations but not affecting authorities:
Amortization of tangible capital assets
-31,457
-30,146
Loss on disposal of tangible capital assets
-433
-70
Services provided without charge by other federal government departments
-92,622
-83,756
Increase in vacation pay and compensatory leave
-18,394
-7,097
Decrease (increase) in employee future benefits
2,450
-1,240
Refund of prior years' expenditures
1,091
526
Increase in respendable revenues
0
1,878
Consumption of prepaid expenses
-12,020
-8,831
Bad debt expense
-13
0
Increase in accrued salary receivable
195
451
Total items affecting net cost of operations but not affecting authorities
-151,203
-128,285
Adjustments for items not affecting net cost of operations but affecting authorities:
Acquisition of tangible capital assets, excluding capital leases
29,018
28,447
Decrease in lease obligations for tangible capital assets
0
6
Decrease in respendable accounts receivable
-3,754
0
Acquisition of prepaid expenses
14,103
10,507
Acquisition of consumable supplies
370
463
Increase in salary receivable
513
133
Increase (decrease) in salary advances
7
-9
Transition payments for implementing salary payments in arrears
2
0
Payments for pay equity settlement
97
185
Total items not affecting net cost of operations but affecting authorities
40,356
39,732
Current year authorities used
621,319
546,949
b) Authorities provided and used
Authorities provided and used
2021
2020
(in thousands of dollars)
Authorities provided:
Vote 1 - Operating expenditures
588,445
489,492
Statutory amounts
83,531
73,190
Total authorities provided
671,976
562,682
Less:
Lapsed: Operating expenditures
-50,657
-15,733
Current year authorities used
621,319
546,949
4. Accounts payable and accrued liabilities
The following table presents details of the agency's accounts payable and accrued liabilities:
Accounts payable and accrued liabilities
2021
2020
(in thousands of dollars)
Accounts payable - Other federal government departments and agencies
11,666
6,624
Accounts payable - External parties
41,672
27,669
Accrued salaries and wages
36,293
40,738
Total accounts payables and accrued liabilities
89,631
75,031
5. Deferred revenue
The agency has the authority to expend revenue received during the fiscal year. Deferred revenue represents the balance at year-end of unearned revenues stemming from amounts received from external parties, which are restricted for specific statistical services. Revenue is recognized in the period in which these expenditures are incurred or in which the service is performed. Details of the transactions related to this account are as follows:
Deferred revenue
2021
2020
(in thousands of dollars)
Opening balance
614
619
Amount received
140,261
143,215
Revenues recognized
-140,726
-143,220
Net closing balance
149
614
6. Employee future benefits
a) Pension benefits
The agency's employees participate in the Public Service Pension Plan ("the Plan"), which is sponsored and administered by the Government of Canada. Pension benefits accrue up to a maximum period of 35 years at a rate of 2 percent per year of pensionable service, times the average of the best five consecutive years of earnings. The benefits are integrated with Canada/Québec Pension Plan benefits and they are indexed to inflation.
Both the employees and the agency contribute to the cost of the Plan. Due to the amendment of the Public Service Superannuation Act following the implementation of provisions related to Economic Action Plan 2012, employee contributors have been divided into two groups – Group 1 relates to existing plan members as of December 31, 2012, and Group 2 relates to members who joined the Plan as of January 1, 2013. Each group has a distinct contribution rate.
The 2020-2021 expense amounts to $56,996 thousand ($50,686 thousand in 2019-2020). For Group 1 members, the expense represents approximately 1.01 times (1.01 times in 2019-2020) the employee contributions and, for Group 2 members, approximately 1.00 times (1.00 times in 2019-2020) the employee contributions.
The agency's responsibility with regard to the Plan is limited to its contributions. Actuarial surpluses or deficiencies are recognized in the Consolidated Financial Statements of the Government of Canada, as the Plan's sponsor.
b) Severance benefits
Severance benefits provided to the agency's employees were previously based on an employee's eligibility, years of service and salary at termination of employment. However, since 2011 the accumulation of severance benefits for voluntary departures progressively ceased for substantially all employees. Employees subject to these changes were given the option to be paid the full or partial value of benefits earned to date or collect the full or remaining value of benefits upon departure from the public service. By March 31, 2021, substantially all settlements for immediate cash out were completed. Severance benefits are unfunded and, consequently, the outstanding obligation will be paid from future authorities.
The changes in the obligations during the year were as follows:
Severance benefits
2021
2020
(in thousands of dollars)
Accrued benefit obligation - Beginning of year
20,520
19,280
Expense or adjustment for the year
-380
2,959
Benefits paid during the year
-2,070
-1,721
Accrued benefit obligation - End of year
18,070
20,520
7. Accounts receivable and advances
The following table presents details of the agency's accounts receivable and advances balances:
Receivables - Other federal government departments and agencies
2,896
4,495
Receivables - External parties
3,501
7,598
Employees advances
174
185
Subtotal
6,571
12,278
Allowance for doubtful accounts on receivables from external parties
0
-2
Gross accounts receivable and advances
6,571
12,276
Accounts receivable held on behalf of Government
-1,305
-1,194
Net accounts receivable and advances
5,266
11,082
8. Tangible capital assets
Amortization of tangible capital assets is done on a straight-line basis over the estimated useful life of the asset as follows:
Amortization period of tangible capital assets
Asset class
Amortization period
Computer hardware
5 years
Computer software
5 years
Other equipment
5 years
Motor vehicles
7 years
Leasehold improvements
25 years
Assets under construction
Once available for use
Software under development
Once available for use
Assets under capital leases
Term of lease
Assets under construction and software assets under development are recorded in the applicable asset class in the year that they become available for use and are not amortized until they are available for use.
Included in adjustments are the following: software assets under development of $18,421 thousand that were transferred to computer software upon completion of the assets; assets under construction of $284 thousand that were transferred to leasehold improvements upon completion of construction and $193 thousand that was expensed due to projects being cancelled.
The nature of the agency's activities may result in some large multi-year contracts and obligations whereby the agency will be obligated to make future payments when the services/goods are received. Significant contractual obligations that can be reasonably estimated are summarized as follows:
Contractual obligations
2022
2023
2024
2025
2026 and subsequent
Total
(in thousands of dollars)
Acquisition of goods and services
69,324
3,647
3,651
3,656
0
80,278
Total
69,324
3,647
3,651
3,656
0
80,278
b) Contractual rights
The activities of the agency sometimes involve the negotiation of contracts or agreements with outside parties that result in the agency having rights to both assets and revenues in the future. They involve sales of goods and services. The agency does not have significant contractual rights to disclose as at March 31, 2021.
10. Contingent liabilities and contingent assets
a) Contingent liabilities
Contingent liabilities arise in the normal course of operations and their ultimate disposition is unknown.
Claims and litigations
The agency records an allowance for claims and litigations where it is likely that there will be a future payment and a reasonable estimate of the loss can be made. In 2020-2021, the agency did not have any contingent liabilities.
b) Contingent assets
The agency discloses contingent assets that are likely to be realized. In 2020-2021, the agency did not have any contingent assets.
11. Related party transactions
The agency is related as a result of common ownership to all government departments, agencies, and Crown corporations. Related parties also include individuals who are members of key management personnel or close family members of those individuals, and entities controlled by, or under shared control of, a member of key management personnel or a close family member of that individual.
The agency enters into transactions with these entities in the normal course of business and on normal trade terms.
a) Common services provided without charge by other federal government departments
During the year, the agency received services without charge from certain common service organizations related to accommodation, the employer's contribution to the health and dental insurance plans and workers' compensation coverage. These services provided without charge have been recorded at the carrying value in the agency's Statement of Operations and Departmental Net Financial Position as follows:
Common services provided without charge by other federal government departments
2021
2020
(in thousands of dollars)
Accommodation
43,549
37,017
Employer's contribution to the health and dental insurance plans
49,017
46,667
Worker's compensation
56
72
Total
92,622
83,756
The Government has centralized some of its administrative activities for efficiency, cost-effectiveness purposes and economic delivery of programs to the public. As a result, the Government uses central agencies and common service organizations so that one department performs services for all other departments and agencies without charge. The costs of these services, such as the payroll and cheque issuance services provided by Public Services and Procurement Canada and audit services provided by the Office of the Auditor General are not included in the agency's Statement of Operations and Departmental Net Financial Position.
b) Other transactions with other federal government departments and agencies
Other transactions with other federal government departments and agencies
2021
2020
(in thousands of dollars)
Accounts receivable
2,896
4,495
Accounts payable
11,666
6,624
Expenses
19,041
15,513
Revenues
105,272
103,971
Expenses and revenues disclosed in (b) exclude common services provided without charge, which are already disclosed in (a).
12. Segmented information
Presentation by segment is based on the agency's core responsibilities. The presentation by segment is based on the same accounting policies as described in the Summary of significant accounting policies in note 2. The following table presents the expenses incurred and revenues generated for the main core responsibilities, by major object of expense and by major type of revenue. The segment results for the period are as follows:
Segmented information
Statistical Information
Internal services
2021 Total
2020 Total
(in thousands of dollars)
Transfer payments
Grant to the Organization for Economic Co-operation and Development
0
0
0
64
Total transfer payments
0
0
0
64
Operating expenses
Salaries and employee benefits
618,988
66,903
685,891
609,515
Accommodation
36,580
6,969
43,549
37,018
Professional and special services
29,030
9,015
38,045
33,172
Transportation and postage
9,573
1,018
10,591
16,486
Amortization
30,658
799
31,457
30,146
Repairs and maintenance
658
154
812
749
Materials and supplies
9,136
1,683
10,819
13,271
Rentals
20,835
2,305
23,140
14,829
Communication and printing
7,609
96
7,705
2,126
Loss on disposal of tangible capital assets
240
0
240
23
Bad debts
13
0
13
1
Other
119
32
151
38
Total operating expenses
763,439
88,974
852,413
757,374
Total expenses
763,439
88,974
852,413
757,438
Revenues
Special statistical services
140,726
0
140,726
143,220
Other revenues
28
0
28
72
Revenues earned on behalf of Government
-20,507
0
-20,507
-21,356
Total revenues
120,247
0
120,247
121,936
Net cost from continuing operations
643,192
88,974
732,166
635,502
13. Adjustment to prior year's results
In 2020-2021, the agency decided to review its financial reporting methods related to assets. The review noted that accounts receivable due to salary overpayments should be classified as "Financial assets held on behalf of the Government." The change has been applied retroactively and comparative information for 2019-2020 has been restated.
The following table presents the effect of the prior year restated results:
Adjustment to prior year's results
2020 As previously stated
Effect of the adjustment
2020 Restated
(in thousands of dollars)
Statement of financial position
Financial assets held on behalf of Government
0
-1,194
-1,194
Total net financial assets
68,150
-1,194
66,956
Departmental net debt
62,689
1,194
63,883
Departmental net financial position
107,960
-1,194
106,766
Statement of operations and departmental net financial position
Net cash provided by Government of Canada
553,096
-41
553,055
Net cost of operations after government funding and transfers
5,881
41
5,922
Net financial position – Beginning of year
113,841
-1,153
112,688
Departmental net financial position – End of year
107,960
-1,194
106,766
Statement of change in departmental net debt
Net cost of operations after government funding and transfers
5,881
41
5,922
Departmental Net debt – Beginning of year
56,416
1,153
57,569
Net increase in net debt
6,273
41
6,314
Departmental net debt – End of year
62,689
1,194
63,883
Statement of cash flows
Increase in accounts receivable and advances
4,960
-41
4,919
Cash used in operating activities
524,643
-41
524,602
Net cash provided by Government of Canada
553,096
-41
553,055
Annex to the Statement of Management Responsibility Including Internal Control over Financial Reporting of Statistics Canada for Fiscal Year 2020-2021 (Unaudited)
1. Introduction
This document is attached to Statistics Canada's Statement of Management Responsibility Including Internal Control over Financial Reporting for the 2020–2021 fiscal year. This annex provides summary information on the measures taken by Statistics Canada to maintain an effective system of internal control over financial reporting (ICFR), including information on internal control management, assessment results and related action plans.
2. Departmental system of internal control over financial reporting
2.1 Internal control management
Statistics Canada has a well-established governance and accountability structure to support departmental assessment efforts and oversight of its system of internal control. A departmental internal control management framework, approved by the Chief Statistician and the Chief Financial Officer (CFO), is in place and includes:
organizational accountability structures as they relate to internal control management to support sound financial management, including roles and responsibilities of senior managers for control management in their areas of responsibility;
values and ethics considerations;
ongoing communication and training on statutory requirements, and policies and procedures for sound financial management and control; and
regular updates to, and monitoring at least on a semi-annual basis, of internal control management as well as the provision of related assessment results and action plans to the Chief Statistician, senior departmental management and the Departmental Audit Committee (DAC).
The DAC provides advice to the Chief Statistician on the adequacy and effectiveness of the agency's risk management, control and governance frameworks and processes.
2.2 Service arrangements relevant to financial statements
Statistics Canada relies on other organizations for the processing of certain transactions that are recorded in its financial statements, as follows:
2.2.1 Common arrangements
Public Services and Procurement Canada (PSPC) administers the payment of salaries, the procurement of certain goods and services, and provides accommodation services;
Shared Services Canada (SSC) provides information technology (IT) infrastructure services;
The Department of Justice Canada provides legal services; and
The Treasury Board of Canada Secretariat (TBS) provides information on public service insurance and centrally administers payment of the employer's share of contribution toward statutory employee benefit plans.
2.2.2 Specific arrangements
PSPC provides Statistics Canada with the Common Departmental Financial System platform to capture and report financial and materiel management transactions.
Readers of this annex may refer to the annexes of the above-noted departments for a greater understanding of the systems of internal control over financial reporting (ICFR) related to these specific services.
3. Statistics Canada assessment results during fiscal year 2020-2021
Statistics Canada adopted an ongoing, rotational, risk-based monitoring approach to support testing of internal control over financial reporting. For 2020-2021, Statistics Canada updated its Internal Control over Financial Management Risk-based Monitoring Strategy, which replaced its previous version from 2017. According to the new strategy, the ongoing monitoring cycle has been extended to a four-year period and the plan is adjusted through an annual risk assessment process.
The following table summarizes the status of the ongoing monitoring activities according to the previous fiscal year's rotational plan.
Progress during the 2020-2021 fiscal year
Previous fiscal year's rotational ongoing monitoring plan for current fiscal year
Status
Financial Close and Reporting; Payroll and Benefits
Completed as planned; no remedial actions required.
Entity Level Controls
Completed as planned; remedial actions started.
Revenue
Moved forward from 2021-2022; no remedial actions required.
IT General Controls related to Census pay systems and Census Payroll
Not completed as planned. Design effectiveness was completed in 2019-20 however unable to complete operating effectiveness in 2020-2021 due to delay in cyclical process. To be completed in next cycle.
In addition to the ongoing monitoring plan for ICFR, in 2020-2021 Statistics Canada conducted design effectiveness and operating effectiveness testing on the Costing and CFO Attestation on the broader Internal Control over Financial Management (ICFM) business processes as well as ongoing monitoring of the Budgeting and Forecasting ICFM business processes.
New or significantly amended key controls are summarized in section 3.1. The areas of the departmental system of internal controls which have been reviewed this fiscal year are summarized in section 3.2.
3.1 New or significantly amended key controls
In the current year, there were no new or significantly amended key controls in existing processes which required a reassessment. Design effectiveness and operating effectiveness testing was conducted on the key controls for ICFM business processes: Costing and CFO Attestation. Significant adjustments were not required for the new key controls.
3.2 Ongoing monitoring program
As part of its rotational ongoing monitoring plan, the agency completed its reassessment of Entity Level Controls and controls within specific business processes. Senior management has received reports on the results of testing and has developed action plans where necessary. For the most part, the key controls that were tested performed as intended.
4. Action plan for the next fiscal year (2021-2022) and subsequent fiscal years
The table below shows the agency's rotational ongoing monitoring plan over the next three years. An annual risk assessment is conducted to validate the high-risk controls and to adjust the on-going monitoring plan as required. Action plans from previous years will be followed-up on to ensure that remedial actions have been taken.
Statistics Canada produces objective, high-quality statistical information for the whole of Canada. The statistical information produced relates to the commercial, industrial, financial, social, economic, environmental and general activities and conditions of the people of Canada.
Results
At the onset of the COVID-19 pandemic, when Canadians needed timely and accurate data to support evidence-based decision making, Statistics Canada adapted quickly to respond to urgent data needs. In fact, the pandemic accelerated Statistics Canada's ongoing efforts to modernize its operations and promote a culture of innovation.
Overnight, Statistics Canada's employees pivoted to working virtually, while developing new methods to collect, analyze and share data safely, securely and remotely. The agency documented unprecedented changes to Canada's economy, including sudden shifts in industrial activity that dramatically impacted supply chains, particularly in the agriculture, energy and transportation sectors. These rapid shifts affected consumer behaviour, resulting in sudden changes in the prices of certain goods and services.
The agency's employees tracked price fluctuations for its monthly measure of inflation without stepping into a single store. They measured employment trends without interviewing anyone on their doorstep. They released monthly flash estimates of high-frequency economic indicators, such as gross domestic product. And, using new data collection methods, such as crowdsourcing, Statistics Canada published its first-ever study of how Canadians experienced discrimination during the pandemic.
In the early days of the pandemic, the agency partnered with the Canadian Chamber of Commerce, the country's largest business group, to examine the impact of the nationwide economic shutdown on the country's firms. The results of the quarterly Canadian Survey on Business Conditions were vital in providing the Government of Canada with the information it needed to design and implement emergency income-support programs that met the urgent needs of the moment. These programs have helped backstop the Canadian economy better than those in other G7 countries. As Canada moves from pandemic response to recovery, Canadian businesses continue to rely on the results of this quarterly survey to adjust their operations and outlook in response to economic uncertainties created by the pandemic.
The agency also produced crucial data on employment, health, safety, business closures, consumption trends, immigration levels, interest rates and housing prices, in addition to providing statistical evidence that the COVID-19 pandemic has had an unequal impact on diverse populations, which has sharpened existing social and income inequalities. In continuing to track levels of economic activity, Statistics Canada has identified a modest and uneven recovery that continues to sharpen social and economic inequality, especially among women, young people, Indigenous people, workers without a postsecondary education, new immigrants and groups designated as visible minorities.
Above all, 2020–21 has underscored the importance of partnerships in ensuring that Statistics Canada remains responsive to the rapidly evolving data needs of Canadians. For that reason, the agency has forged ongoing collaborations, not only with other federal departments and agencies, but also with other orders of government, civil society groups and organizations in the private sector.
In addition, the agency continues to develop new digital platforms that enable the country's researchers to access Statistics Canada's vast data holdings as quickly and securely as possible. In that way, the agency plays a key role within the nation's research ecosystem and in a knowledge-based economy. Statistics Canada's data and insights help accelerate the pace of discovery and innovation. Through its vast data holdings, rigorous data methods, and ability to produce rich and detailed microdata sets, the agency helps generate new ideas and move the goalposts of knowledge.
However, getting more value out of data for Canadians does not mean sacrificing the protection of personal information. As a trusted data steward, Statistics Canada is unwavering in upholding its legal duty to collect, store and use data responsibly and to protect the data in its care. Through the agency's online Trust Centre, Statistics Canada engages in an ongoing dialogue with Canadians about how it collects and uses data on behalf of the people of Canada, while protecting their privacy and safeguarding the confidentiality of the data they have entrusted to the agency.
Statistics Canada is working to strengthen the overall quality of the national statistical system. In 2020–21, the agency facilitated 10 meetings of the Canadian Statistics Advisory Council (CSAC). This council is mandated to provide advice to the Minister of Innovation, Science and Industry and the Chief Statistician of Canada on matters related to the overall quality of the national statistical system. These matters may include the relevance, accuracy, accessibility and timeliness of the agency's data. In October 2020, the CSAC released its first annual report, providing a detailed assessment of Canada's statistical system and guidance on how to strengthen it. Over the past year, Statistics Canada has worked closely with the CSAC and partners inside and outside the Government of Canada to deliver results in the areas outlined in the report. Statistics Canada is grateful for the advice and guidance of the members of the CSAC.
Modernization pillars
Providing user-centric services
2021 Census
Engaging Canadians
StatCanPlus
Collaborative Platforms
Accessing data virtually
Providing more granular, disaggregated data
Providing COVID-19 data in a time of uncertainty
Developing leading-edge methods
Flash estimates
Web scraping
Crowdsourcing
COVID-19 Communication Geospatial Tool
Canadian Economic Dashboard
Data Science
Machine Learning Framework
Social Data Integration Platform
Building statistical capacity and leadership
Statistics Canada Data Strategy
Data Literacy Training Initiative (DLTI)
Data Science Network for the Federal Public Service
Canada School of Public Service Digital Academy
Personal Protective Equipment (PPE) Data Strategy
Centre for Gender, Diversity and Inclusion Statistics
Engaging with Canadians
Partnering with government departments (city, municipal, provincial & federal) through the pandemic
Canadian Centre for Energy Information (CCEI)
Northern Data Strategy
International
Private Sector
2030 Agenda for Sustainable Development
Academia and Researchers
Public engagement
Designing a modern and flexible workplace
Equipping employees for remote work
Cloud initiative
Beyond 2020
Protecting employee mental health and well-being
Diversity and Inclusion
Providing user-centric services
As part of the agency's ongoing efforts to modernize its operations, Statistics Canada participated in the pandemic response by fast-tracking initiatives that were already underway to develop new solutions that provide Canadians with easier, more convenient ways to access its vast data holdings.
Adapting the 2021 Census for COVID-19
The agency's major undertaking in 2020–21 was to ensure that the 2021 Census of Population could be conducted during a pandemic safely, securely and remotely. The decision to revise the collection plan was made with the health and safety of both respondents and enumerators as the top priority. The 2021 Census was adapted to ensure that every Canadian had the opportunity to be heard in the safest way possible. That meant setting up virtual offices, training census employees remotely, and limiting in-person contact between enumerators and respondents. As part of a rapid scale-up of census operations, nearly 1,200 temporary staff were initially hired, culminating in a total of more than 30,000 staff recruited by the end of the fiscal year 2020–21.
Following consultations that took place in 2019–20, Statistics Canada continued to engage with Canadians in 2020–21 through seven virtual roundtable discussions. This dialogue with Canadians focused on proposed changes to the 2021 Census that, among other topics, included new questions related to gender, Indigenous peoples, official language education, military service and veterans, and employment status during the pandemic.
The 2021 Census of Agriculture, which collects data on Canada's agriculture sector, was also adapted to reduce the number of surveys that farm operators were asked to fill out and to eliminate in-person contact between them and enumerators. The Census of Agriculture is the only data source that provides a comprehensive and integrated profile of the physical, economic, social and environmental aspects of Canada's agriculture industry for small geographic areas. Users in the private sector see the Census of Agriculture as an important tool for business and investment planning. Farming groups use Census of Agriculture data as a foundation for their discussions with governments and trade organizations and to evaluate the impact of natural disasters, such as fires, floods, droughts and storms, on the sector.
Engaging with Canadians during COVID-19
Over the 2020–21 fiscal year, Canadians engaged with Statistics Canada's website and social media channels more than ever before. Engagement levels exceeded all of the agency's targets. Indeed, the volume of social media engagement more than doubled from its initial targets, proving that Canadians viewed Statistics Canada as vital to their everyday lives, regardless of where they were located.
Engaging with Canadians during COVID-19
Performance Indicators
Fiscal year targets
End of fiscal year 2020–21 results
Media citations
60,000
253,171 (422%)
Social media engagements
641,300
1,043,628 (162%)
Social media impressions
23,723,950
38,432,673 (163%)
Social media followers
321,500
404,402 (123%)
In addition, the agency conducted a market analysis to better understand the preferences of Canadians who use its website. The goal was to identify opportunities to expand the reach of the agency's web-based products and services. That analysis resulted in the development of new ways to reach diverse populations through storytelling, infographics, interactive data visualizations and topic-specific web portals. Over the 2020–21 fiscal year, Statistics Canada provided a total of 40,738 data products on its website—a 4.5% increase from its stated target. Another 7,755 data tables were released through the Open Government Portal—an increase of 4% from its stated target.
Releasing timely information more frequently
Description - My Census Story
Contest alert – Calling all secondary and postsecondary students! Are you up for a #Census Challenge? We've partnered with the Statistical Society of Canada to bring you a new contest: #MyCensusStory!
Do you use statistical or #census data at school or in your personal life? Do you have a creative way to tell Canadians why it's important to complete their census questionnaire in May? If so, share your story with us starting on March 22 for a chance to win a prize: www12.statcan.gc.ca/census-recensement/contest-concours/index-eng.cfm
In December 2020, the agency launched StatCanplus portal. This first iteration will be leveraged to collect user feedback and gather analytics to inform the look, feel and capabilities of future iterations. The StatCanplus is the first step in providing a platform through which the agency can release information at multiple times throughout the day. This portal packages data and analysis in a way that is more accessible to the general public and business users through which the power of data storytelling can be better leveraged. The ultimate goal of the StatCanplus is to bridge some of the identified gaps in user needs to ensure Statistics Canada continues to connect with Canadians.
Developing a virtual platform for data scientists and researchers
Over the past year, Statistics Canada has made significant progress in the development of Data Analytics as a Service (DAaaS), a cloud-based computing platform that has revolutionized the way data scientists and researchers use and share statistical information. DAaaS provides users with virtual access to data and analytical tools and software on a secure and easy-to-use platform. Users can work within this secure platform to prepare and transform datasets, analyze and present data, and share data-driven insights.
In its first full year of service, DAaaS has attracted more users than expected. DAaaS put into service two key analytical platforms, the Advanced Analytics Workspace and the Collaborative Analytics Environment. The number of business solutions targeted to be onboarded to these platforms was set to four. However, its success was unparalleled, and DAaaS onboarded 23 business solutions, greatly exceeding its original target. This year's target primary user group was data scientists, where an unprecedented 84% uptake from within that community was observed. Overall, the number of components scheduled for release was set to 3, but the end result was a release of 17 components. These components were leveraged by close to 500 users, 50% more than anticipated for the year, 10% of which were external to the agency. Overall, it was a banner year for the program in terms of service delivery and user community uptake.
In collaboration with Health Canada and the Public Health Agency of Canada, Statistics Canada developed the personal protective equipment dashboard, which would not have been possible without the DAaaS platform. This tool helped governments track the national supply of personal protective equipment and ensure that those critical resources were distributed to where they were most needed.
Accessing data virtually
In 2020–21, the agency developed a variety of initiatives that enabled researchers to access Statistics Canada's data virtually. One of those initiatives is the Virtual Data Lab (VDL), which was piloted during the pandemic. When it is fully implemented, the VDL will provide authorized users with remote access to detailed, anonymized social and business microdata through a secure, cloud-based computing interface. Other initiatives to improve virtual data access included the launch of an interim solution to facilitate COVID-19 research and a pilot project that used cloud-based computing to facilitate a project on opioid use, conducted with federal partners.
Better data for better outcomes
Statistics Canada is responding to the growing demand for more detailed data to support decision making by all orders of government, including at the municipal level. The onset of the pandemic underscored the need for Canada's cities to have more detailed data at the local level to drive better decision making and outcomes. In 2020–21, Statistics Canada partnered with the City of Vancouver to pilot an approach to provide data at the municipal level, rather than at the traditional level of census metropolitan areas. This project marked an important step towards addressing data gaps at the community level and sets the stage for further collaboration with the Federation of Canadian Municipalities (FCM).
Statistics Canada has invested in four projects in partnership with the FCM aimed at improving awareness, data literacy and use of data by local governments. This partnership will in turn improve the agency's understanding of local issues and priorities, and identify potential opportunities to better serve Canadians' growing need for detailed data at the lowest level of geography possible.
Data to help pandemic responders see opportunities sooner and act faster
Description - Impact of Covid-19 on small businesses in Canada
Data table for Impact of Covid-19 on small businesses in Canada
Table summary
This table displays the results of Impact of Covid-19 on small businesses in Canada. Percent of businesses unable to take on more debt and Percent of businesses that had the cash or liquid assets required to operate, calculated using percent units of measure (appearing as column headers).
Percent of businesses unable to take on more debt
Percent of businesses that had the cash or liquid assets required to operate
All employment sizes
43.9
76.9
1 to 4 employees
47.2
75.4
5 to 19 employees
43.4
77.0
20 to 99 employees
34.3
83.2
100 or more employees
16.8
80.8
Note: Respondents were asked if the business or organization had the ability to take on more debt, and if they had the cash or liquid assets required to operate. Source: Canadian Survey on Business Conditions: Impact of COVID-19 on businesses in Canada (Table 33-10-0286-01 and 33-10-0287-01).
The COVID-19 pandemic has underscored the importance of data in effective decision making. In the middle of a rapidly evolving crisis, those who can see opportunities and challenges sooner can act faster—and smarter. As part of COVID-19: A data perspective, Statistics Canada produced data-driven insights about the economic, social and health impacts of COVID-19 on the people of Canada in ways that have shaped both the scale and the trajectory of the pandemic response. Below are some of those key insights:
Uneven impacts: The pandemic did not affect all Canadians equally. Those who were hit hardest by job losses, reduced work hours and lost wages included women, Indigenous people, groups designated as visible minorities, young people and Canadians living with disabilities.
Economic impacts: Overall levels of business activity remain below pre-pandemic levels, and pressures related to profitability and operating costs remain, with some sectors hit harder than others.
Indirect health impacts: Actions taken to manage the pandemic may have lasting effects on the mental and physical health of Canadians.
Demography: Canada witnessed a significant decline in population growth, chiefly resulting from a drop in immigration during the pandemic. Canada's population was estimated at 38,048,738 on January 1, 2021, an increase of 149,461 (+0.4%) year over year. This growth rate is the lowest since 1916 (+0.3%). In 2020, Canada welcomed 184,624 immigrants, the lowest number since 1998, and almost half (-45.9%) the number welcomed in 2019.
Developing leading-edge methods of data collection and integration
In a digital and data-driven world, Statistics Canada continued to modernize its operations in 2020–21 by moving beyond its traditional survey-first approach and including more alternative data sources. In doing so, the agency continued to reduce the number of surveys that Canadians are asked to fill out; find more efficient ways to collect, use and share data responsibly; and improve the reliability of the data used to produce the rigorous, high-quality data and insights for which Statistics Canada is known worldwide.
In particular, the agency has focused on identifying new methods of gathering data from third parties in both the public and the private sectors. These new methods of collecting and analyzing data are needed at a time when the nation is transitioning from pandemic response to recovery against a backdrop of economic uncertainty and social inequality. And, as a first principle, Statistics Canada's operating context always includes protecting the privacy of Canadians and safeguarding the confidentiality of the data they have entrusted to the agency. It is not just a promise; it is the law in Canada.
Producing flash economic estimates
Against the backdrop of a rapidly evolving pandemic, Statistics Canada reacted quickly to deliver timely, high-frequency data about the nation's economy during large-scale disruptions to business activity. In April 2020, the agency produced its first-ever flash gross domestic product (GDP) estimate to provide decision makers with the most up-to-date information possible about manufacturing, trade, prices, product shortages and more. This inaugural flash GDP estimate gave decision makers the first snapshot of the sheer scale of the pandemic's impact on the Canadian economy at a time when official monthly and quarterly estimates were not yet available.
Crowdsourcing information during a pandemic
Conducting surveys became more difficult during the pandemic. For that reason, Statistics Canada found alternative methods, such as crowdsourcing, to rapidly collect information from Canadians in safe, secure and remote ways. As of September 2020, more than 500,000 Canadians had voluntarily participated in Statistics Canada's crowdsourcing activities, providing decision makers with timely and relevant information about issues important to them during the pandemic.
Crowdsourcing initiatives
April 2020: Impacts of COVID-19 on Canadians
April to May 2020: Impacts of the pandemic on postsecondary students
April to May 2020: Mental health of Canadians
May 2020: Canadians' perceptions of personal safety
May to June 2020: Canadians' trust in government, public health authorities and businesses
June 2020: Impact of COVID-19 on Canadian families and children
June to July 2020: Impacts of the pandemic on Canadians living with long-term conditions and disabilities
August 2020: Canadians' experiences with discrimination
December 2020: Diversity of charity and non-profit boards
Creating an analytical tool to support pandemic response
Canadian Statistical Geospatial Explorer Hub
In April 2020, Statistics Canada released a new interactive web-mapping tool called the Canadian Statistical Geospatial Explorer Hub. This tool enables users to visualize data at granular levels, such as neighbourhoods and health regions, and at higher levels of geography. Through this tool and accompanying tutorials, users can explore Statistics Canada's data holdings, as well as other datasets. They can also create their own custom maps and download geo-enabled data into their own geospatial tools.
In response to the COVID-19 pandemic, Statistics Canada partnered with other federal departments and agencies to develop the COVID-19 communication geospatial tool. This tool brought together COVID-19 data from the Public Health Agency of Canada with demographic data from the census. It has been used to identify COVID-19 hotspots by geographic areas for enhanced public health response and help plan vaccine distribution.
Tracking COVID-19's impact on Canada's labour force
In April 2020, the Labour Force Survey was enhanced to reflect changing labour conditions during the pandemic. Questions were added to better understand Canadians' experience of working from home, losing jobs, meeting financial obligations and applying to federal COVID-19 assistance programs, as well as their self-assessed changes in productivity. In July 2020, a question was added to determine whether a respondent belonged to a group designated as a visible minority. These questions improved the agency's ability to report on the pandemic's impact on various population groups.
Monitoring inflation during the pandemic
The COVID-19 pandemic led to sudden and significant changes in consumer spending. In collaboration with the Bank of Canada, Statistics Canada developed the adjusted price index to better reflect these pandemic-related shifts. The adjusted index considers sudden shifts in spending patterns when weighting the goods and services that make up the Consumer Price Index. The adjusted price index helped shape the pandemic response by providing policy makers and business leaders with a more timely and accurate reflection of changes in household expenditures during the pandemic.
"We have tracked price fluctuations without stepping into a single store or outlet. We have measured employment and unemployment trends without interviewing anyone on their doorstep. We now put out flash estimates showing near real-time trends with far richer context and analysis."
Tracking sharp economic shifts
The new Canadian Economic Dashboard and COVID-19 was created to track the economic impacts of the pandemic from one convenient portal. The dashboard provides data on a wide range of monthly indicators, including real GDP, consumer prices, employment rates, merchandise exports and imports, retail sales, hours worked, and manufacturing sales. The dashboard was added to the agency's website in April 2020 and has since been updated regularly to provide policy makers and business leaders with a better understanding of the impact of the pandemic across various industries so that they can make decisions that meet the urgent needs of the moment.
Monitoring COVID-19 immunity in Canadians
The Canadian COVID-19 Antibody and Health Survey collected information about how the virus that causes COVID-19 is transmitted and the extent to which Canadians have developed immunity against it. The survey was conducted between November 2020 and March 2021 using an online questionnaire. It also included a finger-prick blood test to determine the presence of COVID-19 antibodies. The survey was designed to obtain a representative picture of the Canadian population, covering all age groups.
Investing in data science to support pandemic response
As part of a multi-year effort to modernize its operations, Statistics Canada invested in a data science strategy and related tools in 2020–21. Data science is a promising field that complements traditional statistical methods, potentially improving the production of official statistics by enabling the integration of non-survey-related data sources. The use of data science enabled Statistics Canada to respond rapidly to pandemic-related data needs in the following ways:
deploying an artificial intelligence tool that helped the Public Health Agency of Canada as it explored ways to optimize the use of non-pharmaceutical interventions in reducing the spread of COVID-19
applying machine learning to data models to evaluate the effectiveness of various public health measures in minimizing the spread of COVID-19.
Responsible and ethical use of machine learning
Statistics Canada acknowledges the ethical responsibility that comes with integrating and analyzing data using emerging technologies. That is why the agency has developed and implemented a machine learning framework to ensure that the use of artificial intelligence algorithms as a high-throughput method to analyze large volumes of data creates value for Canadians, while preventing any harm to vulnerable populations through bias, discrimination or a lack of diversity. This framework has been developed around four principles: respect for people, respect for data, sound application and sound methods. It enables applications to be developed according to the standards outlined in the Treasury Board Secretariat's Directive on Automated Decision-Making.
Description - Framework for responsible machine learning
Assessed through self-evaluation and peer review, using a checklist and producing a report or dashboard.
Circular diagram depicting the four pivotal concepts for the production of trustworthy insight from responsible machine learning processes. Starting from the top left and moving clockwise:
Concept #1: Respect for People with attributes such as Value to Canadians; Prevention of harm; Fairness and Accountability.
Concept #2: Sound Application with attributes such as Transparency; Reproducibility of process and results.
Concept #3: Sound Methods with attributes such as Quality learning data; Valid inference; Rigorous modelling and Explainability.
Concept #4: Respect for Data with attributes such as Privacy; Security and Confidentiality.
Reaching Canadians safely, securely and remotely during the pandemic
The pandemic has accelerated Statistics Canada's culture of innovation, resulting in the development of leading-edge data collection methods that move beyond the traditional survey-first approach, which reduce the time and effort Canadians spend filling out surveys, while creating rich value-added datasets.
Among other innovations, Statistics Canada has experimented with the development of the Social Data Integration Platform, which has led to the development of new ways to collect and integrate social statistics. Another innovation was the introduction of probabilistic web panels, which are panels of people willing to respond to web questionnaires. This type of data collection, which was used six times during 2020–21, launched with a web panel focused on the social impacts of COVID-19. It has since become an important way for Statistics Canada to recruit online respondents safely, securely and remotely to respect public health measures during the pandemic. The agency is now exploring the possibility of expanding the use of web panels to reach more respondents safely, securely and remotely, making it more convenient for Canadians to respond to Statistics Canada questionnaires.
Producing farming data without surveys?
Like other data users, farmers want timely, accurate and detailed data, without the need to fill out too many surveys that take them away from the high-value work they do of growing the food that feeds the nation and the world. That is why Statistics Canada is moving beyond a survey-first approach to gradually replace survey data with alternative data sources.
This multi-year initiative, known as AgZero, is gradually reducing the number of survey questions asked of farmers and increasing the information gathered about the agriculture sector through advanced technologies and leading-edge data collection methods. By 2026, Statistics Canada anticipates reducing the number of survey questions it asks farmers to as close to zero as possible, so that they can spend more time in the fields, running their vital farming operations.
For example, Statistics Canada has created a new model to estimate crop yields by combining satellite imagery with weather and crop insurance data. In April 2020, shortly after the first wave of the pandemic hit, AgZero used alternative data sources to compile timely estimates of the temporary foreign workers and total number of employees in the sector, which were used to forecast labour needs in the agriculture sector during the 2020 growing season. These estimates, which addressed a longstanding data need within the sector, gave farm groups and governments the data they needed to respond, particularly at the outset of the pandemic, when Canadians raised concerns about the security and resilience of the nation's food supply chain and labour availability during COVID-19.
Through these new data collection methods, the agency has not only maintained, but also improved the quality of the data collected. As a result of pilot projects that were successfully implemented to replace surveys, more timely, mission-critical data became available early in the pandemic, which enabled Statistics Canada to more accurately track rapid fluctuations in the Canadian food supply chain.
Finally, the agency is experimenting with artificial intelligence tools to detect and classify construction starts from satellite images as it works towards replacing the building permits survey, potentially cutting costs and producing more timely data.
Understanding the opioid crisis
Statistics Canada partnered with Health Canada in 2020–21 to better understand the social conditions people live in that can determine their level of risk for opioid addiction and overdose-related death. For example, the agency used local health data and administrative data from Simcoe County in central Ontario and the nearby Rama First Nation to provide meaningful insights regarding those at greatest risk of an opioid overdose.
Building statistical capacity and leadership
Statistics Canada is a world leader in helping more people use data as a strategic asset to improve decision making and outcomes.
Harnessing the power of data for Indigenous self-determination
In a spirit of reconciliation and partnership, Statistics Canada continued to support Indigenous organizations and communities in 2020–21 as they developed the skills and infrastructure to build and maintain their own statistical programs, based on their own needs. Through newly established partnerships, the agency worked with the Assembly of First Nations, Inuit Tapiriit Kanatami and Métis regional governments to discuss areas of mutual interest and to help them build their own capacity for data collection and analysis. One innovative project produced for the Aboriginal Firefighters Association of Canada looked at fire-related mortality, and the study showed a bleak picture of fire-related deaths and injuries of Indigenous people in Canada. The goal is to support Indigenous communities in their use of data, putting decision making in their own hands and enabling them to embark firmly on a path towards self-determination; an important step to reconciliation.
Leading the way on gender, diversity and inclusion statistics
COVID-19 has had an unprecedented impact on Canadians, and particularly on the country's most vulnerable populations. Disaggregating larger datasets will help identify the impact of the pandemic on vulnerable populations. Census content allows for disaggregated data analysis. This includes analysis by gender and for populations of interest such as Indigenous peoples, immigrants and refugees, veterans, groups designated as visible minorities, and children who could have access to instruction in the minority official language.
As a world leader in developing data to bring fairness and inclusion to public policy decisions that affect all Canadians, Statistics Canada's Centre for Gender, Diversity and Inclusion Statistics published several releases in 2020–21 about the impact of the pandemic on various population groups. These releases addressed the changing roles of parents during COVID-19 and the unequal economic and health burden of the pandemic on Canadians belonging to groups designated as visible minorities and LGBTQ2+ Canadians. These releases supported the Government of Canada's ongoing efforts to include data that are lacking to address gender gaps and systemic racism.
Description - The Gender Wage Gap in 2018
Gender, Diversity and Inclusion: Overview of Statistics Canada's disaggregated data
In 2018, employed core-aged men (25 to 54 years old) earned an average of $31.05 per hour, while women earned $26.92.
To that end, the Centre has answered the call of Canadians who are seeking gender, diversity and inclusion data so that they can bring the economic and social impacts on marginalized groups into the heart of decision making. In 2020–21, the Centre's team gave more than 20 presentations on topics such as how the Government of Canada uses a gender-based analysis plus framework to assess the impact of public policies on women, Indigenous people, groups designated as visible minorities, Canadians living with disabilities and LGBTQ2+ communities.
In February 2021, the Centre hosted a two-hour virtual event that brought together nearly 1,000 participants. This event was part of an ongoing collaboration between Statistics Canada, the Canadian Chamber of Commerce, and groups representing Black and Indigenous communities. Entitled Data Story: Data-driven Insights on Black Communities in Canada, it featured a diverse panel of experts from the agency, other government departments, academia and the private sector that explored, among other topics, the economic and social impacts of COVID-19 on racialized communities.
In 2020–21, the Centre also released seven new indicators for the Gender Results Framework, a whole-of-government tool to help guide future policy decisions and track progress on gender equality and diversity across a number of identified policy priorities.
Other releases on diversity, equity and inclusion in 2020–21 focused on the following topics: access to postsecondary education for learners with a disability; educational participation and outcomes assessed through the lens of social inequity; overqualification for jobs among immigrants and non-immigrants; high school equivalency among the Indigenous population living off-reserve; and the savings intentions of Canadians and new immigrants, in particular, who plan to financially support their children in their postsecondary education.
Disaggregating more data based on gender, ethnicity, race and other categories will improve the ability of policy makers to respond to social inequality, systemic racism and gender gaps, while addressing their root causes.
Harnessing data as an asset to better serve Canadians
COVID-19 has accelerated collaborations across the Government of Canada, other orders of government, civil society groups and the private sector to share data as quickly and as openly as possible. It has taken a pandemic to remind Canadians of the importance of streamlining data sharing and put aside artificial notions of data ownership. As part of its ongoing collaborations with federal departments, Statistics Canada continues to be a leader in data stewardship to ensure that the federal public service can effectively govern, manage and use its data assets to better serve Canadians. In 2020–21, the agency worked to deliver on the following five priority initiatives as part of its ongoing work to implement a roadmap for a whole-of-government data strategy:
The agency developed a personal protective equipment data strategy to help manage the nation's supply of personal protective equipment and deploy that equipment to where it was needed most. The data strategy was developed to ensure that lessons learned from this intergovernmental project were leveraged to ensure rapid response to future crises such as pandemics. The strategy was also developed to ensure scalability and to ensure a whole-of-government approach in the long term.
The Statistics Canada Data Strategy was launched in April 2020. This evergreen document provides steps for managing and leveraging the agency's data assets to ensure optimal use and value while maintaining public trust. It will cement the agency's status as a data steward, leading and strengthening Canada's national statistical system.
The Data Literacy Training Initiative was launched in September 2020. It mobilized the agency's expertise in data literacy to create 20 online training videos covering the basics for those new to data. The agency is committed to building statistical capacity with partners and fostering data literacy among Canadians to enable more end-users—whether they are businesses, governments or individuals—to make evidence-based decisions. As of March 31, 2021, this initiative had received over 22,000 visitors and 63,000 page views.
The Data Science Network for the Federal Public Service was launched in 2020. The network's goal is to establish a whole-of-government data science ecosystem that enables knowledge and expertise to be shared, best practices and standards to be established, and data science capacity to grow. The network has been well received, with more than 1,800 members and 24 federal government departments participating in its steering committee. Statistics Canada also co-chairs the Enterprise Data Community of Practice. This community of practice was created to ensure the Government of Canada builds capacity across all departments and agencies to use data as a strategic asset to better serve Canadians.
Statistics Canada has a long history of working with other organizations to improve statistical capacity and ensure high-quality statistics are developed based on international standards. During the pandemic, the agency pivoted to support partners virtually. For example, through the Project for the Regional Advancement of Statistics in the Caribbean, Statistics Canada supported countries with less robust statistical systems in the following ways:
enhancing the statistical business register successfully deployed to Antigua and Barbuda, paving the way for deployment to other countries
providing support to Caribbean countries to ensure their respective consumer price indexes were aligned with the standards of other national statistical agencies around the world in addressing data gaps and data quality issues during pandemic shutdowns
supporting Belize in designing and implementing a survey to measure the impact of COVID-19 on businesses, the results of which were disseminated in March 2021
helping national statistical agencies in the Caribbean adapt their questionnaires for their respective labour force surveys to include questions related to the impacts of COVID-19 on employment and unemployment
assisting with planning and preparations for census-related activities around the Caribbean region.
Engaging with Canadians for effective pandemic response
Collaborating with public- and private-sector partners, Statistics Canada has identified new ways to collect and share data, while maintaining the high standards of trust that Canadians have come to expect from their national statistical agency. To ensure that more data are integrated from a variety of sources in a timely way, particularly for a rapid and effective pandemic response, the agency collaborated with an unprecedented number of new and existing partners in 2020–21. These partnerships will continue to grow as the country moves beyond pandemic response towards recovery.
Sharing data for effective pandemic response
In December 2020, Statistics Canada established a partnership with Children First Canada, a nationwide alliance of organizations that advocates on behalf of children and their well-being. The goal was to use data to mitigate the negative impacts of pandemic restrictions, such as school closures, on children and youth. As a result of a hackathon, more than 300 stakeholders provided feedback on a decision-support tool developed by Statistics Canada, which incorporated interactive maps and data broken down, wherever possible, at the level of local health regions. As a result of this collaboration, Statistics Canada released a new tool in March 2021 called School Closures and COVID-19: Interactive Tool. The goal of this tool is to give policy makers a better understanding of children and youth's vulnerabilities as they evaluate ways to improve the lives of children and their families during the COVID-19 pandemic.
"Through partnerships and innovative collaboration, Statistics Canada is playing a prominent role in helping the country better understand the impacts of the COVID-19 pandemic and enabling leaders to make more timely evidence-based decisions that will improve the lives of the nation's children and their families."
Creating and sharing data through partnerships
In collaboration with Natural Resources Canada, Environment and Climate Change Canada and the Canada Energy Regulator, the agency developed the Canadian Centre for Energy Information (CCEI), a one-stop shop for energy information in Canada that aims to make it more convenient for users to access all of Statistics Canada's data holdings about this key sector of the economy. The CCEI website was launched in October 2020 with an initial offering of more than 500 datasets from over 50 different sources from across Canada. Statistics Canada is also working with partners to develop national energy standards for the CCEI that will enable better data integration and the development of richer data-driven insights.
The Government of Canada and its partners are committed to using better data to drive better outcomes for residents of remote and northern communities. In collaboration with its territorial counterparts and Indigenous organizations, Statistics Canada has launched the planning and coordination work needed to develop and implement the Northern Data Strategy. This project addresses the unique challenges of collecting timely, relevant and accurate data in regions with small populations spread across vast areas of geography, which result in data gaps and high collection costs. The goal of this project is to provide northern residents with the data they need to achieve better outcomes related to health, housing, food security, energy and the environment.
Statistics Canada and the Labour Market Information Council are collaborating to identify data gaps, while enhancing the availability of Canadian labour market information. This partnership, which is focused on generating more local and granular data, has resulted in a pilot project conducted by Statistics Canada to produce more local labour market indicators using small-area estimations.
Statistics Canada has partnered with Employment and Social Development Canada to acquire data on the characteristics of Canadians who received the emergency income benefits established by the Government of Canada during the pandemic. The analysis of these data, which were linked with data from other sources, such as census, tax and immigration data, will help federal officials better understand the uptake and impact of these programs, particularly among members of marginalized and racialized groups.
In July 2020, Statistics Canada and the Canadian Association of Chiefs of Police announced a partnership to address the growing demand among equity-seeking groups for disaggregated data about the experiences of Indigenous people and racialized Canadians with law enforcement agencies. To date, this project has resulted in
an engagement strategy to work with a broad range of stakeholders, including Indigenous and ethnocultural groups; police services; academics; and federal, provincial and territorial governments to identify appropriate approaches for data collection
consultations with police services and provincial and territorial governments
meetings with the Director General of the Federal Advisory Committee on the Disaggregation of Justice and Community Safety Statistics, who is mandated to provide the Government of Canada with advice on the implementation of this and other initiatives.
Accelerate the development of industry-wide data governance standardization strategies
The agency has been contributing to the establishment of a robust and reliable set of standardization strategies for Canadian data governance, which requires close collaboration among the government, private industry and broader civil society. Statistics Canada has co-chaired the Canadian Data Governance Standardization Collaborative (DGSC) since 2019. Through the leadership of all players, including Statistics Canada, the DGSC is in position to deliver the first roadmap to ensure Canadians and their businesses prosper in this new and rapidly evolving global environment.
Making a difference on the world stage
As a member of more than 190 statistical groups, Statistics Canada is a world leader in upholding the rigorous standards set by international statistical organizations. This compliance means the agency not only produces data based on the highest standards, it also conforms to common standards that enable data to be shared internationally and benchmarked against other countries.
The Chief Statistician of Canada chairs some of the most influential groups where global statistical issues are discussed. These groups include the High-Level Group for the Modernisation of Official Statistics, the Conference of European Statisticians, the United Nations Statistical Commission Friends of the Chair Group on Economic Statistics, and the Organisation for Economic Co-operation and Development Committee on Statistics and Statistical Policy. To fulfill its obligations as a global statistical leader, Statistics Canada takes a focused, collaborative and progressive approach to engaging internationally.
As a world-class national statistical office, Statistics Canada led the development of international best practices around privacy and data ethics in 2020–21. In collaboration with the Privacy Commissioner of Canada, the agency implemented a ground-breaking ethical framework based on the principles of necessity and proportionality. The goal is to enhance trust and transparency with Canadians by ensuring that Statistics Canada collects only the information that is necessary to produce timely, high-quality data, while fully protecting the privacy of Canadians and keeping the data it collects safe.
National statistical offices have entered a new era of openness. In a digital and data-driven world, the move towards open data and open science is driving demand for more granular data to support user needs. In 2020–21, Statistics Canada brought together more than 40 international experts to establish common approaches for creating and using synthetic data for statistics. A hands-on guide will be published in 2021 and made broadly available to increase the capacity of users to apply effective data stewardship practices.
In addition, Statistics Canada and Statistics New Zealand have formed a partnership to promote data stewardship, which includes the responsible collection, use and dissemination of data. This collaboration has resulted in a metadata solution that both agencies currently use and that has the potential to be used internationally. This partnership has also inspired the foundation to offer Reference Data as a Service around data standards, with a pilot project being conducted with Employment and Social Development Canada. Additionally, the two agencies are working together as part of a task force on developing interactive and digitally enabled statistical standards for economic statistics and classifications.
2030 Agenda for Sustainable Development
In 2020–21, Statistics Canada continued to report on Canada's progress in fulfilling the United Nations Sustainable Development Goals. As part of the results reported in the Sustainable Development Goals Data Hub, the agency produced 17 fact sheets that tracked the country's progress on those goals. Within Canada, the agency collaborated with other federal departments and agencies to finalize an outcome-based set of indicators for the Canadian Indicator Framework, which measures Canada's 2030 ambitions for social and economic development for a cleaner, fairer and more inclusive nation.
Increased data access for pandemic response
In 2020–21, Statistics Canada collaborated with university researchers and public health officials, resulting in increased access to data, which enabled them to produce the data-driven insights needed to guide and shape the pandemic response for the benefit of Canadians. Examples include the following:
Researchers at the University of British Columbia and the Université du Québec à Montréal used Statistics Canada data to produce insights about the economic impacts of public health measures, which enabled provincial governments to develop risk-based models that guided decisions on the pandemic response.
Researchers at the University of Toronto used Statistics Canada data to analyze patterns in the ways Canadians adopted public health measures, such as physical distancing.
Researchers at the University of Ottawa and University of Toronto used Statistics Canada data to assess the impacts of COVID-19 on labour force statistics.
Researchers at Western University used Statistics Canada data to compare the participation of different genders in the labour force during the pandemic.
Officials at the Public Health Agency of Canada used Statistics Canada data to measure COVID-19 vaccination coverage across the country and compare vaccination coverage levels among different population groups.
Designing a modern and flexible workplace
Statistics Canada awards in 2020–21
Canada's Top 100 Employers for 2020
Canada's Best Diversity Employers for 2021
National Capital Region's Top Employers for 2021
Canada's Top Employers for Young People for 2021
In 2020–21, Statistics Canada responded to the COVID-19 pandemic by fast-tracking initiatives that were already underway to enable its employees to work remotely, securely and safely. The agency also adapted its mental health and well-being supports to help staff cope with the psychosocial impacts of the pandemic.
To support the Government of Canada's priority of developing a public service that is responsive to the needs of all the people of Canada, Statistics Canada continued to make progress in its goal to build a workforce that reflects the diversity of Canada's population. That means developing a workforce that reflects the wide-ranging experience, knowledge and skill sets of different communities—the hallmarks of an agile and innovation-focused organization. That is why, in 2020–21, Statistics Canada continued to refine its comprehensive human resources plan to promote representation and advancement in the workplace of women, Indigenous people, members of groups designated as visible minorities and people living with disabilities.
Promoting employees' well-being during COVID-19
Because Statistics Canada's greatest asset is its dedicated and high-performing workforce, mental health and well-being were a high priority during the pandemic. While working remotely, many employees found themselves feeling isolated, or facing the additional pressures of juggling family responsibilities during extended shutdowns of schools and businesses. The following mental health and wellness services were modified to meet the needs of employees during the pandemic:
Nearly 100 virtual sessions on mental wellness were conducted, which were accessed by about 3,000 participants—more than half of Statistics Canada's workforce.
Virtual focus groups and town halls were organized to enable senior management to engage in an ongoing dialogue with staff.
New web content, such as Tales from the Home Front, was created on Statistics Canada's employee communications portal to encourage staff to share their stories and experiences about working and living through the pandemic.
Regular communication and tools to promote mental health and well-being were provided to all staff.
Employee-focused videos were launched on YouTube to tell stories about ways Statistics Canada staff were innovating.
In partnership with other federal departments and agencies, Statistics Canada initiated a process of integrating and analyzing internal data to better understand how employees' mental health and well-being were being affected by the pandemic. This initiative enabled the agency to better understand the experiences and needs of various employees, resulting in the proactive development of activities to foster a psychologically healthy and safe work environment.
Building a diverse workforce
In 2020–21, Statistics Canada was named one of Canada's Best Diversity Employers as publicized in The Globe and Mail. This accolade recognizes employers with an exceptional commitment to workplace diversity and inclusion, including successful initiatives aimed at improving the workplace experiences of employees from five groups: women, members of groups designated as visible minorities, people with disabilities, Indigenous people, and LGBTQ2+ individuals.
Description - Employees at Statistics Canada
Women: 3,237 (55%)
Visible minorities: 1,179 (20%)
Persons with disabilities: 311 (5%)
Aboriginal People: 141 (2.4%)
French as first official language: 2,029 (31.9%)
Students: 239 (3.7%)
Statistics Canada was praised for the following initiatives:
a multi-year employment equity and diversity action plan dedicated to fostering a work environment that treats employees equitably and a workforce that reflects the diversity of Canada's population
an advisory group that supports the recruitment, retention and advancement of more Indigenous people and the promotion among Statistics Canada employees of issues related to First Nations people, Inuit and Métis
a network of employees, managers and executives who take action to support a diverse and inclusive workplace, with separate groups dedicated to the advancement of women, people with disabilities, employees belonging to groups designated as visible minorities, and Indigenous people.
Equipping employees to work during COVID-19
Early in the pandemic, more than 7,500 employees transitioned to remote work, virtually overnight. These swift and decisive actions ensured that Canadians continued to benefit from the agency's statistical programs, which remained fully operational.
To support large-scale remote work, the agency strengthened its secure digital infrastructure to protect the data collected on behalf of Canadians. The agency also continued to deploy new information technology equipment designed to
improve the speed and capacity of the agency's network
enable employees to access virtual desktops through cloud computing services
strengthen information management practices and controls.
Move to cloud computing to improve service delivery
In 2020–21, Statistics Canada spearheaded the Government of Canada's efforts to move towards cloud-based computing solutions. In a digital and data-driven world, the adoption of secure cloud-based technologies has enabled Statistics Canada's employees to better integrate and analyze its vast data holdings.
Using advanced high-throughput tools, volumes of data that were once too expensive to be unlocked from the agency's vaults can now be amalgamated and analyzed in unexpected ways. These powerful tools can extract insight from small, seemingly disconnected, datasets and generate actionable insights that result in a richer, more dynamic statistical portrait of Canada.
Making Beyond2020 progress
In 2020–21, the Government of Canada launched Beyond2020, its public service renewal plan, with the goal of developing a public service that is more agile and responsive to the evolving needs of the Canadians it serves. To that end, Statistics Canada focused on improving the data literacy and problem-solving skills of its employees, expanding partnerships within and outside the Government of Canada, managing risks related to the agency's core responsibilities through enhanced governance, and investing in its employees to develop a culture of continuous improvement and innovation.
Mitigating risk and improving business planning
Across the agency, employees worked hard to deliver results for Canadians during COVID-19, while proactively deploying risk management practices to address
the urgent data needs of users
data breaches
the use of alternative data sources in ways that promote public trust
the accuracy of key statistics
the digital and organizational transformation required to meet the expectations of various data users.
Specific initiatives to identify and mitigate any risks associated with modernizing the agency's operations included the creation of a new Governance, Risk and Compliance Division; the implementation of the Statistical Program and Analysis Committee; and a comprehensive revision of Statistics Canada's Policy on Official Release to be more relevant in a digital and data-driven world.
The agency continues to improve its business planning processes to ensure they are aligned with government priorities and to ensure Statistics Canada provides value for Canadians.
Results achieved
Statistics Canada's 2020–21 results were largely shaped by the COVID-19 pandemic. Given that speed was of the essence in an effective response, the agency rapidly adapted by using leading-edge technologies, tools and methods to provide Canadians with the timely, high-quality data they needed to see opportunities and challenges sooner and act faster.
Of the 11 corporate performance indicators established by Statistics Canada for 2020–21, the agency achieved 9 of the targets and significantly exceeded those targets on four indicators. Heading into the 2021–22 fiscal year, the agency continues to integrate performance information into its decision-making processes to ensure that value is created for Canadians and resources are aligned with government priorities.
Results achieved
Departmental results
Performance indicators
Target
Date to achieve target
2018–19 Actual results
2019–20 Actual results
2020–21 Actual results
Statistical information is of high quality
Number of post-release corrections due to accuracy
Percentage of users satisfied with statistical information
80%
March 31, 2021
80%
80%
80%
Table note 1
Overall 5 of the 6 corrections occurred during the first 5 months of the fiscal year which represents the early period of the COVID-19 pandemic. The 6 post-release corrections were as follows:
Labour Force Survey (April 2020): i) the percentage of household that reported financial difficulty which had applied to Canada Emergency Response Benefit (CERB) or Employment Insurance (EI) benefits was changed from 21.4% to 29.3% ii) the percentage of household that reported it was easy to meet financial obligations which had applied to CERB or EI benefits was changed from 9.8% to 13.9%.
Quarterly financial statistics for enterprises (First Quarter 2020): The reported net income before taxes of Canadian corporations in the first quarter (seasonally adjusted) was changed from $74.3 billion to $74.4 billion.
Gross Domestic Product by Industry (May 2020): The retail growth rate was changed from 16.4% to 16.6% and the transportation and warehousing sector growth rate was changed from 1.7% to 2.1%.
Retail Trade (June 2020): The percentage of e-commerce sales over total retail trade (unadjusted) was changed from 5.4% to 5.5%.
Labour Force Survey (July 2020): The number of Canadians who work from home was changed from 4.6 million to 4.1 million.
Retail Trade (August 2020): The percentage increase of retail sales in volume terms in August 2020 was changed from 0.5% to 0.4%.
The 2020–21 targets did not take into account the unforeseen impact of COVID-19. In 2020, the agency responded to the demand for an evidence-based response to COVID-19 by releasing and promoting numerous new and timely statistical products, which were well received by Canadians. This resulted in a significant increase in the number of visits to the website, interactions on social media, media citations and journal citations.
In early 2021, the agency experienced higher than expected interest in the census awareness and recruitment campaigns, which resulted in an increase in the number of visits to the website and interactions on social media.
Since the beginning of 2018, some social media platforms have been using new methodologies to tailor content delivery to fewer audience members. The target for 2020–21 was set in consideration of these new methodologies.
Statistics Canada had more interactions on social media as significant efforts were made during fiscal year 2019–20 to increase visibility of the agency's social media content and leverage partnerships with other government departments and agencies and key stakeholders for amplification.
In the 2019–20 Departmental Results Report, the published 2019–20 result for the indicator is 38,042, but should have been 37,254. An erratum is being processed to reflect the updated result and ensure that the public has access to the corrected information.
Since April 2019, media citations have declined. This is typical of years when no new census data are collected or disseminated. Following the election in fall 2019, political issues dominated national coverage. While agency data are sometimes cited in related news reports, a decrease in media citations was nevertheless observed. The target for 2020–21 was lowered in consideration of these factors.
The target for 2018–19 was exceeded. Beginning in October 2018, a single significant media story about Statistics Canada contributed to a significant one-time boost of about 2,000 articles in the first six months.
Statistics Canada media citations are generated from the publication of data released through the agency's official channel, The Daily, and through responses to media inquiries and interviews. During the 2019–20 period, the national general election dominated much of the daily news coverage, and the deployment of the Government of Canada's caretaker convention, which restricts activities of government departments and agencies, reduced the agency's data publishing and promotion activities. For these reasons, there were fewer media citations during this period than anticipated.
Statistics Canada had more journal citations for fiscal year 2019–20, as the number of current authors tracked through the collection tool (Google Scholar) increased. There were also a few articles that gathered an unusually high number of citations, which contributed to exceeding the target.
2020–21 Difference (Actual spending minus Planned spending)
Gross Expenditures
661,506,812
661,506,812
715,298,954
666,463,788
4,956,976
Respendable Revenue
-120,000,000
-120,000,000
-123,989,068
-123,989,068
-3,989,068
Net Expenditures
541,506,812
541,506,812
591,309,886
542,474,720
967,908
Human resources (full-time equivalents)
2020–21 Planned full-time equivalents
2020–21 Actual full-time equivalents
2020–21 Difference (Actual full-time equivalents minus Planned full-time equivalents)
Gross expenditures
5,800
6,099
299
Respendable Revenue
-1,251
-1,340
-89
Net Expenditures
4,549
4,759
210
The difference between planned spending and actual spending is the result of an increase in resources to support data management for a new initiative from the Safe Restart Agreement, a Government of Canada COVID-19 response measure. Also contributing are salary price increases and retroactive pay from the ratification of new collective agreements.
The increases are mostly offset by budget carried forward to 2021–22, allowing the agency to meet the needs of its cyclical programs and to invest in its integrated strategic plans. There were also amendments to the 2021 Census of Population's original spending plan, resulting in a decrease in spending for 2020–21.
Furthermore, full-time equivalents vary slightly as a result of differences between the actual salary rates paid and the estimated average salary rates used to forecast planned spending.
Financial, human resources and performance information for Statistics Canada's Program Inventory is available in GC InfoBase.
Internal Services
Description
Internal Services are those groups of related activities and resources that the federal government considers to be services in support of programs and/or required to meet corporate obligations of an organization. Internal Services refers to the activities and resources of the 10 distinct service categories that support Program delivery in the organization, regardless of the Internal Services delivery model in a department. The 10 service categories are:
Acquisition Management Services
Communication Services
Financial Management Services
Human Resources Management Services
Information Management Services
Information Technology Services
Legal Services
Material Management Services
Management and Oversight Services
Real Property Management Services
All of Statistics Canada's Internal Services have been engaged with the agency's modernization agenda and have become more efficient and user-centric. Internal Services also strengthened and modernized the agency's recruitment process to ensure the agency has an inclusive and diverse workplace. Statistics Canada enhanced data analytics within its Internal Services to provide rapid and direct insight into the health of the agency.
Rethinking recruitment
Statistics Canada is committed to becoming a diverse and inclusive workplace, starting with the recruitment process. The agency delivered a guide to managers and human resources (HR) advisors covering topics to consider while hiring, such as addressing unconscious bias, looking for barriers and building more inclusive statement of merit criteria. Training was then provided to HR advisors and middle managers, and a practical guide was issued.
Steps were put in place to encourage candidates to select examples from personal experience to illustrate how they meet selection criteria, rather than examples strictly from their work experience. This shift creates a more inclusive recruitment process, as it allows individuals who may have a gap in their résumé—perhaps because of childcare, health concerns or other personal factors—to apply based on personal experience. Not only was this step adopted in the interview process, but it was communicated through posters, exams and questions around the preselection, interview and reference processes. In addition, the agency developed mandatory messaging to go on all staffing posts and is adding a link on self-declaration to internal staff communications.
The agency continues to source and develop training, resources and tools to foster an inclusive recruitment process. Statistics Canada began participating in hiring initiatives such as working with the Public Service Commission to create a pool of qualified analysts and data production and dissemination candidates who self-declare as people with disabilities, and signed the pledge to use the new Federal Internship Program for Canadians with Disabilities. Additionally, a new employment equity dashboard was developed, which provides managers with better data and a more comprehensive picture of their hiring and retention needs.
Nurturing diversity and inclusion in the workplace
Statistics Canada is committed to becoming an inclusive and diverse workplace and to ensuring that all employees receive proper training and support in these areas. The agency launched a diversity and inclusion toolbox in July 2020 to provide employees with resources to become powerful allies to members of traditionally marginalized groups. This toolbox is under regular review to ensure that no group is left out.
Equity, diversity and inclusion
Statistics Canada developed its Equity, Diversity and Inclusion (EDI) Action Plan, which focuses on both the short- and long-term action items for 2021 to 2025. Focus groups were organized in 2020–21 to create a platform that provided marginalized employees with a voice to inform the agency's actions to eliminate racism, strengthen equity, and build greater diversity and inclusion at Statistics Canada. Results from the focus groups led to actions and solutions that were included in the EDI Action Plan, which will continue to be updated regularly. This is foundational work that the agency will continue to build upon.
Employee equity champions and committees have clearly established roles and responsibilities and an accountability framework. The agency is currently working with the Office of the Chief Human Resources Officer to develop a measurement index for diversity and inclusion. Additionally, a diversity forum meets regularly to provide updates and discuss the way forward.
Diversity and inclusion are regularly discussed with employees—both in corporate and in work-level communications. Since June 2020, the agency has published a series of articles highlighting the work of employee equity champions and the impact this has on a more inclusive workplace. Furthermore, Statistics Canada participated in a number of events in 2020–21 to support its journey towards becoming a more diverse and inclusive agency:
The agency hosted a gathering during Black History Month to discuss data-driven insights on Black communities in Canada and published an article in an agency newsletter on systemic racism.
Statistics Canada celebrated International Women's Day with a video montage, a presentation on being an ally and challenging gender-based violence, and an article on intersectional feminism.
The agency marked National AccessAbility Week with a series of articles in collaboration with Accessibility Standards Canada, Shared Services Canada, the Public Service Commission and the Canada School of Public Service. It is also working to increase Canadians' awareness of the International Day of Persons with Disabilities.
Evaluating accessibility
Statistics Canada is participating in the Office of Public Service Accessibility's (OPSA) interdepartmental working group for the measurement of accessible information and communications technology. It is also leading another working group in developing an accessibility culture measurement index. In January 2021, the agency launched a task force with the goals of building a measurement index to record its progress towards the goals established by OPSA and becoming a leader in accessibility by establishing a plan to foster diversity, inclusion and innovation through active engagement with all stakeholders.
Supporting staff during the pandemic
To help Statistics Canada's employees stay connected and remain efficient while working from home, the agency launched YouTube videos under the new StatCan Innovation channel in April 2020. In addition, the agency introduced Lean at home videos, which served as check-in sessions to ensure that employees felt supported during the pandemic.
Measuring performance
The Audit and Evaluation Branch provides management with trusted, objective data to inform decision making. In 2020–21, the branch adopted an increasingly agile and focused approach to its audits and evaluations, providing timely insight and advice to support the agency's top priorities. This information was delivered at times of critical uncertainty in the early stages of the pandemic and has since supported the implementation of new strategies and initiatives. It also supplemented the robust mitigation strategies for the 2021 Census.
Budgetary financial resources (dollars)
2020–21 Main Estimates
2020–21 Planned spending
2020–21 Total authorities available for use
2020–21 Actual spending (authorities used)
2020–21 Difference (Actual spending minus Planned spending)
73,941,885
73,941,885
80,666,297
78,844,148
4,902,263
Human resources (full-time equivalents)
2020–21 Planned full-time equivalents
2020–21 Actual full-time equivalents
2020–21 Difference (Actual full-time equivalents minus Planned full-time equivalents)
585
684
99
The difference between planned spending and actual spending is mainly related to an increase in resources for an initiative, approved in 2018–19, to migrate the agency's infrastructure to the cloud and additional spending related to internal information technology support.
The survey series Portrait of Canadian Society (PCS) is a new Statistics Canada initiative. It is a probabilistic web panel that involves asking the same group of participants to complete four brief online surveys over a one-year period. For now, this is an experimental project which is part of a larger effort to modernize our data collection methods and activities. The goal is to collect important data on Canadian society more efficiently, more rapidly and at a lower cost compared to traditional survey methods. We will be able to test this collection method and refine it over time.
The experimental nature of this project and its high degree of non-response have an impact on which estimates should be produced using the web panel. Survey weights were adjusted to minimise potential bias that could arise from panel non-response; non-response adjustments and calibration using available auxiliary information were applied and are reflected in the survey weights provided with the data file. Despite these adjustments, the high degree of non-response to the panel increases the risk of remaining bias, which may impact estimates produced using the panel data. More information about the weighting methods used to adjust for non-response can be found in Section 5. Data quality guidelines and considerations are outlined in Section 6.
Each survey in the series is administered to a sub-sample of General Social Survey - Social Identity (GSS-SI) respondents who agreed to participate in additional surveys when completing the GSS-SI.
From July 19 to August 1, 2021, Statistics Canada conducted the Portrait of Canadian Society: Experiences During the Pandemic (PCS-EP). This survey was the second wave of the PCS.
The purpose of this survey is to help us better understand various aspects of Canadian's life during the pandemic, including access to health care services, perceptions of safety and community. The PCS is designed to produce data at a national level.
This manual has been produced to facilitate the manipulation of the microdata file of the PCS-EP survey results.
Any questions about the data set or its use should be directed to:
Statistics Canada
Client Services
Centre for Social Data Integration and Development
Telephone: 613-951-3321 or call toll-free 1-800-461-9050
Fax: 613-951-4527
E-mail: csdid-info-cidds@canada.ca
2.0 Survey methodology
2.1 Target and survey population
The PCS-EP is a sample survey with a cross-sectional design. Each survey in the series is administered to a sub-sample of General Social Survey - Social Identity (GSS-SI) respondents who agreed to participate in additional surveys when completing the GSS-SI.
The target population for the Portrait of Canadian Society (PCS) is the same as that of the GSS-SI, The target population includes all persons 15 years of age and older in Canada, excluding:
Residents of Yukon, the Northwest Territories, and Nunavut;
Full-time residents of institutions;
Residents of reserves.
The frame used for GSS-SI, as well as the sampling strategy, are described in section 5 of the 2020 GSS-SI User Guide.
2.2 Sample Design and Size
To recruit the sample for Portrait of Canadian Society (PCS), recruitment questions were added at the end of General Social Survey – Social Identity (GSS-SI). Approximately 22% of GSS-SI respondents agreed to be approached for future surveys. They formed the sample for PCS.
The table below provides the number of respondents at each stage of the PCS-EP design.
Stages of the Sample
n
Dwellings selected for GSS-SI.
86,804
Individuals who responded to GSS-SI
34,044
Individuals who agreed to be approached for further surveys
7,502
Raw sample for surveys of the PCS
7,502
Panelists who participated in PCS-EP
3,330
The table below provides the number of respondents for PCS-EP by region, age group, and sex.
Area
Domain
n
Geography
Canada
3,330
Atlantic provinces
502
Quebec
635
Ontario
1,125
Prairies
645
British-Columbia
423
Age Group
All
3,330
15-24
131
25-34
459
35-44
699
45-54
671
55-64
621
65-74
558
75+
191
Sex
All
3,330
Male
1,720
Female
1,610
3.0 Data collection
PCS: Recruitment
The recruitment for PCS was done by adding two recruitment questions at the end of the GSS-SI questionnaire. GSS-SI was administered from August 17, 2020 to February 8, 2021. The first question asked if respondents would like to participate in a series of short, 15-20 minute surveys about important social topics. The respondents who answered "yes" to this question were asked to provide their email address and cellular phone number. This sub-sample of GSS-SI formed the sample for PCS.
PCS-EP – Experiences During the Pandemic
All respondents from GSS-SI who answered "yes" to the recruitment questions were sent an email invitation with a link to the PCS-EP and a Secure Access Code (SAC) to complete the survey online. Collection for the survey began July 19th, 2021.
There were two collection strategies for PCS-EP. The sample was divided into two groups and each group was part of one of the two collection strategies. All potential respondents were sent the invitation email on July 19th. For the first group, the reminder emails were sent on July 20th, July 22nd and July 24th. For the second group, the reminder emails were sent on July 22nd, July 26th, and July 29th. The application remained open until August 1, 2021.
Record Linkage:
To enhance the data from PCS-EP and reduce the response burden, information provided by respondents was combined with information from the General Social Survey - Social Identity. The GSS-SI is the source of socio-demographic variables available on the PCS-EP.
3.1 Disclosure control
Statistics Canada is prohibited by law from releasing any data which would divulge information obtained under the Statistics Act that relates to any identifiable person, business or organization without the prior knowledge or the consent in writing of that person, business or organization. Various confidentiality rules are applied to all data that are released or published to prevent the publication or disclosure of any information deemed confidential. If necessary, data is suppressed to prevent direct or residual disclosure of identifiable data.
4.0 Data quality
Survey errors come from a variety of different sources. They can be classified into two main categories: non-sampling errors and sampling errors.
4.1 Non-sampling errors
Non-sampling errors can be defined as errors arising during the course of virtually all survey activities, apart from sampling. They are present in both sample surveys and censuses (unlike sampling error, which is only present in sample surveys). Non-sampling errors arise primarily from the following sources: non-response, coverage, measurement and processing.
4.1.1 Non-response
Non-response is both a source of non-sampling error and sampling error. Non-response result from a failure to collect complete information from all units in the selected sample. Non-response is a source of non-sampling error in the sense that non-respondents often have different characteristics from respondents, which can result in biased survey estimates if non-response bias is not fully eliminated through weighting adjustments. The lower the response rate, the higher the risk of bias. Non-response is also a source of sampling error; this is discussed further in Section 6.2.
The PCS-EP survey design is carried out in multiple stages, each of which results in some non-response. The table below summarizes the response rate at each of these stages and the resulting cumulative response rate for PCS-EP.
Survey stage
Number of respondents
Response rate
GSS-SI
34,044
40.3%
Opt-in to additional surveys among GSS-SI respondents
7,502
22.0%
Response to PCS-EP among panel participants
3,330
44.4%
Cumulative response rate
3.8%
4.1.2 Coverage errors
Coverage errors consist of omissions, erroneous inclusions, duplications and misclassifications of units in the survey frame. Since they affect every estimate produced by the survey, they are one of the most important types of error. Coverage errors may cause a bias in the estimates and the effect can vary for different sub-groups of the population. This is a very difficult error to measure or quantify accurately.
The PCS-EP data is collected from people aged 15 years and over living in private dwellings within the 10 provinces. Excluded from the survey's coverage are: residents of Yukon, the Northwest Territories, and Nunavut; full-time residents of institutions, and residents of reserves. These groups together represent an exclusion of less than 2% of the Canadian population aged 15 and over.
Since PCS-EP uses the GSS-SI sample and was collected from July 19 to August 1, 2021, there is an undercoverage of residents of the 10 provinces that turned 15 since August 17, 2020, the beginning of GSS-SI collection. There is also undercoverage of those without internet access, since PCS-EP was collected entirely online. This undercoverage is greater amongst those age 65 years and older.
4.1.3 Measurement errors
Measurement errors (or sometimes referred to as response errors) occur when the response provided differs from the real value; such errors may be attributable to the respondent, the questionnaire, the collection method or the respondent's record-keeping system. Such errors may be random or they may result in a systematic bias if they are not random.
4.1.4 Processing errors
Processing errors are the errors associated with activities conducted once survey responses have been received. They include all data handling activities after collection and prior to estimation. Like all other errors, they can be random in nature, and inflate the variance of the survey's estimates, or systematic, and introduce bias. It is difficult to obtain direct measures of processing errors and their impact on data quality especially since they are mixed in with other types of errors (nonresponse, measurement and coverage).
4.2 Sampling errors
Sampling error is defined as the error that results from estimating a population characteristic by measuring a portion of the population rather than the entire population. For probability sample surveys, methods exist to calculate sampling error. These methods derive directly from the sample design and method of estimation used by the survey.
The most commonly used measure to quantify sampling error is sampling variance. Sampling variance measures the extent to which the estimate of a characteristic from different possible samples of the same size and the same design differ from one another. For sample designs that use probability sampling, the magnitude of an estimate's sampling variance can be estimated.
Factors affecting the magnitude of the sampling variance include:
The variability of the characteristic of interest in the population: the more variable the characteristic in the population, the larger the sampling variance.
The size of the population: in general, the size of the population only has an impact on the sampling variance for small to moderate sized populations.
The response rate: the sampling variance increases as the sample size decreases. Since non-respondents effectively decrease the size of the sample, non-response increases the sampling variance.
The sample design and method of estimation: some sample designs are more efficient than others in the sense that, for the same sample size and method of estimation, one design can lead to smaller sampling variance than another.
The standard error of an estimator is the square root of its sampling variance. This measure provides an indication of sampling error using the same scale as the estimate whereas the variance is based on squared differences.
The coefficient of variation (CV) of an estimate is a relative measure of the sampling error. It is defined as the estimate of the standard error divided by the estimate itself. It is very useful for measuring and comparing the sampling error of quantitative variables with large positive values. However, it is not recommended for estimates such as proportions, estimates of change or differences, and variables that can have negative values.
It is considered a best practice at Statistics Canada to report the sampling error of an estimate through its 95% confidence interval. The 95% confidence interval of an estimate means that if the survey were repeated over and over again, , the confidence interval would cover the true population value 95% of the time (or 19 times out of 20).
5.0 Weighting
The principle behind estimation in a probability sample is that each unit selected in the sample represents, besides itself, other units that were not selected in the sample. For example, if a simple random sample of size 100 is selected from a population of size 5,000, then each unit in the sample represents 50 units in the population. The number of units represented by a unit in the sample is called the survey weight of the sampled unit.
The weighting phase is a step that calculates, for each person, an associated sampling weight. This weight appears on the microdata file, and must be used to derive estimates representative of the target population from the survey. For example, if the number of individuals who smoke daily is to be estimated, it is done by selecting the records referring to those individuals in the sample having that characteristic and summing the weights entered on those records. The weighting phase is a step which calculates, for each record, what this number is. This section provides the details of the method used to calculate sampling weights for the PCS-EP.
The weighting of the sample for the PCS-EP has multiple stages to reflect the stages of sampling, participation and response to get the final set of respondents. The following sections cover the weighting steps to create the survey weights for PCS-EP.
5.1 Design weights
The initial panel weights are the final calibrated GSS-SI weights. These are the GSS-SI design weights adjusted for out-of-scope units and GSS-SI nonresponse, and then calibrated to population control totals. More information on these weights is available in section 8.1 of the GSS-SI user guide.
5.2 Nonresponse/Nonparticipation Adjustment
During collection of the PCS-EP, responses are obtained only from a proportion of sampled units. Individuals who responded to GSS-SI may decide not to opt-in to additional surveys and therefore not participate in the panel. Additionally, some individuals who opted into the panel, do not respond during PCS-EP collection. Weights of the nonresponding and nonparticipating units were redistributed to participating units. Units that did not participate in the panel had their weights redistributed to the participating units with similar characteristics within response homogeneity groups (RHGs).
The variables available for building the RHGs were available for both responding and non-responding units. These included personal characteristics (such as age, gender, education, population group, sexual orientation, employment information, voting behaviour, and personal income), household characteristics (such as home ownership and household income), and variables related to GSS-SI collection (such as the month of GSS response and whether response was online or interviewer-assisted). An adjustment factor was calculated within each response group as follows:
[ Sum of weights of respondents and nonrespondents / Sum of weights of respondents ]
The weights of the respondents were multiplied by this factor to produce the non-response adjusted weights. The nonparticipating units were dropped from the weighting process at this point.
5.3 Calibration
Control totals were computed using demography projection data. During calibration, an adjustment factor is calculated and applied to the survey weights. This adjustment is made such that the weighted sums match the control totals. Three sets of population control totals were used for PCS-EP:
Geographic region, age group, and sex. The geography and age groupings selected for calibration took into account the sometimes small number of respondents in different categories. The five geographic regions used for calibration were the Atlantic Provinces, Quebec, Ontario, the Prairie Provinces, and British Columbia. The age groups used were 15-34 year olds, 35-64 year olds, and those aged 65 years or more.
Sub-regional geographies. Respondent weights were also calibrated so that the sum within each province, as well as within the CMAs of Montreal, Toronto, and Vancouver, match population control in those sub-regional geographies.
Age group at a national level. Respondent weights were calibrated to population totals (nationally) within more granular age groupings. These groupings were defined as 15-24 year olds, 25-34 year olds, etc. up to respondents aged 75 years or more.
5.4 Bootstrap weights
Bootstrap weights were generated for the PCS-EP survey respondents. Each bootstrap replicate was generated based on the initial PCS-EP design weights, and then adjusted for non-response and calibrated as described above.
6.0 Guidelines for tabulation, analysis and release
This chapter of the documentation outlines the guidelines to be adhered to by users tabulating, analyzing, publishing or otherwise releasing any data derived from the survey microdata files. With the aid of these guidelines, users of microdata should be able to produce the same figures as those produced by Statistics Canada and, at the same time, will be able to develop currently unpublished figures in a manner consistent with these established guidelines.
6.1 Rounding guidelines
Users are urged to adhere to the following rounding guidelines when producing estimates and statistical tables computed from these microdata files:
Estimates in the main body of a statistical table are to be rounded using the normal rounding technique. In normal rounding, if the first or only digit to be dropped is 0 to 4, the last digit to be retained is not changed. If the first or only digit to be dropped is 5 to 9, the last digit to be retained is raised by one.
Marginal sub-totals and totals in statistical tables are to be derived from their corresponding unrounded components and then are to be rounded themselves using normal rounding. Averages, rates, percentages, proportions and ratios are to be computed from unrounded components (i.e. numerators and/or denominators) and then are to be rounded themselves using normal rounding. Sums and differences are to be derived from their corresponding unrounded components and then are to be rounded themselves using normal rounding.
In instances where, due to technical or other limitations, a rounding technique other than normal rounding is used resulting in estimates to be published or otherwise released which differ from corresponding estimates published by Statistics Canada, users are urged to note the reason for such differences in the publication or release document(s).
Under no circumstances are unrounded estimates to be published or otherwise released by users. Unrounded estimates imply greater precision than actually exists.
6.2 Sample weighting guidelines for tabulation
The PCS-EP uses a complex sample design and estimation method, and the survey weights are therefore not equal for all the sampled units. When producing estimates and statistical tables, users must apply the proper survey weights. If proper weights are not used, the estimates derived from the microdata files cannot be considered to be representative of the survey population, and will not correspond to those produced by Statistics Canada.
6.3 Release guidelines for quality
Before releasing and/or publishing any estimates, analysts should consider the quality level of the estimate. Given the experimental nature of the PCS-EP and its high degree of non-response, all estimates produced using the web panel should be accompanied by a quality warning to use the estimates with caution.
While data quality is affected by both sampling and non-sampling errors, this section covers quality in terms of sampling error. It is considered a best practice at Statistics Canada to report the sampling error of an estimate through its 95% confidence interval (CI). The confidence interval should be released with the estimate, in the same table as the estimate. In addition to the confidence intervals, PCS-EP estimates are categorized into one of two release categories:
Category E
The estimate and confidence interval should be flagged with the letter E (or some similar identifier) and accompanied by a quality warning to use the estimate with caution. Data users should use the 95% confidence interval to assess whether the quality of the estimate is sufficient.
Category F
The estimate and confidence interval are not recommended for release. They are deemed of such poor quality, that they are not fit for any use; they contain a very high level of instability, making them unreliable and potentially misleading. If analysts insist on releasing estimates of poor quality, even after being advised of their accuracy, the estimates should be accompanied by a disclaimer. Analysts should acknowledge the warnings given and undertake not to disseminate, present or report the estimates, directly or indirectly, without this disclaimer. The estimates should be flagged with the letter F (or some similar identifier) and the following warning should accompany the estimates and confidence intervals: "Please be warned that these estimates and confidence intervals [flagged with the letter F] do not meet Statistics Canada's quality standards. Conclusions based on these data will be unreliable, and may be invalid."
The rules for assigning an estimate to a release category depends on the type of estimate.
Release Rules for Estimated Proportions and Estimated Counts
Estimated proportions and estimated counts are computed from binary variables. Estimated counts are estimates of the total number of persons/households with a characteristic of interest; in other words, they are the weighted sum of a binary variable (e.g., estimated number of immigrants). Estimated proportions are estimates of the proportion of persons/households with a characteristic of interest (e.g., estimated proportion of immigrants in the general population). Estimated counts and proportions can also be computed from categorical variables: that is, estimates of the number or proportion of persons/household who belong to a category.
The release rules for estimated proportions and estimated counts are based on sample size. Table 1 provides the release rules for the PCS-EP, for all estimated proportions and counts except estimates for visible minorities.
Table 1: General rules for proportions and counts, expect visible minority estimates
Sample Size (n)
Release Category
Action
n ≥ 200
E
Release with quality warning; users should use CI as quality indicator
n < 200
F
Suppress the estimate and its CI for quality reasons
For estimated proportions, n is defined as the unweighted count of the number of respondents in the denominator (not the numerator) of the proportion. For estimated counts, n is defined as the unweighted count of the number of respondents with nonzero values that contribute to the estimate.
Special rules for estimates by visible minority
Table 2 provides special release rules that are to be used whenever estimates are produced for a visible minority group (i.e., using VISMIN or VISMINFL). Special rules are required because of the GSS-SI sample design that included an oversample of certain visible minority groups.
Table 2: Special rules for proportions and counts for visible minority estimates
Sample Size (n)
Release Category
Action
n ≥ 350
E
Release with quality warning; users should use CI as quality indicator
n < 350
F
Suppress the estimate and its CI for quality reasons
Given the number of respondents to the PCS-EP, these rules imply that individual visible minority groups cannot be used as domains for analysis based on the PCS-EP but that analysis by VISMINFL is permissible. On the other hand, given that the experiences of different visible minority groups can be very different from each other, it may not be suitable to produce an estimate for all visible minority groups together (VISMINFL = 1). It is therefore recommended that, even though these estimates should not be disseminated, estimates by the more disaggregated VISMIN categories be compared between them before deciding to group all visible minority groups together.
Release Rules for Means and Totals of Quantitative Variables
The release rules for the estimated means and totals of quantitative variables or amounts are based on the sample size and on the CV of the estimate. Table 3 provides the release rules for the PCS-EP, except visible minority estimates.
Table 3: General rules for means and totals
Sample Size (n)
Release Category
Action
n ≥ 200 and CV ≤ 50%
E
Release with quality warning; users should use CI as quality indicator
n < 200 or CV>50%
F
Suppress the estimate and its CI for quality reasons
For estimated means, n is defined as the unweighted count of the number of respondents that contribute to the estimate including values of zero. For estimated totals, n is defined as the unweighted count of the number respondents with nonzero values that contribute to the estimate.
Special rules for estimates by visible minority
Table 4 provides special release rules that are to be used whenever estimates are produced for a visible minority group (i.e., using VISMIN or VISMINFL). Special rules are required because of the GSS-SI sample design that included an oversample of certain visible minority groups.
Table 4: Special rules for means and totals for visible minority estimates
Sample Size (n)
Release Category
Action
n ≥ 350 and CV ≤ 50%
E
Release with quality warning; users should use CI as quality indicator
n < 350 or CV>50%
F
Suppress the estimate and its CI for quality reasons
Given the number of respondents to the PCS-EP, these rules imply that individual visible minority groups cannot be used as domains for analysis based on the PCS-EP but that analysis by VISMINFL is permissible. On the other hand, given that the experiences of different visible minority groups can be very different from each other, it may not be suitable to produce an estimate for all visible minority groups together (VISMINFL = 1). It is therefore recommended that, even though these estimates should not be disseminated, estimates by the more disaggregated VISMIN categories be compared between them before deciding to group all visible minority groups together.
Release Rules for Differences
In order to assign a release category for an estimated difference between two estimates, the analyst must first determine the release category of each of the two estimates using the rules described above. Next, the release category of the estimated difference or the estimate of change is assigned the lower release category of the two estimates; this can be specified as follows:
If one or both estimates are category F estimates, then assign the estimated difference to category F and suppress it.
Otherwise, assign the estimated difference to category E and release with a quality warning.
Additional Rules Regarding Confidence intervals
The above release rules should suppress most estimates and confidence intervals of poor quality. There are also two additional conditions that indicate that a confidence interval is of poor quality. An estimate and its confidence interval should be assigned to release category F if either of the following two conditions are true:
The lower bound of the 95% confidence interval is equal to the upper bound of the interval; in other words, the confidence interval is of length zero. (Exceptions are if the estimate corresponds to a calibration control total.)
The lower bound or upper bound of the 95% confidence interval is not a plausible value for the estimate. For example, the lower bound for an estimated proportion is negative.
CVs for Total sales by geography
This table displays the results of Annual Retail Trade Survey: CVs for Total sales by geography - July 2021. The information is grouped by Geography (appearing as row headers), Month and Percent (appearing as column headers)


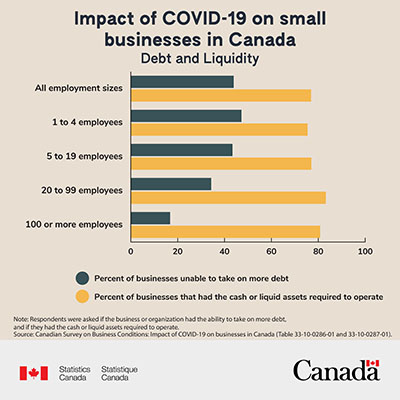


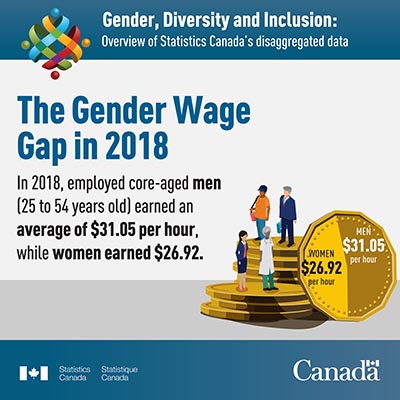
 The
The