North American Product Classification System (NAPCS) Canada 2012 Version 1.2

Introduction

NAPCS Canada 2012 Version 1.2 updates NAPCS Canada 2012 Version 1.1. Some categories were split, and others were merged. New categories were incorporated, and some were deleted, for a net decrease of 79 product categories at different levels, providing better relevancy to statistical programs and users. Most of the changes, however, were editorial. They relate to editing of category titles adding precision to their formulations. The detailed list of changes can be obtained from Standards Division at standards-normes@statcan.gc.ca.

Standard classification structure

The standard classification structure of NAPCS Canada 2012 comprises four levels: group, class, subclass, and detail. The table below outlines the nomenclature and provides the number of categories within each level of NAPCS Canada 2012 versions 1.2 and 1.1.

Standard classification structure of NAPCS Canada 2012
Level Coding Number of categories NAPCS 2012 Version 1.2 Number of categories NAPCS 2012 Version 1.1
Group 3-digit codes 156 158
Class 5-digit codes 506 511
Subclass 6-digit codes 1,389 1,402
Detail 7-digit codes 2,635 2,694
Total   4,686 4,765
Table source: Statistics Canada, NAPCS.
Date modified:

What is Gross Domestic Product (GDP)?

Catalogue number: Catalogue number: 11-629-x

Issue number: 2015034

September 2015

What is Gross Domestic Product (GDP)? - Transcript

Description of visuals

Gross Domestic Product – GDP for short – can be thought of as an overall grade on the economic report card of a country or region.

(A school report card is shown.)

It's one way to measure of the size and growth of the economy. For example, if the year-to-year GDP is up 3%, this means that the economy has grown by 3% over the last year.

(Under the "remarks" section of the report card, the text "Gross Domestic Product (GDP) is increasing" is shown. The word "increasing" is underlined, and the line is drawn across the page to form a line chart. The line chart indicates a 3% increase.)

In order to determine the GDP, economists at Statistics Canada compile a massive amount of data including information from hundreds of surveys that are completed by Canadian businesses, the government and Canadian households.

(The line from the line chart becomes an "X" that is drawn into a check box on a survey. The top of the survey reads "Hundreds of Statistics Canada Surveys filled out by Canadian Businesses, Government, and Canadian Households.")

Several methods are used to determine the GDP. One of the most direct methods is called the "value-added approach." To explain it, let's start with our standard definition of GDP, which is "the value of output less intermediate consumption plus any taxes less subsidies on products not already included in the value of output."

(The survey crumples up into a paper airplane and flies into a classroom. Inside the classroom, a chalkboard is shown with the definition of GDP written on it.)

You might find that definition a little hard to follow. So let's break it down with an example. For this example, let's also assume that the "taxes less subsidies on products not already included in the value of output" is equal to zero.

(A line is drawn through this section of the definition.)

Alright - let's say you have an automobile assembly plant. Every year, the plant produces all sorts of cars. The total worth of all the cars produced annually in the factory is $1,000,000.

(A conveyor belt is shown, with a car being assembled by robotic arms. The conveyor belt has the text "$1,000,000 worth of cars.")

That $1,000,000 in the production of cars is considered to be the output.

(The chalkboard shows the text "output = $1,000,000 worth of cars" )

Let's return to the definition. GDP is the value of output, in this case the value of the cars, less intermediate consumption.

(The definition is again shown on the chalkboard.)

So, what is intermediate consumption?

(The car that was just assembled drives down the road and then drops into a machine labeled "$700,000 worth of car parts." The machine then produces boxes labeled "car parts.")

Well, let's say the automobile assembly plant needs to purchase $700,000 worth of car parts from the motor vehicle parts manufacturing industry before it can fabricate the $1,000,000 worth of cars. The $700,000 worth of car parts is considered to be intermediate consumption. To return to the definition again, GDP in this case is the output of $1,000,000 worth of cars, less the intermediate consumption, which is $700,000 for the car parts.

So, in our example, $300,000 is considered to be the GDP of the car assembly plant.

(The chalkboard shows the equation of output ($1,000,000 worth of cars) minus intermediate consumption ($700,000 worth of car parts) equals output ($300,000).)

But the story doesn't end there. Let's look at the motor vehicle parts manufacturer that produced the parts for the assembly plant. In order to produce the parts, it first had to purchase steel from the steel mill. Before that, the steel mill had to purchase the iron ore from a mine, and so on.

(Images of a welding in a steel mill and an iron ore mine are drawn on the chalkboard.)

Each of these industries involved in the process, harvesting the ore, making the steel, making the car parts etc. has its own output and intermediate consumption, which also means that each industry has its own GDP.

(Images to represent each industry appear on the chalkboard. Numbers appear in front of them to reflect their respective GDP amounts. The steel mill and the iron ore mine each have a GDP of $200,000, while the car parts manufacturer and the car assembly plant each have a GDP of $300,000.)

The GDP values of each of these industries must all be added together to reflect the total GDP of the economy. So, although the GDP of the automobile assembly plant is only $300,000, the GDP attributed to the entire economy would be much higher. In fact, it could actually be closer to, well, $1,000,000.

(A plus sign is drawn between each number on the chalkboard, they are then combined to make $1,000,000.)

To summarize, in the example that was just illustrated, we identified 4 industries that were included in our little economy. Those industries were the automobile assembly industry, the motor vehicle parts manufacturing industry, the steel manufacturing industry, and the iron ore mining industry. The sum of the value added of each industry gave us the total GDP for the economy.

(Each of the four aforementioned industries are shown again, with their respective GDP measures. They are added again to make $1,000,000.)

Gross Domestic Product is the metre stick of the economy. Broadly, when it's increasing, the economy is said to be growing. If GDP is slowing down or negative, it can be an early sign of recession. That's why we take great care to provide Canadians with access to accurate, up-to-date GDP data. You can learn more about GDP at www.statcan.gc.ca.

(As the camera retracts from its close-up on the chalkboard, the website URL is shown. The website address fades to black, and the Canada wordmark fades in.)

Date modified:

Getting started with the Social Data Linkage Environment (SDLE)

Record linkage proposals involve a significant amount of initial analysis and discussion to develop a formal project contract. Information is provided to Statistics Canada so that project feasibility can be assessed before the formal record linkage application for approval can begin. To facilitate the experience through all project steps, applicants are encouraged to familiarize themselves with the requirements for approval, understand their data sources and what is needed for record linkage, as well as giving thought early on about desired outputs and data access protocols.

Here are some questions to consider before starting a record linkage project at Statistics Canada:

For approval

  1. Do you have a clear research question?
  2. Do you have a research protocol? Do you have an ethics approval?
  3. Does your study meet the expected results from Statistics Canada's Directive on Microdata Linkage? Can you clearly demonstrate how the public interest is served by your project and why a record linkage is the best means to achieve this public benefit? Are you sure that the data you expect from linkage are not otherwise available?

Feasibility of linkage

  1. Have you examined the available source data file documentation to ensure that the variables of interest will serve your needs and that the sample (if applicable) is adequate for your study?
  2. If applicable, does your microdata file have personal identifiers that would enable record linkage?
  3. If your project requires an external microdata file, have you received permission from the data owner to provide it to Statistics Canada?

Final deliverables and access

  1. Have you thought about the structure of your final linked analysis file? Are derived variables needed? Will you need to person-orient records? How will different reference periods be treated? Will you be using longitudinal data?
  2. What are your plans to identify and address the data quality issues associated with record linkage and with the specific sources that you have in mind?
  3. How do you intend to access the linked microdata? Have you considered access through the Research Data Centres (RDC) Program?

See Record Linkage Application Process if you would like to prepare a record linkage project proposal.

Derived Record Depository (DRD) linkage status

Linkages to the Derived Record Depository (DRD)Table Note 1 as of June 2024
Table summary
This table displays the files linked to the Derived Record Depository (DRD). The information is shown by Source (appearing as row headers) and by Years/Cycles (appearing as column headers).
Source Years/Cycles
Contributors (files that add individuals to the DRD)
T1 Personal Master File 1981 to 2022
Canadian Child Tax Benefits (CCTB) files 2010-2011 to 2022-2023
Landing File 1980 to 2016
Vital Statistics – Birth database 1974 to 2023
Social Insurance Registry 1964 to April 2024
Vital Statistics – Death database 1926 to 2022
Longitudinal Immigration Database (IMDB) 1952 to 2022
Updaters (files that update information of individuals in the DRD)
Canadian Cancer Registry (CCR) 1992 to 2021
Discharge Abstract Database (DAD) 1994-1995 to 2022-2023
National Ambulatory Care Reporting System (NACRS) 2002-2003 to 2021-2022
Ontario Mental Health Reporting System (OMHRS) 2006-2007 to 2022-2023
Hospital Morbidity Database / Health Person-Oriented Information (HMDB/HPOI) 1994-1995 to 2005-2006
National Cancer Incidence Reporting System (NCIRS) 1969 to 1991
Linkers (files that are linked to the DRD for analytical purposes)
Youth in Transition Survey (YITS) Longitudinal cohorts
Survey of Labour and Income Dynamics (SLID) Panel 3, 1999 to 2004
National Longitudinal Survey of Children and Youth (NLSCY) Longitudinal cohort
Longitudinal Survey of Immigrants to Canada (LSIC) Longitudinal cohort
National Population Health Survey: Household Component, Longitudinal (NPHS) Longitudinal cohort
Montreal Longitudinal-Experimental Study 1983-1984 to 2014-2015
Québec Longitudinal Study of Kindergarten Children 1986-1987 to 2014-2015
Québec Longitudinal Study of Kindergarten Children - Parents 1986-1987 to 2014-2015
British Columbia Performance Indicator Reporting System Data 2007-2008 to 2013-2014
2001 Census Tax Mortality Cohort 2001
Canadian Forces Cancer and Mortality Study (CFCAMS) II 1972 to 2019
Long-term Community Adjustment of Canadian Federal Offenders Cohort 1999 to 2001
Re-contact with the Saskatchewan justice system 2009 to 2012
Future to Discover Project 2004 to 2011
Canadian Health Measures Survey (CHMS) Cycle 1 to cycle 4 (2007 to 2014)
Pathways to Education 2000 to 2008
Canadian Coroner and Medical Examiner Database (CCMED) 2006 to 2020
Canadian Community Health Survey (CCHS) - Annual and focus content cycles 2000-2023
Census of Population 2006 2006
Census of Population 2011 2011
National Household Survey 2011
Census of Population 2016 2016
Census of Population 2021 2021
Saskatchewan Legal Aid Client Registry 2011-2012 to 2015-2016
Life After Service Cohort 1998 to 2019
Labour Force Survey (LFS) 2007 to July 2023
Postsecondary Student Information System (PSIS) 2008 to 2021
Registered Apprenticeship Information System (RAIS) 2008 to 2022
Ontario Adult Correctional Services (OTIS) 1992 to 2016
Ontario Adult Criminal Courts (ICON) 1991 to 2016
Ontario Bail and Remand (eJIRO) 2014 to 2016
Ontario Policing Records 2006 to 2017
Employment Insurance Status Vector (EISV) 1997 to July 2022
Canadian Health Measures Survey (CHMS), Cycle 5 2016 to 2017
Survey of Maintenance Enforcement Programs (SMEP) 2011 to 2016
Canada Student Loans Program (CSLP) 2005 to 2016
Re-contact with the Nova Scotia Justice System 2009 to 2016
British Columbia Coroner's File 2007 to 2017
Surrey RCMP Overdose Victim Records 2016
General Social Survey - Social Identity (GSS 27) 2013
General Social Survey - Family (GSS 31) February 2017 to November 2017
General Social Survey - Caregiving and Care Receiving (GSS 32) 2018
General Social Survey - Giving, Volunteering and Participating (GSS 33) 2018
General Social Survey - Victimization (GSS34) 2019
British Columbia Elementary - Secondary Students 1991 to 2020
National Sciences and Engineering Research Council of Canada (NSERC), Scholarship Programs 1998 to 2018
Canadian Institutes of Health Research (CIHR), Scholarship programs 2000-2001 to 2018
Social Sciences and Humanities Research Council (SSHRC), Scholarship Programs 1998 to 2018
British Columbia Ministry of Health Client File January 2014 to July 2017
British Columbia Centre for Disease Control Data January 2014 to July 2017
Ontario Adult Criminal Courts 2006 to 2016
Longitudinal Administratve Database (LAD) 1982 to 2018
British Columbia Generations Project 2009 to 2018
Ontario Health Study 2009 to 2017
Canada Education Savings Program 1998 to 2021
National Dose Registry 1942 to 2019
Canadian Patents 1999 to 2017
Survey of Safety in Public and Private Spaces 2018
National Cancer Institute of Canada Clinical Trial Cohort 2018
Library and Archives Canada Military Personnel Records 1800 to 2000
Atlantic Partnership for Tomorrow's Health Study 2012 to 2018
Citizenship 2004 to 2021
Dependant Registry 2017 to 2019
Visitors 2004 to 2022
Ontario Student Data File from grade 9 to 12 2009 to 2017
Canada Apprenticeship Grant File 2007 to 2023
Canada Apprenticeship Loan File 2007 to 2023
Drivers' Licence File February 2018 to November 2023
Toronto District School Board file 2000 to 2012
Survey of Household Spending 2010-2017, 2019, 2021, 2023
Canadian Housing Survey 2018-2019, 2020-2021, 2022-2023
Imperial Oil Limited 1964 to 2007
Integrated Criminal Court Survey 2005 to 2022
Canadian Fluoroscopy Cohort Study 1930 to 1952
Corporations Returns Act (CRA) 2006 to 2020
Canada Emergency Response Benefit (CERB) 2020
Ontario Policing and Paramedics – Simcoe-Muskoka 2006 to 2017
Canadian Forces Superannuation Act 1938 to 2016
Vehicle Registration Files (Ontario and British Columbia) 2016 to 2019
Alberta Lottery 2004 to 2019
Ministry of Children, Community and Social Services (Ontario Social Assistance)(MCSS) 2003 to 2015
Tri-Agency 2000 to 2015
Edmonton Policing Records 2007 to 2020
National Longitudinal Survey of Children and Youth (NLSCY2) Cycle 4 to cycle 8 
Canadian COVID-19 Antibody and Health Survey November 2020 to April 2021
Records of Employment File January 1965 to 2020
Veterans Affairs Canada 1982 to 2024
Longitudinal and International Study of Adults (LISA) 82 to 2017 and 2021
Wage Earner Protection Program (WEPP) 2011-2021
Canadian Social Survey Wave 1, 2, 3, 4, 5, 6, 7, 9, 10, 11 and 12 2021-2024
Canadian Internet Use Survey 2021
Alberta Bankruptcy File 2006 to 2014
General Social Survey - Social Identity (GSS 35)  2020
Canadian Correctional Services Survey 2015 to 2021
Home Care Reporting System (HCRS) 2007 to 2021
Continuing Care Reporting System (CCRS) 1921 to 2021
Vital Statistics – Birth Database - mother 1974-2017
Agriculture Social File 2016-2020
Canadian Health Survey on Seniors (CHSS) 2019
Canadian COVID-19 Antibody and Health Survey - Cycle 2 April to August 2022
Canada Student Financial Assistance Program 2009 to 2021
Rio Tinto 1950 to 2019

Overview of the Social Data Linkage Environment (SDLE)

On this page

The purpose of the SDLE program is to facilitate pan-Canadian social and economic statistical research. It is a record linkage environment that:

  • increases the relevance of existing Statistics Canada surveys without collecting new data (including maintaining the relevance of completed longitudinal surveys);
  • substantially increases the use of administrative data;
  • generates new information without additional data collection;
  • maintains the highest privacy and data security standards; and
  • promotes a standardized approach to record linkage processes and methods.

Benefits and public good

Fill data gaps: Studies conducted through the SDLE have the potential to address important information gaps related to the financial, social, economic and general activities and conditions of Canadians.

Reduce response burden: Through record linkage, important data needs in the analysis of social data can be met without incurring the cost or response burden of collecting new data.

Reduce record linkage costs: The SDLE process surrounding the preparation and management of files for record linkage is more efficient and timely through the use of a processing system and the retention of cumulative linkage results.

How it works

The SDLE is a highly secure environment that facilitates the creation of linked population data files for social analysis. It is not a large integrated data base.

At the core of the SDLE is a Derived Record Depository (DRD), essentially a national dynamic relational data base containing only basic personal identifiers. The DRD is created by linking selected Statistics Canada source index filesDefintion 4 for the purpose of producing a list of unique individuals. These files are brought into the environment, processed and linked only once to the DRD. Each individual in the DRD is assigned an SDLE identifier. Some of the source index files used to build the DRD include tax records, vital statistics registration records (births and deaths), and immigrant data. Updates to these data files are linked to the DRD on an ongoing basis.

Only basic personal identifiers are stored in the DRD. Examples of personal identifiers stored in the DRD include surnames, given names, date of birth, sex, insurance numbers, parents' names, marital status, addresses (including postal codes), telephone numbers, immigration date, emigration date and date of death.

The paired SDLE identifiers and source index file record IDs resulting from the record linkage are stored in a Key RegistryDefintion 2. All source index files are linked to the DRD either probabilistically using a generalized software tool (G-Link) or deterministically using SAS scripts.

Deterministic record linkage involves matching records based on unique identifiers shared by both files. On the other hand, probabilistic record linkage works with non-unique identifiers (e.g. names, sex, date of birth and postal code) and estimates the likelihood that records are referring to the same entity.

Once a study requiring linked data has been defined and approved, the associated record IDs (extracted from the Key Registry) are used to find the individual records in the source data filesDefintion 3. Selected variables from these sources can then be integrated into a linked analysis file. This approach provides a virtual linkage environment that eliminates the need to build a large integrated data base.

Figure 1. Social Data Linkage Environment overview diagram

Figure 1. Social Data Linkage Environment overview diagram
Description for Figure 1: Social Data Linkage Environment overview diagram

This figures is a visual model that serves as a summary of the text of this overview page.

  • Within the secure data environment at Statistics Canada, source files are separated into Source Data Files (record IDs and analysis variables without personal identifiers) and Source Index Files (record IDs and personal identifiers without analysis variables).
  • The Source Index Files are accessed within the record linkage production environment and linked to the Derived Record Depository (national longitudinal file of personal identifiers). The linked SDLE and record IDs are stored in the Key Registry (record IDs used as keys to find only those records needed for study).
  • The Source Data Files are accessed within the linked analysis file production environment that uses keys from the Key Registry to create analysis files for approved studies only and with no personal identifiers.
  • The SDLE program is governed by the Statistics Canada senior management. The Chief Statistician reviews and approves each record linkage proposal, and if the study is approved by the Chief Statistician, an analysis file is created.
  • The output of this process is an Analytical Product (non-confidential aggregate data).

Data sources

The Derived record depository (DRD)Defintion 1 contains only record IDs and identifiers without analysis data. The principal source index filesDefintion 4 that contribute to build (i.e. add individual records) and update (i.e. provide additional information to existing records) the DRD include:

  • T1 Personal Master Files (tax);
  • Canadian Child Tax Benefits (CCTB) files;
  • Canadian Vital Statistics – Birth database;
  • Landing File; and
  • Canadian Vital Statistics – Death database.

Other sources will be used to create linked analysis files for approved projects (some of which may also be used to update the DRD). See DRD linkage status.

In the future, additional files could be linked to the DRD. These could be data already residing in Statistics Canada or external files brought in for specific approved research projects.

Statistics Canada has responsibility for securely storing and processing data. Because SDLE research projects involve the use of linked micro-records, approval by the Chief Statistician of Canada on a study-by-study basis is required in accordance with the Directive on Microdata Linkage. Summaries of approved record linkages are published on the Statistics Canada website.

Linked analysis files

When a research project requiring linked data from the SDLE has been approved and linked in the SDLE production environment, the record IDs for the specified cohort and the associated record IDs of the file(s) to be linked to the cohort are drawn from the Key RegistryDefintion 2. These record IDs are used to bring selected variables from the separate source data files together to create a linked analysis file.

Depending on the complexity of the source data file(s), decisions about how to structure the linked analysis file may be needed (e.g. working with multiple reference periods or with event-based files, etc.). Furthermore, the quality of the linked data must be assessed. Data that are linked in the SDLE will go through two kinds of validation:

  • Assessment of the record linkage: What is the match rate (%) with the DRDDefintion 1? Are the links valid? (False positive links? Missed links?)
  • Assessment of linked analysis file: Do the linked data appear to make sense from a subject-matter point of view? Any bias caused by the linkage process? Do they adequately represent the study population of interest?

These file structuring decisions and data quality measures will be documented and need to be taken into account in the final analysis.

Services

In addition to maintaining the SDLE and conducting new record linkages, the SDLE team provides support to clients as required including:

  • assessing project feasibility;
  • advising on data sources, analytical limitations, and validation;
  • liaising with subject-matter experts;
  • assistance with approval steps;
  • building custom linked analysis files; and
  • providing training and outreach.

Statistics Canada makes custom services, such as the SDLE, available to Canadian organizations on a cost-recovery basis. Cost-recovery means that clients pay for the direct and indirect cost of doing the work. Custom services are not funded by the budget that Parliament allocates to Statistics Canada. Costs reflect the requirements of each client and range depending on the complexity of the proposal.

For more information, contact us by email at STATCAN.SDLE-ECDS.STATCAN@canada.ca.

Confidentiality and privacy

Linked analysis files are deemed sensitive statistical information and subject to the confidentiality requirements of the Statistics Act. To reduce the risk of privacy intrusiveness and to minimize the risk of disclosure, source files in SDLE are separated into source index files and source data files. As well, the record linkage production environment that uses the source index files is separated from the data integration and analysis environment that uses the source data files. That is, Statistics Canada employees performing the record linkages in SDLE have access to only the basic personal identifiers needed for linkage. Employees who build the analytical files for research have access only to the data stripped of personal identifiers. Anonymous keys are used to integrate the data from the various sources into a linked analysis data file. Further, only Statistics Canada employees who have an approved need to access the data for their analytical work are allowed access to the linked analysis file. The privacy impact assessment conducted by Statistics Canada found these processes acceptable to reduce the risk of privacy intrusiveness and to minimize the risk of disclosure.

Definitions

Definition 1

Derived Record Depository (DRD) is a national longitudinal data base of individuals derived from a number of Statistics Canada data files and containing only basic personal identifiers.

Return to the first definition 1 referrer

Definition 2

Key Registry stores the paired SDLE identifiers and source index file record IDs identified through record linkage.

Return to the first definition 2 referrer

Definition 3

Source data files contain analysis variables without personal identifiers.

Return to the first definition 3 referrer

Definition 4

Source index files contain personal identifiers without analysis variables.

Return to the first definition 4 referrer

Social Data Linkage Environment (SDLE)

Social Data Linkage Environment (SDLE) information

Overview

Overview of the Social Data Linkage Environment (SDLE)

Derived Record Depository (DRD) linkage status

List of files linked in the Social Data Linkage Environment (SDLE)

Getting started

What to consider before starting a record linkage project at Statistics Canada

Record Linkage Application Process

Record linkage application process: steps to follow

Expanding data potential

The Social Data Linkage Environment (SDLE) at Statistics Canada promotes the innovative use of existing administrative and survey data to address important research questions and inform socio-economic policy through record linkage.

The SDLE expands the potential of data integration across multiple domains, such as health, justice, education and income, through the creation of linked analytical data files without the need to collect additional data from Canadians.

Protecting personal information

Statistics Canada takes your confidentiality very seriously. Under the Statistics Act, all information provided to Statistics Canada is kept confidential, and used only for statistical purposes.

Statistics Canada ensures the privacy and confidentiality and data security of all our programs. In addition to consulting with the Office of the Privacy Commissioner, Statistics Canada conducted a privacy impact assessment to address any potential issues relating to confidentiality or security with the work being undertaken through the SDLE.

Frequently asked questions

What are the benefits of using SDLE?

The SDLE environment offers a highly secure data infrastructure for record linkage activities. It increases efficiency through the use of a processing system, thus offering more timely results and lower costs. SDLE enables linkage across multiple data sets in the social domain which fills important data gaps and can contribute to new research and a better understanding of Canadian society. SDLE also aims to standardize processes, improve methods and enhance data quality.

What services are available?

Our services and supports include: assessing the feasibility of record linkage projects, offering advice on data sources, liaising with subject-matter experts, assisting with approval steps, conducting the record linkage, building custom linked analysis files according to client specifications, advising on analytical limitations and validation, and providing training and outreach.

What kind of linkages can be done in SDLE?

Any linkage of persons can be done in SDLE.

How does SDLE maintain privacy and confidentiality?

Linked analysis files are deemed sensitive statistical information and subject to the confidentiality requirements of the Statistics Act. To reduce the risk of privacy intrusiveness and to minimize the risk of disclosure, source files in SDLE are separated into source index files and source data files. As well, the record linkage production environment that uses the source index files is separated from the data integration and analysis environment that uses the source data files. That is, Statistics Canada employees performing the record linkages in SDLE have access to only the basic personal identifiers needed for linkage. Employees who build the analytical files for research have access only to the data stripped of personal identifiers. Anonymous keys are used to integrate the data from the various sources into a linked analysis data file. Further, only Statistics Canada employees who have an approved need to access the data for their analytical work are allowed access to the linked analysis file. The privacy impact assessment conducted by Statistics Canada found these processes acceptable to reduce the risk of privacy intrusiveness and to minimize the risk of disclosure.

Is there a cost to use SDLE services?

Statistics Canada makes custom services, such as the SDLE, available to Canadian organizations on a cost-recovery basis. Cost-recovery means that clients pay for the direct and indirect cost of doing the work. Custom services are not funded by the budget that Parliament allocates to Statistics Canada. Costs vary depending on the complexity and the requirements of the proposal.

How much does it cost?

The SDLE is a cost-recovery program. Every project is unique and a range of outputs are available. Costs reflect the requirements of each client and range depending on the complexity of the proposal.

How can I get more information on SDLE?

For more information, email us at statcan.sdle-ecds.statcan@statcan.gc.ca.

More information

If you have questions or a potential project for SDLE, please contact us by email at statcan.sdle-ecds.statcan@statcan.gc.ca.

External researchers can access linked analysis files in Statistics Canada's Research Data Centres (RDC). To learn more about the RDC program, please refer to the Research Data Centres program or send an email to statcan.mad-damdam-mad.statcan@statcan.gc.ca.

Permanent Resident Landing File

Description

The Citizenship and Immigration Canada (CIC) permanent resident landing file contains approximately 2.75 million records corresponding to all individuals who landed in Canada during the 2003 – 2013 time frame. The information in the data file is derived from the information included on each individual’s landing record and has not been updated since the time of landing. The variables available may be described using the subjects list below. There are many more variables on the data file because grouped variables have been derived from the landing record data values. For example, age in years is reported on the landing record. An additional two variables corresponding to 5 and 15 year age groups have also been added to the data file. Another example is that the country of birth is reported on the landing record, while an additional two variables which categorize that country into a region of the world and an area of the world have been added to the data file.

Reference period

2003 – 2013

Subjects

  • Age in years, plus 5 year age groups and 15 year age groups
  • Marital Status
  • Gender
  • Mother Tongue
  • Official Languages Spoken
  • Date of Landing: year-month-day
  • Education Level- none, secondary or less, …, doctorate
  • Years Of Schooling
  • Country of Birth, plus grouped categories region & area of the world
  • Country of Citizenship, plus grouped categories region & area of the world
  • intended destination –CMA, census division & province (or if not available, the last known address)
  • Immigration category – provided in first, second, third and fourth level groupings of the immigration category hierarchy
  • Occupation title as listed on the landing record (approximately 9900 categories)
  • Skill levels (two different hierarchies used) corresponding to occupation title as listed on the landing record
  • NOC Code (2006 and 2011) derived from occupation title as listed on the landing record

Target population

A person is included in the database only if he or she obtained landed immigrant or permanent resident status in Canada since 2003 and 2013.

Sampling

Data are collected for all units of the target population, therefore no sampling is done.

Date modified:

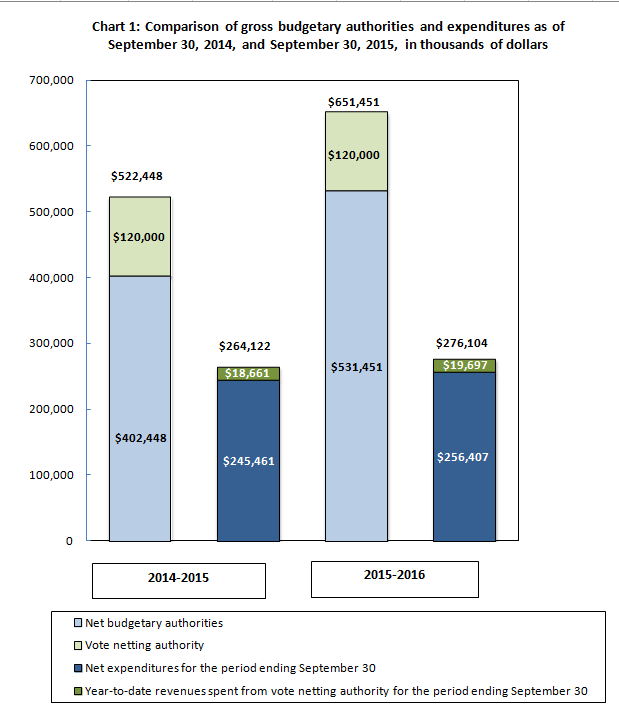
Description for Chart 1: Comparison of gross budgetary authorities and expenditures as of June 30, 2014, and June 30, 2015, in thousands of dollars

This bar graph shows Statistics Canada's budgetary authorities and expenditures, in thousands of dollars, as of June 30, 2014 and 2015:

  • As at June 30, 2014
    • Net budgetary authorities: $379,555
    • Vote netting authority: $120,000
    • Total authority: $499,555
    • Net expenditures for the period ending June 30: $121,613
    • Year-to-date revenues spent from vote netting authority for the period ending June 30: $12,951
    • Total expenditures: $134,564
  • As at June 30, 2015
    • Net budgetary authorities: $525,095
    • Vote netting authority: $120,000
    • Total authority: $645,095
    • Net expenditures for the period ending June 30: $127,586
    • Year-to-date revenues spent from vote netting authority for the period ending June 30: $5,955
    • Total expenditures: $133,541


Statement outlining results, risks and significant changes in operations, personnel and program

A) Introduction

Statistics Canada's mandate

Statistics Canada is a member of the Industry portfolio.

Statistics Canada's role is to ensure that Canadians have access to a trusted source of statistics on Canada that meets their highest priority needs.

The Agency's mandate derives primarily from the Statistics Act. The Act requires that the Agency collects, compiles, analyzes and publishes statistical information on the economic, social, and general conditions of the country and its people. It also requires that Statistics Canada conduct the census of population and the census of agriculture every fifth year, and protects the confidentiality of the information with which it is entrusted.

Statistics Canada also has a mandate to co-ordinate and lead the national statistical system. The Agency is considered a leader, among statistical agencies around the world, in co-ordinating statistical activities to reduce duplication and reporting burden.

More information on Statistics Canada's mandate, roles, responsibilities and programs can be found in the 2015–2016 Main Estimates and in the Statistics Canada 2015–2016 Report on Plans and Priorities.

The quarterly financial report

  • should be read in conjunction with the 2015–2016 Main Estimates;
  • has been prepared by management, as required by Section 65.1 of the Financial Administration Act, and in the form and manner prescribed by Treasury Board;
  • has not been subject to an external audit or review.

Statistics Canada has the authority to collect and spend revenue from other government departments and agencies, as well as from external clients, for statistical services and products.

Basis of presentation

This quarterly report has been prepared by management using an expenditure basis of accounting. The accompanying Statement of Authorities includes the Agency's spending authorities granted by Parliament and those used by the Agency consistent with the Main Estimates for the 2015–2016 fiscal year. This quarterly report has been prepared using a special purpose financial reporting framework designed to meet financial information needs with respect to the use of spending authorities.

The authority of Parliament is required before moneys can be spent by the Government. Approvals are given in the form of annually approved limits through appropriation acts or through legislation in the form of statutory spending authority for specific purposes.

The Agency uses the full accrual method of accounting to prepare and present its annual departmental financial statements that are part of the departmental performance reporting process. However, the spending authorities voted by Parliament remain on an expenditure basis.

B) Highlights of fiscal quarter and fiscal year-to-date results

This section highlights the significant items that contributed to the net increase in resources available for the year, as well as actual expenditures for the quarter ended June 30.

Description for Chart 1

Comparison of gross budgetary authorities and expenditures as of June 30, 2014, and June 30, 2015, in thousands of dollars

Chart 1 outlines the gross budgetary authorities, which represent the resources available for use for the year as of June 30.

Significant changes to authorities

Total authorities available for 2015–2016 have increased by $145.5 million, or 38%, from the previous year, from $499.6 million to $645.1 million (Chart 1). This net increase was mostly the result of the following:

  • increase for the 2016 Census of Population Program ($141.9 million), as well as for the 2016 Census of Agriculture ($7.2 million)
  • decrease for the 2011 Census of Population Program ($2.8 million), as the program is complete.

In addition to the appropriations allocated to the Agency through the Main Estimates, Statistics Canada also has vote net authority within Vote 105, which entitles the Agency to spend revenues collected from other government departments, agencies, and external clients to provide statistical services. Vote netting authority is stable at $120 million in each of the fiscal years 2014–2015 and 2015–2016.

Significant changes to expenditures

Year-to-date net expenditures recorded to the end of the first quarter increased by $6.0 million, or 4.9%, from $121.6 million to $127.6 million. (See Table A: Variation in Departmental Expenditures by Standard Object.)

Statistics Canada spent approximately 24% of its authorities by the end of the first quarter, compared with 32% in the same quarter of 2014–2015.

Table A: Variation in Departmental Expenditures by Standard Object (unaudited)
This table displays the variance of departmental expenditures by standard object between fiscal year 2014-2015 and 2015-2016. The variance is calculated for year to date expenditures as at the end of the first quarter. The row headers provide information by standard object. The column headers provide information in thousands of dollars and percentage variance for the year to date variation.
Departmental Expenditures Variation by Standard Object Q1 year-to-date variation between fiscal year 2014-2015 and 2015-2016
$'000 %
(01) Personnel 10,244 9.2
(02) Transportation and communications 240 11.6
(03) Information 993 813.9
(04) Professional and special services (243) (8.1)
(05) Rentals (76) (2.2)
(06) Repair and maintenance 10 12.8
(07) Utilities, materials and supplies (45) (12.2)
(08) Acquisition of land, buildings and works - -
(09) Acquisition of machinery and equipment 1,199 637.8
(10) Transfer payments - -
(12) Other subsidies and payments (13,345) (99.6)
Total gross budgetary expenditures (1,023) (0.8)
Less revenues netted against expenditures
Revenues (6,996) (54.0)
Total net budgetary expenditures 5,973 4.9

01) Personnel: The increase was mainly the result of the arbitration award for interviewers and increased collection activities related to cost recovery projects.

03) Information: The increase was the result of the coding review of the standard object definitions and inclusions (e.g., data purchases).

09) Acquisition of machinery and equipment: The increase was the result of timing differences between years for the acquisition of computer equipment.

12) Other subsidies and payments: The decrease is a result of the one-time transition payment for implementing salary payment in arrears made in the first quarter of 2014–2015 by the Government of Canada.

Revenues: The decrease is primarily the result of timing differences between years for the receipt of funds related to the census cost-sharing agreement with another government department.

C) Risks and uncertainties

In 2015–2016, Statistics Canada plans to continue to monitor budget pressures, including the cost saving measures announced in Budget 2014, with the following actions and mitigation strategies:

  • additional analysis, monitoring and validation of financial and human resources information through a monthly financial review by budget holders
  • review of monthly project dashboards in place across the Agency to monitor project issues, risks and alignment with approved budgets
  • continued realignment and reprioritization of work.

In addition, Statistics Canada uses risk management and a risk-based decision-making process to prioritize and conduct its business. In order to effectively do so the Agency identifies its key risks and develops corresponding mitigation strategies in its Corporate Risk Profile.

D) Significant changes to operations, personnel and programs

There have been no significant changes in relation to operations, personnel and programs over the last quarter. For the coming quarters, there will be notable changes in the operations due to increased activities related to the 2016 Census of Population Program.

Approval by senior officials

The original version was signed by
Wayne R. Smith, Chief Statistician
Stéphane Dufour, Chief Financial Officer
Date signed August 27, 2015

Departmental budgetary expenditures by Standard Object (unaudited) - Fiscal year 2015-2016
This table displays the departmental expenditures by standard object for the fiscal year 2015-2016. The row headers provide information by standard object for expenditures and revenues. The column headers provide information in thousands of dollars for planned expenditures for the year ending March 31; expended during the quarter ended June 30; and year to date used at quarter-end 2015-2016.
  Fiscal year 2015-2016
Planned expenditures for the year ending March 31, 2016 Expended during the quarter ended June 30, 2015 Year-to-date used at quarter-end
in tbl-2_housands of dollars
Expenditures
(01) Personnel 480,260 122,145 122,145
(02) tbl-2_ransportation and communications 37,170 2,315 2,315
(03) Information 16,696 1,115 1,115
(04) Professional and special services 54,455 2,758 2,758
(05) Rentals 24,467 3,350 3,350
(06) Repair and maintenance 7,280 88 88
(07) Utilities, materials and supplies 10,685 325 325
(08) Acquisition of land, buildings and works - - -
(09) Acquisition of machinery and equipment 13,901 1,387 1,387
(10) tbl-2_ransfer payments 100 - -
(12) Other subsidies and payments 81 58 58
Total gross budgetary expenditures 645,095 133,541 133,541
Less revenues netted against expenditures
Revenues 120,000 5,955 5,955
Total revenues netted against expenditures 120,000 5,955 5,955
Total net budgetary expenditures 525,095 127,586 127,586
Departmental budgetary expenditures by Standard Object (unaudited) - Fiscal year 2014-2015
This table displays the departmental expenditures by standard object for the fiscal year 2014-2015. The row headers provide information by standard object for expenditures and revenues. The column headers provide information in thousands of dollars for planned expenditures for the year ending March 31; expended during the quarter ended June 30; and year to date used at quarter-end 2014-2015.
  Fiscal year 2014-2015
Planned expenditures for the year ending March 31, 2015 Expended during the quarter ended June 30, 2014 Year-to-date used at quarter-end
in thousands of dollars
Expenditures
(01) Personnel 401,121 111,901 111,901
(02) Transportation and communications 25,808 2,075 2,075
(03) Information 2,509 122 122
(04) Professional and special services 35,680 3,001 3,001
(05) Rentals 13,154 3,426 3,426
(06) Repair and maintenance 7,044 78 78
(07) Utilities, materials and supplies 13,241 370 370
(08) Acquisition of land, buildings and works - - -
(09) Acquisition of machinery and equipment 825 188 188
(10) Transfer payments - - -
(12) Other subsidies and payments 173 13,403 13,403
Total gross budgetary expenditures 499,555 134,564 134,564
Less revenues netted against expenditures
Revenues 120,000 12,951 12,951
Total revenues netted against expenditures 120,000 12,951 12,951
Total net budgetary expenditures 379,555 121,613 121,613
Statement of Authorities (unaudited) - Fiscal year 2015-2016
This table displays the departmental authorities for the fiscal year 2015-2016. The row headers provide information by type of authority, Vote 105 – Net operating expenditures, Statutory authority and Total Budgetary authorities. The column headers provide information in thousands of dollars for Total available for use for the year ending March 31; used during the quarter ended June 30; and year to date used at quarter-end for 2015-2016.
  Fiscal year 2015-2016
Total available for use for the year ending March 31, 2016* Used during the quarter ended June 30, 2015 Year to date used at quarter-end
in thousands of dollars
Vote 105 – Net operating expenditures 456,017 110,316 110,316
Statutory authority – Contribution to employee benefit plans 69,078 17,270 17,270
Total budgetary authorities 525,095 127,586 127,586
Statement of Authorities (unaudited) - Fiscal year 2014-2015
This table displays the departmental authorities for the fiscal year 2014-2015. The row headers provide information by type of authority, Vote 105 – Net operating expenditures, Statutory authority and Total Budgetary authorities. The column headers provide information in thousands of dollars for Total available for use for the year ending March 31; Used during the quarter ended June 30; and year to date used at quarter-end for 2014-2015
  Fiscal year 2014-2015
Total available for use for the year ended March 31, 2015* Used during the quarter ended June 30, 2014 Year to date used at quarter-end
in thousands of dollars
Vote 105 – Net operating expenditures 322,744 107,410 107,410
Statutory authority – Contribution to employee benefit plans 56,811 14,203 14,203
Total budgetary authorities 379,555 121,613 121,613