
Business and consumer services and culture statistics

 Business and consumer services
 Culture
 Other content related to business and consumer services and culture
Features


Key indicators
Selected geographical area: ~ ' ' ~ Canada ~ ''; ?>
-
$4.8 billion9.9%
 (annual change)
 -
$46.8 billion6.5%(annual change)
More key indicators
Selected geographical area: ~ ' ' ~ Canada ~ ''; ?>
-
$865.2 billion3.0%(annual change)
-
2,865-0.3%
 (annual change)
 -
$39.9 billion6.3%(annual change)
-
$7.7 billion5.7%(annual change)
-
$35.9 billion2.9%(annual change)
-
Operating revenue, commercial and industrial machinery and equipment rental and leasing - Canada
(2024)$18.1 billion4.5%(annual change) -
$30.3 billion7.3%(annual change)
-
$24.3 billion-1.7%(annual change)
-
$2.9 billion3.9%(annual change)
-
$3.0 billion2.3%(annual change)
-
$3.9 billion2.5%(annual change)
-
$60.2 billion8.2%(annual change)
-
$72.2 billion5.1%(annual change)
-
$24.1 billion7.4%(annual change)
-
$4.5 billion3.6%(annual change)
-
$106.1 billion7.3%(annual change)
-
$95.0 billion12.5%(annual change)
-
$14.4 billion7.8%(annual change)
-
$17.6 billion-16.6%(annual change)
-
$9.8 billion14.0%(annual change)
-
$26.4 billion11.3%(annual change)
-
$1.1 billion1.1%(annual change)
-
$1.7 billion10.4%(period-to-period change)
-
$10.4 billion-9.5%(period-to-period change)
Food Services and Drinking Places Sales
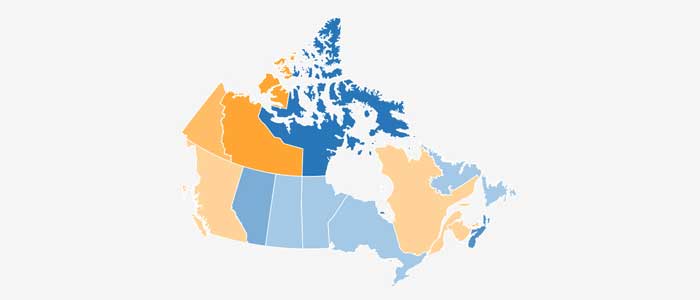
The web application Food Services and Drinking Places Sales provides access to data on the sales of food services and drinking places for Canada and by province and territory. This dynamic application allows users to compare provincial and territorial data through interactive maps and charts.
Sustainable Development Goals
Browse Canada's statistics for the United Nations' Sustainable Development Goals.
Food stats

Food stats is an one-stop shop to access a wide variety of statistical information on food. It contains a listing of data tables, analytical articles and reference materials, which users can filter or sort by title, subject, date or keyword.