
Evaluation Report
February 2017
- Context
- Findings: Relevance
- 2.1 Continued need for the Health Statistics Program
- 2.2 Alignment with government and key partners' priorities
- 2.3 Consistency with federal roles and responsibilities
- Findings: Performance
- 3.1 Accuracy
- 3.2 Timeliness
- 3.3 Accessibility
- 3.4 Coherence
- 3.5 Interpretability
- 3.6 Relevance
- 3.7 Use of the statistical information
- Findings: Economy and Efficiency
- Conclusions and Recommendations
- Management Response and Action Plan
List of acronyms
| Acronym | Description |
|---|---|
| CANSIM | Canadian Socio-Economic Information Management System |
| CCHS | Canadian Community Health Survey |
| CCMED | Canadian Coroner and Medical Examiner Database |
| CCR | Canadian Cancer Registry |
| CHMS | Canadian Health Measures Survey |
| CIHI | Canadian Institute for Health Information |
| CIHR | Canadian Institutes for Health Research |
| DAD | Discharge Abstract Database |
| DSAs | Data-sharing Agreements |
| ESDC | Employment and Social Development Canada |
| HC | Health Canada |
| HDS | Health Data Strategy |
| HSD | Health Statistics Division |
| HSMD | Household Surveys Methods Division |
| HSP | Health Statistics Program |
| ICOS | Integrated Collection and Operation System |
| LTCFS | Long-Term Care Facilities Survey |
| NCHS | National Center for Health Statistics |
| NDM | New Dissemination Model |
| NRS | National Routing System |
| PHAC | Public Health Agency of Canada |
| RDC | Research Data Centres |
| RTRA | Real Time Remote Access |
| SDOH | Social Determinants of Health |
| SSPE | Social Survey Processing Environment |
| TB | Treasury Board of Canada |
| VSP | Canadian Vital Statistics Program |
| WHO | World Health Organization |
Executive summary
The Evaluation and Professional Practices Division (EPPD) of the Audit and Evaluation Branch of Statistics Canada conducted an independent assessment of the Health Statistics Program (HSP), including, exclusively, the activities of the Health Statistics Division (HSD). The results provided objective information and recommendations to support program improvement and inform future decisions by Statistics Canada and Parliament with respect to the government's management of resources and programs.
The evaluation was designed and conducted in accordance with the TB Policy on Evaluation (2009)Footnote 2 and the associated directive and standards, and fulfills an accountability commitment set out in Statistics Canada's Risk-based Audit and Evaluation Plan (2013/2014 to 2015/2016).
Findings
Overall, the Health Statistics Program (HSP) has generally met the needs and priorities within its budget, and generated the expected outcomes, namely providing access to high-quality, relevant statistical information to support public debate, decision-making and research.
Relevance: Evaluation evidence demonstrates a continued need for the program. As evidence is critical in a knowledge-based society, there is a need for timely, accessible and relevant statistical data on the health of Canadians.
Delivery of the HSP by the federal government is consistent with its roles and responsibilities as it enables global action on social determinants of health to foster social justice and equity in health. Statistics Canada is one of the five federal government organizations that supports the federal government in its health mandate. Moreover, the health and well-being of Canadians have been identified as a priority in every federal budget from 2011 to 2015. The 2011 Speech from the Throne underlined the importance of collaboration between key partners. Evaluation findings confirmed the alignment of HSP activities with the most pressing needs and priorities in HSP areas of responsibility.
Delivery of the HSP by the federal government is consistent with its roles and responsibilities as it enables global action on social determinants of health to foster social justice and equity in health. Statistics Canada is one of the five federal government organizations that supports the federal government in its health mandate. Moreover, the health and well-being of Canadians have been identified as a priority in every federal budget from 2011 to 2015. The 2011 Speech from the Throne underlined the importance of collaboration between key partners. Evaluation findings confirmed the alignment of HSP activities with the most pressing needs and priorities in HSP areas of responsibility.
Performance: The potential impact of the program is directly correlated with the quality and relevance of the statistical information that is available. In this regard, the evaluation reports on each dimension of quality of the statistical information available, from the accuracy of the information to the extent of its use.
- Accuracy: The evaluation findings confirmed that the HSP statistical information is accurate despite challenges related to declining response rates. The exclusion of key demographic groups and geographic regions have been noted as a possible limitation to the generalizability of research and development of appropriate policies and programs focusing on those groups and regions.
- Timeliness: Overall, the HSP encountered certain challenges in meeting release dates, notably with vital statistics, cancer products and CCHS–Nutrition. However, the products for two of the main components, the CCHS–annual and the CHMS, were mostly released on time. The timeliness issue impacted user satisfaction and the responsiveness of the HSP.
- Accessibility: The evaluation findings confirmed that accessibility, in terms of availability of products and means of access, has increased and improved over time, and that products are of interest. There is a general sense that mechanisms for information dissemination are functional—they meet users' basic needs. However, it was suggested that more can or should be done by Statistics Canada to facilitate access. Key informants raised issues related to accessibility, including those associated with confidentiality/privacy clauses within the Statistics Act, data sharing agreements (DSAs), research data centres (RDCs) and Statistics Canada's website.
- Coherence: Although some decisions about changes in surveys were made over time, there are no issues with the coherence of the HSP statistical information. Additional information is provided to support user information needs as they relate to changes and their impact on coherence. HSP management demonstrated commitment in managing coherence. The trade-off between coherence and relevance is managed adequately in the decision-making process.
- Interpretability: The evaluation findings confirmed that the interpretability of the HSP statistical information is deemed adequate, most notably with high quality metadata and documentation. The HSP has provided data users with the required user documentation.
- Data relevance: The analysis demonstrated that the HSP consults with its stakeholders to identify the changing or emerging needs and requirements of users, as well as potential information gaps, and addresses them accordingly. The evaluation found that the HSP as a whole, including its specific survey programs and administrative datasets, is able to provide health statistical information that meets stakeholders' information needs and priorities. However, while continued efforts are deployed by the HSP to meet stakeholders' needs via consultations and reviews, some gaps in alignment with needs were identified by the evaluation. The more frequent and emerging needs expressed were in regard to the concept of big data and determinants of health, lack of geographic data, increased need for administrative data linkage and longitudinal data. Other identified needs were for:
- research on health equity, social determinants of health, and the broader concept of wellness;
- data, more data or more frequent data collection on specific topics, including environmental exposure, pharmaceutical use, disabilities, mental health, institutionalization, nutrition (primarily consumption patterns), health needs of refugees, health needs of veterans, aging, birth defects, cancer screening, children's health, and First Nations health;
- data/research that captures health outcomes;
- patient-oriented research;
- larger survey sample sizes, and the inclusion of key demographic groups and regions; and
- technologies for human measurement (e.g., technologies for measuring chemical exposure in humans, genotyping).
Use of statistical information: Overall, the HSP data are used by all levels of government to fulfill their mandates and responsibilities, by researchers, by international organizations, by non‑governmental organizations, and by Canadians. At Statistics Canada, the HSP data are used as inputs to other statistical and research programs.
Efficiency and Economy: The evaluation's evidence confirms HSP management's commitment and good practices to offer quality outputs that meet overall needs and priorities. However, some issues related to partnership with key federal players and collaboration with provinces/territories as well as a decline in response rates and technological challenges have been identified as key factors that affect efficiency and program outcomes (i.e. timeliness).
Preliminary results of the pilot project launched in 2013/2014, to address the recommendations of the previous CHMS assessment appear promising. The project collects financial information by survey cycle based on processes and activities to improve measurement of efficiency. The results confirmed that the approach will make it possible to analyze costs of one survey cycle against another cycle by survey process phase.
Conclusions and Recommendations
Overall, the HSP has generally met the needs and priorities within budget, and generated the expected outcomes, namely providing access to high-quality, relevant statistical information to support public debate, decision-making and research.
Based on the evaluation findings, there is a recognition that the program must also ensure that the relevance of the statistical information is maintained by focusing on needs analysis versus capacity (surveyed populations, health determinants, collection frequency for certain themes). Lastly, the challenge of declining response rates with respect to accuracy must remain a priority for planning.
The evaluation's findings also show that the HSP encountered challenges in meeting release dates with vital and cancer statistics.
Recommendation 1:
Performance (timeliness)
Within the context of the relationship with provincial and territorial data providers, it is recommended that the Health Statistics Program take measures to improve the timeliness of the vital and cancer statistical information in order to meet target release dates and fulfill its mandate.
Issues were raised with respect to the current relationship with federal partners, particularly: 1) a perceived deterioration of the partnership in recent years, which has come to resemble a client relationship; 2) a lack of involvement and information sharing in the decision-making process; and 3) challenges with respect to data sharing agreements.
Recommendation 2:
Performance and efficiency (partnerships)
It is recommended that the Health Statistics Program work with its federal partners to improve the partnership approach. Particularly, this includes engaging with partners to review the current governance structure with respect to roles and responsibilities, the decision-making process, communications and expectations for data sharing.
1. Context
As Canada's national statistical agency, Statistics Canada plays a fundamental role in generating information on Canada's socioeconomic conditions. Statistical data are used to support government decision-making at all levels by describing changing events, enabling analysis of policies and programs, and monitoring program outcomes. Some data produced by Statistics Canada are also required by legislation.
The Health Statistics Program
The mandate of the Health Statistics Program (HSP) is to provide accurate, timely and relevant information about the health of Canadians. The Health Statistics Division (HSD), in collaboration with Statistics Canada's Health Analysis Division (which is not included in the scope of this evaluation), provides statistical analysis and information about the health of the population, the determinants of health, and the scope and use of Canada's health care resources. This information is used to assist and support health planners and decision-makers at all levels of government, to sustain demographic and epidemiological research, and to report to the Canadian public about their collective health and health care system performance.
HSD works in partnership with provincial and territorial vital statistics registrars and cancer registries, as well as data providers and users at the federal level—Health Canada and the Public Health Agency of Canada (PHAC)—provincial level (provincial ministries of health) and regional level (health regions). The program also works with many other partners, including the Canadian Institute for Health Information (CIHI) to provide statistical information on, and undertake research and analysis on the health status of Canadians and the health care system.
The HSP's activities can be divided into the following three broad areas by key survey and data productFootnote 3:
- Statistical and Administrative Programs
- Canadian Community Health Survey (CCHS)
- Canadian Health Measures Survey (CHMS)
- Vital Statistics
- Cancer Statistics Program – Canadian Cancer Registry (CCR)
- Products and Services
- Integration and Analysis
- Client Services and Dissemination
- Special Projects and Initiatives
- National Routing System (NRS)
- Canadian Coroner and Medical Examiner Database (CCMED)
- Neurological Survey Program
- Survey of Living with Chronic Diseases in Canada
- Long Term Care Facilities Survey (LTCFS)
- Canadian Health Survey on Children and Youth
About the Evaluation
An evaluation was conducted as a neutral assessment of the relevance and performance of the HSP, in accordance with the requirements of the Treasury Board of Canada's Policy on Evaluation (2009).Footnote 5 The objective of this evaluation was to assess whether HSP provides quality key statistical information that is being generated efficiently and that responds to user needs.Footnote 6
The evaluation covered the period from April 1, 2011, to March 31, 2016, focusing on HSP's activities and associated custom products and services. A mixed-method approach, integrating quantitative and qualitative evidence, was used with a total of 15 evaluation questions as part of the strategy to assess the core issues related to the relevance and performance of the program.Footnote 7 Multiple lines of evidence were employed, including
- document and literature reviews;
- an administrative data review;
- key informant interviews with 58 internal and external stakeholders from the public sector [federal, provincial and municipal], the private sector, non‑governmental organizations and academia;
- a survey of 325 data users who were knowledgeable about the program and its products; and
- a bibliometric and webometric study.
Logical and statistical analysis were used, and findings were correlated to identify trends and patterns. Data from these sources were analyzed and triangulated to develop the conclusions and recommendations.
The evaluation encountered limitations, which were mitigated with the strategies described below.
| Limitations | Mitigation Strategies |
|---|---|
| High-level coverage of a complex, large-scale statistical program – Because of the nature, scope and reach of the HSP, it was a challenge to capture the broad range of users and areas of use in the evaluation consultations. | This challenge was addressed by using a careful selection of key informants based on their knowledge of the subject matter and program, and by conducting a user survey that polled 325 data users. Moreover, the calibration of the scope took the Canadian Health Measures Survey (CHMS) 2012/2013 evaluation, which covers a large part of the HSP, into consideration. |
| Analysis of efficiency – The current structure of the financial information, which is on an operational basis rather than on a project basis, limits the analysis of the impact of issues and initiatives on the cost and total budget of survey activities. | To alleviate this limitation, the current evaluation followed up on a pilot project resulting from the previous evaluation of the CHMS, which has been initiated to gather financial information at a more detailed level. |
| User satisfaction information – These is no coherent timely information on user satisfaction at either the program or organization level to report on specific program users' needs and satisfaction with program outputs and services. | This challenge was addressed by implementing an HSP user survey to identify user needs and satisfaction. |
2. Findings: Relevance
This section summarizes evaluation findings that emerged from the data collection process. It focuses specifically on the relevance of the Health Statistics Program (HSP) by exploring the demonstrable need for the program, its alignment with government priorities, and its consistency with the roles and responsibilities of the federal government.
2.1. Continued need for the Health Statistics Program
Summary
Evaluation evidence demonstrates a continued need for the HSP. As evidence is critical in a knowledge-based society, there is need for timely, accessible and relevant statistics on the health of Canadians. The data produced by the HSP support evidence-based decision-making by informing various aspects of the health sector related to legislation, funding arrangements, program and policy development, planning, management, and performance evaluation for organizations directly responsible for health and health governance, as well as for diverse groups of users, including individual citizens.
Health, as defined by the World Health Organization, is “a state of complete physical, mental and social well-being and a resource for everyday life.”Footnote 8 In contemporary knowledge-based societies, health has been recognized as a key factor for economic prosperity, a human right, a global public good, and an issue of social justice and equity. Consequently, “governments, businesses, communities and citizens increasingly engage in governance for health.”Footnote 9 Since evidence is critical in a knowledge-based society, there is a need for timely, accessible and relevant statistical data on the health of Canadians for measuring and reporting on public interventions, supporting evidence-informed action, designing interventions, and providing accountability.Footnote 10 As noted in the Report from the Fourth Consensus Conference on Evaluating Priorities for Canada's Health Indicators, “with respect to health data, the mandate of Statistics Canada is to focus on pan-Canadian population data (as opposed to data collection based on interventions or care delivery). Within this mandate, the objective is to have high-quality data so that the indicators and measures developed from them have strong integrity.”Footnote 11
Research suggests that, as a result of steadily increasing health care costs and of many nations recognizing the unsustainability of the traditional biomedical model of health care, there is an increasing need for reorientation of the health sector toward health promotion.Footnote 12 “Health promotion takes a systematic approach to empowering populations to gain control of the variables that influence health. This perspective advocates for an investment in multidimensional upstream factors, promoting social, individual, environmental, and political health as a proactive measure and a basic human right […].”Footnote 13 This trend develops simultaneously with a growing interest and emphasis to other health-related research aspects, such as population health, population health intervention, and health equity. The aspect of equity has become especially important since the 2008 report “Closing the Gap in a Generation”. According to the WHO, health inequalities within populations are largely a result of conditions in which people live, grow, work, and age and the systems put in place to deal with illness (World Health Organization, 2010). These conditions are commonly referred to as social determinants of health (SDOH). With the increased focus on the aspect of health inequality and the social determinants contributing to it, the need for data to measure health inequalities and the SDOH also increases.Furthermore, “the understanding that health is determined as much or more by social, economic, environmental and cultural factors than it is by genetic or medical factors”Footnote 14 means that, in order to inform action on reducing the health inequalities, there is a need for health data linked to factors such as income, level of education, occupation, social hierarchy and housing. Moreover, since these factors relate closely to Canadian communities and influence diverse population groups, there is a need for health data at a lower level (small geographies and populations), in order to support activities and interventions at regional levels.
Last, but not least, “to ensure that Canadians continue to have access to high-quality health care, and benefit from effective health policies, the country's health researchers and system innovators need to make effective use of health and health-related data, including administrative health and social data. This need will increase in the future as technology continues to develop and digitized data […] become ever more abundant.”Footnote 15
In the future, the need for health information is expected to increase, as implied by the conclusions and recommendations of a report by the European office of the World Health Organization (WHO)Footnote 16 on the new health policy Health 2020. As stated in the report, “evidence is critical in a knowledge-based society. […] Similar to other fields of governance, independent expert bodies, such as federal agencies, commissions, regulators and auditors, are playing increasingly vital roles in providing evidence, watching ethical boundaries, extending accountability and strengthening democratic governance in health, as related to privacy, risk assessment, quality control and health technology and health impact assessment. Their importance increases as one moves to a knowledge-based society with more rapid innovation. The literature also indicates, however, that metrics must be improved, for example, by including both objective and subjective measures, to capture what is happening to most people and to the most disadvantaged people.” Furthermore, the report mentions the future trend for the increased role of health promotion, and consequently, the “joint action of health and non-health sectors, of public and private actors and of citizens for a common interest.”
Health information is needed not only by organizations directly responsible for health and health governance, but also by diverse groups of users, including individual citizens. One of the recommendations of the WHO report, “A commitment to 'the informed citizen' and to citizen participation” explicitly talks about future needs for health information—implementation of new information and communication technologies, open-data initiatives and tracking systems that ensure better public accountability for health in all sectors; digital governance (e-governance) approaches as well as a comprehensive strategy to strengthen health literacy.Footnote 17
The mandate of the HSP to provide accurate, timely and relevant information and analysis about the health of Canadians is relevant to inform various aspects of the health sector for organizations directly responsible for health and health governance, as well as for diverse groups of users, including individual citizens.
2.2. Alignment with government and key partners' priorities
Summary
The health and well-being of Canadians has been identified as a priority in every federal budget from 2011 to 2015. The 2011 Speech from the Throne underlined the importance of collaboration between key partners. Evaluation findings confirm the alignment of HSP priorities with the most pressing needs and priorities in their areas of responsibility.
All federal budgets from 2011 to 2015, as well as the Speech from the Throne in 2011, 2013 and 2015 mention the health and well-being of Canadians as one of the priority areas. In addition, the 2011 Speech from the ThroneFootnote 18notes the importance of collaboration between the federal government and the provincial and territorial governments to ensure the sustainability of the health care system and accountability of results.
The HSP is responsible for key sources of information on population health—such as population surveys, administrative programs and health indicators—which support health administrators in the federal, provincial and territorial governments, as well as in health regions. The information is used as a source of input for policy and legislation development by federal, provincial and territorial governments and by various health agencies, including the Public Health Agency of Canada (PHAC), Health Canada (HC), the Canadian Institute for Health Information (CIHI), the Canadian Institutes for Health Research (CIHR), the Canadian Partnership Against Cancer, the Canadian Cancer Society and the Vital Statistics Council. The HSP's role as one of the key national data providers of health information has been confirmed by the recently developed national Health Data Strategy, for which Statistics Canada has been identified as a leader for two of the key national priorities (children's health and the social domain record linkage environment) and as a contributor to filling most of the 19 nationally significant data gaps identified by the strategy.
Moreover, Statistics Canada's HSP has been collaborating with the other federal organizations which provide health information (HC, PHAC, CIHI and CIHR) in determining the priority areas and strategic directions for national health information and indicators. While the availability of, and access to, health data have improved dramatically in recent years, as a result of recent collaborative efforts, a number of challenges identified during the Roadmap InitiativeFootnote 19 still persist, such as fragmented health data, incomplete data, inaccessible data and data analysis gaps.
The five organizations have collectively looked at health data availability, data gaps and how best to work together to address those gaps (Health Data Strategy). Consequently, in order to respond to needs and priorities, the following initiatives have been identified for the HSP at Statistics Canada. These initiatives align with the 2014/2015 Statistics Canada Corporate Business Plan as well as with the priorities raised by the Health Information Advisory Committee as follows:
- Facilitate access to Vital Statistics data by linking death data to the Discharge Abstract Database (DAD), which will reduce duplication of efforts between CIHI and Statistics Canada.
- Conduct a pilot survey on the health of children and youth in collaboration with Health Canada and the Public Health Agency of Canada.
- Make effective use of the new Social Data Linkage Environment (SDLE) to extend health record linkage to other social statistics domains such as education and justice. This new environment, now in production, will help reduce fragmented health data sources as well as increase the analytical potential of health data in responding to emerging policy needs.
2.3. Consistency with federal roles and responsibilities
Summary
Delivery of the HSP by the federal government is consistent with its roles and responsibilities as it enables global action on social determinants of health to foster social justice and equity in health. Statistics Canada is one of the five federal government organizations that support the federal government in its health mandate. However, key informants identified confusion over the role of the HSP versus other federal government organizations in the area of health information.
Under the Statistics Act, Statistics Canada is required to “collect, compile, analyse, abstract and publish statistical information relating to the commercial, industrial, financial, social, economic and general activities and condition of the people.”Footnote 20 In support of this requirement, the HSP contributes to the federal government's “government affairs” outcomeFootnote 21 by playing a role in Statistics Canada's two strategic outcomes: “Canadians have access to timely, relevant and quality statistical information on Canada's changing economy and society for informed debate, research and decision-making on social and economic issues,” and, “Specific client needs for high-quality and timely statistical services are met.”Footnote 22 To achieve this, the HSP is specifically designed to provide access to quality and relevant statistical information and associated services, which are used to inform public debate, research and decision-making.
The 2008 report of the World Health Organization (WHO) Commission on Social Determinants of Health (CSDH) appealed to national governments worldwide “to lead global action on the social determinants of health in order to promote social justice and health equity among all populations.”Footnote 23 Moreover, Pathak et al. (2012) summarized findings from previous research that “the fragmented structure of governance has created formidable barriers even to communication between local, provincial and federal governments” and argued that, to overcome structural and ideological barriers, “there is a need for a comprehensive national agenda to integrate efforts across all sectors and at all levels of governance to address social determinants at a system-wide level in Canada.” Globally, the literature review found evidence for this role, but it was also clearly demonstrated that the involvement of other jurisdictions and organizations (provinces, territories, regional and municipal governments, health-quality councils, and other health organizations) is crucial in addressing a field that cuts across multiple aspects of society—as does health.
In Canada, Statistics Canada and the Canadian Institute for Health Information (CIHI) jointly fulfill the role of producing national health data and indicators related to health. The distinction in the roles is that CIHI is mandated to lead the development and maintenance of comprehensive and integrated health information that enables sound policy and effective health system management,Footnote 24 while Statistics Canada (e.g., the HSP) provides information about the health of the Canadian population, the determinants of health, and the use of Canada's health care resources.
Based on the review of international publications, the national governments (e.g., the national statistical institutions) take on the role of producing health statistics. In Canada, this is done by the HSP (this includes, for instance, the core set of health indicators suggested by the WHO that are collected and used globally and nationally). As a comparison, in the United States, these functions are carried out by one centralized organization—the National Center for Health Statistics (NCHS) - which collects information on population health and the health care system.
Key federal partners and advisors were asked to comment on the appropriateness and clarity of the federal government's current role in providing health statistical information through the HSP. Overall, most of these key informants agreed that the role of the HSP is both appropriate and well-defined. However, nearly one‑half of these key informants expressed some confusion about how the roles of the various federal health information organizations, including Statistics Canada's HSP, differed from one another and, in particular, differed from the CIHI.
3. Findings: Performance
This section summarizes the evaluation findings related to the achievement of the program's expected outcomes. Its covers questions related to performance and focuses on the extent to which quality statistical information and support are accessible, and the extent to which information is relevant and used. Statistics Canada's Quality Assurance Framework (QAF)Footnote 25 and quality guidelines define quality as encompassing six important related dimensions: accuracy, timeliness, accessibility, coherence, relevance and interpretability. These elements are consistent with internationally accepted standards for assessing the effectiveness of statistical programs.
To manage quality, the agency must balance these quality elements against the constraints of financial and human resources, the goodwill of respondents in providing source data, and competing demands for information in greater quantities and in greater detail. The potential impact of the program (i.e., the extent to which the information is used in the decision-making sphere) is directly correlated with the quality and relevance of the statistical information that is available. In this regard, the evaluation report outlines each quality dimension of the statistical information available, from the accuracy of information to the extent of its use.
3.1 Accuracy
Summary
The evaluation findings confirm that the HSP statistical information is accurate despite challenges related to declining response rates. The exclusion of key demographic groups and geographic regions has been noted as a possible limitation to the generalizability of research and the development of appropriate policies and programs focusing on those groups and regions.
The accuracy of statistical information is the degree to which the information correctly describes the phenomena it was designed to measure. It is usually characterized in terms of error in statistical estimates and is traditionally decomposed into bias (systematic error) and variance (random error) components. It may also be described in terms of the major sources of error that potentially cause inaccuracy (e.g., coverage, sampling, nonresponse, response).
Source: Statistics Canada (2002)
According to the agency's 2009 quality guidelines,Footnote 26 for a data product to be accurate, appropriate methods and tools must be used to produce the results. These include choosing sampling methods, encouraging accurate responses, following up on non-response to surveys, dealing with missing data, and measuring response rates and sampling error.
Overall, evaluation findings confirm the accuracy of the HSP statistical information resulting from adequate processes and program efforts and initiatives to overcome challenges. Furthermore, most key informants consider the HSP's statistical information to be highly accurate. For some key informants, this belief stems from their own personal scrutiny of the agency's information products (i.e., their determination that information products are free of significant errors or their perception that errors are corrected quickly when identified), while others cited Statistics Canada's expertise, reputation, attention to detail, or other factors (e.g., high response rates). The high level of interviewees satisfied with the accuracy of the HSP products confirm this trend.
We do realize that in terms of survey data there has definitely been a decline in response rates, and people are not as enthusiastic about answering surveys anymore, so perhaps there is somewhat less information because of these response rates being slightly lower.
Source: Interview
However, the HSP is facing a challenge with declining response rates. Some key informants remarked that there has been a gradual reduction in survey response rates, which they noted has the potential to compromise data quality. Interviewees attributed this to broader social and cultural circumstances beyond Statistics Canada's direct control.
The declining trend in the response rate of the CCHS–annual in the past 15 years (Figure 1) is one illustration of this phenomenon. The program is trying to mitigate the impact of this trend, for example, through outreach and promotion and by using a weighting methodology to adjust and correct non-response bias. More generally, Statistics Canada is considering other options, such as making social surveys mandatory, increasing monetary incentives to participate, contacting respondents by cell phone, and making surveys accessible online. The HSP is part of these efforts: in particular, after the Canadian Community Health Survey redesign, the survey will use improved sampling strategy and one sample frame, and will offer an electronic collection option (in 2017).
Figure 1: Canadian Community Health Survey response rates over time

Source: Statistics Canada (2015), new sampling and collection strategy in the 2015 Canadian Community Health Survey redesign, HMSD seminar June 30, 2015.
Description for figure 1: Canadian Community Health Survey response rates over time
This line graph shows response rates for the Canadian Community Health Survey broken down by collection method for selected years over the period 2001 to 2013
2001
response rate, computer - assisted telephone interviewing: 84%
response rate, computer - assisted personal interviewing: 88%
response rate, total: 88%
2003
response rate, computer - assisted telephone interviewing: 78%
response rate, computer - assisted personal interviewing: 84%
response rate, total: 81%
2005
response rate, computer - assisted telephone interviewing: 75%
response rate, computer - assisted personal interviewing: 83%
response rate, total: 79%
2007
response rate, computer - assisted telephone interviewing: 73%
response rate, computer - assisted personal interviewing: 82%
response rate, total: 78%
2008
response rate, computer - assisted telephone interviewing: 71%
response rate, computer - assisted personal interviewing: 79%
response rate, total: 74%
2009
response rate, computer - assisted telephone interviewing: 71%
response rate, computer - assisted personal interviewing: 76%
response rate, total: 73%
2010
response rate, computer - assisted telephone interviewing: 68%
response rate, computer - assisted personal interviewing: 76%
response rate, total: 71%
2011
response rate, computer - assisted telephone interviewing: 67%
response rate, computer - assisted personal interviewing: 74%
response rate, total: 70%
2012
response rate, computer - assisted telephone interviewing: 64%
response rate, computer - assisted personal interviewing: 72%
response rate, total: 67%
2013
response rate, computer - assisted telephone interviewing: 63%
response rate, computer - assisted personal interviewing: 73%
response rate, total: 67%
Along with this promising information, the program documents note some challenges and gaps related to maintaining accuracy, namely:Footnote 27
The fact that the [nutrition component of the CCHS] does not include the North is an issue for different parts of [our department] depending on [its] mandate these are very vulnerable groups and there is very little information about them.
Source: Interview
- Lack of validation studies on new or revised content. The validation is limited to qualitative testing only, which limits the ability to influence/persuade other organizations or countries to use the same questions.
- Reduction in the number of computer-assisted personal interviews (CAPI) is often seen as a solution to budget constraints. However, this has an impact on the quality of results.
- Evaluation studies often remain internal to Statistics Canada and they are often limited to empirical results.
In another vein, some key informants identified accuracy issues relating to the exclusion of key demographic groups and geographic regions from HSP data collection activities, which they noted not only affects the generalizability of research drawing upon HSP statistical information, but also makes it much more difficult to undertake research and/or develop appropriate policies and programs focusing on those groups and regions. One such example is regional-level data, often requested by interested data users and a known CHMS gap. Unfortunately, as stated by HSD, due to cost and logistics, this survey is conducted at the national level only and at this point there is no funding to consider expansion.
When you read the fine print you find that military bases, First Nations, and long-term care facilities/hospitals aren't included—all of which are populations we know are more likely to have mental health issues. This should be acknowledged in the body of the report rather than in the fine print in a footnote.
Source: Interview
CCHS users requesting more samples were encouraged by HSD to seek funding to cover the additional costs of a larger sample because the CCHS sample is already as large as the budget allows. Many cost estimates have been provided by HSD over the years, but no one has been successful in obtaining the required additional budget.
In the vital statistics area, the adoption of the National Routing System (NRS) by most provinces for the transfer of vital events data to the Canadian Vital Statistics Program (VSP) contributed to improving data accuracy. The transition revealed some systematic differences in the data collected in the provinces. The data have been updated, which resulted in reductions in errors and required manual interventions.Footnote 28
3.2 Timeliness
Summary
Overall, the HSP encountered certain challenges in meeting release dates, notably with vital statistics and cancer products. Other delays, such as the ones observed in the CCHS – Nutrition, was also attributed to a tighter release schedule. The objective of the revised schedule was to deliver sooner than previous practice. However, the products for two of the main components, the CCHS–annual and the CHMS, were mostly released on time. The timeliness issue had an impact on user satisfaction and the responsiveness of the HSP.
The timeliness of statistical information refers to the delay between the reference point (or the end of the reference period) to which the information pertains, and the date on which the information becomes available. It is typically involved in a trade-off against accuracy. The timeliness of information will influence its relevance.
Source: Statistics Canada (2002)
The HSP experienced some challenges meeting the timeliness targets, although this was also specifically singled out as a dimension of quality that key informants believe has improved in recent years. The two major components (CCHS–annual and CHMS) released their products mostly on time, while the releases of the Vital Statistics Program, Cancer Statistics, and CCHS–Nutrition have been delayed.
The CCHS–annual component releases were mostly timely, with 11 out of 14 releases on time from 2012 to 2015. The three delayed releases were in 2012 (two) and 2013 (one). The HSP innovated with the implementation of the Rapid Response files, which consist of cost-recovery questions collected over two or four months and are released three to six months after collectionFootnote 29for timeliness.
From a nutrition perspective, the lack of predictability of having a regular nutrition survey is an issue. And if you had a long lead time to know that they weren't going to be available, we could decide if we should go out into the field and do a quick survey ourselves to get a feeling for what some of these might be.
Source: Interviews
With regard to the CCHS focus component, some key informants viewed the frequency of data collection as problematic, particularly in the context of CCHS focus components related to nutrition and mental health that are undertaken several years apart from each other (e.g., mental health was the Focus Content Component for the 2002 and 2012 surveys, while nutrition was studied in the 2004 and 2015 surveys).
The CHMS releases were mostly timely with 10 out of 14 releases on time from 2012 to 2015. The four delayed releases were all in 2015. With the goal to release data as soon as possible, the program's management made a decision to release some analytical products (fact sheets and health report articles) later than their corresponding data.Footnote 30
According to the Program Consultation Feedback Annual Report (2015), stakeholders have significant input into the ways that these surveys are developed and are pleased with this aspect. However, there are three years between the selection of a topic and the release of data and the stakeholders regularly question why everything takes so long.
In terms of vital statistics, births in the database were mostly timely, with 10 out of 15 releases on time from 2012 to 2015. The 5 delayed releases were in 2012 (3) and 2014 (2). In terms of the deaths database, none of the 6 releases from 2012 to 2015 were on time. Vital statistics had one of the highest levels of dissatisfaction in the user survey, at 22% (22/114) of respondents. The interviewees confirmed the same issue.
The birth, death and fertility counts are not up to date. We are basing ourselves on the year 2012, and this is causing us problems with the provinces, since our estimates are of lesser quality than before.
Source: Interviews
The things we really need that have to be timely [...] it's the up-to-date mortality files across the country. We were looking into accessing that—the most recent file available is 2011. There is no new data we can use for the purposes of our research and it's an important element.
Source: Interviews
The timeliness of the vital events data has been identified as a risk in the 2011 Program Performance Report (PPR). The report states that the vital events have been routinely behind schedule due to inefficient data processing practices and the inability of some provinces to provide the data to Statistics Canada in a timely manner. Even though the National Routing System (NRS) has the potential to provide these data in almost real time, not all jurisdictions use the system. The consequences include the possibility of releasing partial (but timely) national data, or releasing the complete data at a later time.
I know it's been a long time since the survival data have been updated, and I know it's a process that's being worked on to try to get those agreements in place to enable the vital statistics database to talk with the cancer registry database so that some of the really important information, such as survival data, can be analyzed. So that, I think, is something that I know is important looking forward: just having quicker access to data.
Source: Interviews
Since 2011, Statistics Canada has been working on negotiating new agreements (including new funding models) with each province/territory to adopt the NRS as the mandatory mechanism for providing input to the agency. The program expects to conclude agreements with all jurisdictions by 2016/2017 instead of by 2012/2013 as initially planned.Footnote 31 In 2016/2017, the program is working on implementing the NRS for the territories, as well as developing messages for all provinces about submitting stillbirth data through NRS. Currently, five provinces are sending stillbirth data through the NRS, and work is under way in another jurisdiction.
Since 2012, there have been delays in the release of the death file further to a processing backlog resulting from the transition to the Social Survey Processing Environment (SSPE). The operational plan prescribes improvements of the data collection and data processing practices by working with data providers (provincial/territorial vital statistics registrars) and client service areas (Operations and Integration Division and Processing), and it was expected that by 2016 the program would put the release schedule on track (now scheduled for 2017). The improvement in timeliness of vital statistics (and specifically the death file) is important for Service Canada's requirement to provide more organized information and services to the families of the deceased. Delays in data releases also have an impact on stakeholders such as the Canada Revenue Agency.Footnote 32
From the Canadian Cancer Registry perspective, data timeliness is a concern for people. Because by the time that we've collected it in our own registries, provide it to Statistics Canada, we've all gone through the whole editing/cleaning the data, and then making it available to others, it is too long. Within the registry world, there is certainly talk about how to minimize that time frame as much as possible, so that the data are available for people much more quickly. Timeliness in our world is definitely an issue, and not just a Statistics Canada issue, but how quickly we can get the information from the provinces as well.
Source: Interviews
In an effort to improve timeliness, the HSP is working with Statistics Canada methodologists to assess the quality of the preprocessed data and whether it can be helpful as a type of flash estimate while the data are being processed. In addition, the U.S. National Center for Health Statistics is moving to quarterly data releases—HSP management is consulting with them to understand how they have overcome timeliness issues when dealing with their data providers (at the state level) to find out if they have any best practices that can be adopted.
None of the four cancer statistics data releases from 2012 to 2015 (one each year) were on time. The lack of timely releases of cancer statistics was reflected in the user survey: 27% (18/67) of respondents were dissatisfied with the timeliness of these releases. The interviewees confirmed the same problem. Several concerns related specifically to the timeliness of vital statistics and the Canadian Cancer Registry (CCR) were identified.
According to the HSP, the Cancer Registry data are high quality, however given the large number of partners and differences in the way the source data are processed and submitted, they do take time to produce. In addition, the unit has done some necessary retooling to processing, and although that will lead to gains in timeliness, the initial implementation took longer than planned and led to significant delays.
Lastly, some key informants mentioned that it would be helpful for Statistics Canada to take action that would reduce uncertainty associated with the timing of data collection and the release of information products—they suggested publishing a release schedule in advance and/or providing advance notice when delays are expected to occur.
3.3 Accessibility
Summary
The evaluation findings confirm that accessibility—in terms of availability of products and means of access—has increased and improved over time, in correlation with the products. There is a general sense that mechanisms for information dissemination are functional—they meet users' basic needs. However, it was suggested that more can or should be done to facilitate access.
The HSP's products are available to users in a number of formats. Primary access to these products is via the Statistics Canada website, where users can find such items as Daily articles, Canadian Socio-Economic Information Management System (CANSIM) tables, summary tables, publications and reference documents. HSP products can also be accessed using custom data tabulations, public use microdata files, research data centres (RDCs) (for microdata or aggregate data), Real Time Remote Access (RTRA) and, for some surveys, the Data Liberation Initiative (DLI).
For instance, the CHMS microdata data files can be accessed at the RDCs located in over 20 universities across Canada. CHMS data documentation, including rounded data dictionaries and the Researchers' Guide, is available to academics and researchers affiliated with over 75 university libraries.
The CHMS Biobank repository is available to Canadian researchers who successfully complete a review process. Selected researchers are granted restricted access to conduct tests and studies using anonymous biospecimens. As of 2016, four approved Biobank projects are in progress and one has been completed. The topics of the approved projects are posted on the Statistics Canada website.
Users can also access data from the CCHS–annual component using various methods such as:
- tabular and analytical products available free of charge on Statistics Canada's website;
- master files accessed through Statistics Canada research data centres;
- share files sent to federal/provincial/territorial ministries of health (in most provinces, these can be shared with health region authorities);
- public use microdata files available to the general public;
- synthetic files produced for annual and two-year files for use with the free-of-charge Real Time Remote Access program; and
- custom tabulations.
Information on health indicators can be accessed through the health indicators main webpage, directly in CANSIM, through the rubric “What's New” on the Statistics Canada website, or through The Daily on release day. Outside the agency, the health indicators can be accessed from the master files at the RDCs, share files available to partners according to respective data-sharing agreements, or from other institutions' publications that use Statistics Canada health indicators to produce and publish estimates (e.g., CIHI). The strategic review of Statistics Canada's health indicators collected performance data from administrative sources, including the Webtrends tool.
Moreover, in the last five years, a number of efforts have been made to improve access to health data and products. For instance, in 2011/2012, the HSP completed several access-related activities as follows:
The accessibility of statistical information refers to the ease with which it can be obtained from the agency. This includes the ease with which the existence of information can be ascertained, as well as the suitability of the form or medium through which the information can be accessed. The cost of the information may also be an aspect of accessibility for some users.
Source: Statistics Canada (2002)
- Website redesign project: A new interface tool was created to allow health data to be extracted directly from CANSIM and manipulated in real-time by users, and webpage design was optimized to simplify the searching process for users.
- Administrative data project: Activities were undertaken in response to the high demand for data from the administrative programs available to researchers at the RDCs.
- New dissemination vehicles were developed to release health data to the general population. The Health Client Satisfaction Survey and other consultations with users identified a gap: while Health Reports is a highly regarded and popular product for advanced users, the information is not useful for the general public to a great extent. To address the gap, the HSP created a new publication called Health at a Glance, which was to be released periodically starting in 2011/2012.
- Following an update of its release policies, standards and guidelines, the HSP improved the access of key partners (HC, PHAC, Vital Statistics Council for Canada (VSCC), and Council of Canadian Cancer Registry (CCCR)) to advanced health data and product releases.
- New guidelines were developed for access to the CHMS Biobank to facilitate health research based on this resource.
Statistics on access (visiting the website, viewing products, downloading and accessing data) show that there is interest in HSP statistical products. Between 2012/2013 and 2015/2016, 6.9 million pages on health statistics (CANSIM tables, publications and summary tables) were viewed, compared with 64.8 million for Statistics Canada as a whole. Health Profile and Health Fact Sheets were the most popular publications, and interest in Health at a Glance increased throughout the period. It is worth mentioning that Health Profile (and also Health Trends) was discontinued because the New Dissemination Model will not be able to support such a product.
| Fiscal Year | CANSIM | Publications | Summary Tables | Total | ||||
|---|---|---|---|---|---|---|---|---|
| HSP | STC | HSP | STC | HSP | STC | HSP | STC | |
| 2012/2013 | 210,315 | 2,064,332 | 873,918 | 8,039,339 | 463,676 | 4,841,279 | 1,547,909 | 14,944,950 |
| 2013/2014 | 230,456 | 2,674,085 | 1,129,991 | 8,828,800 | 591,110 | 6,133,670 | 1,951,557 | 17,636,555 |
| 2014/2015 | 142,706 | 2,003,137 | 991,604 | 8,284,146 | 527,224 | 5,655,093 | 1,661,534 | 15,942,376 |
| 2015/2016 | 136,049 | 1,982,879 | 1,134,060 | 8,777,626 | 516,119 | 5,500,363 | 1,786,228 | 16,260,868 |
| Total | 719,526 | 8,724,433 | 4,129,573 | 33,929,911 | 2,098,129 | 22,130,405 | 6,947,228 | 64,784,749 |
Source: Statistics Canada, administrative databases Webtrends
The English Health Indicators main webpage (including the What's New rubric and the link to new and updated indicators) had over 20,000 views from May 2013 to October 2015, while the French webpage had 6,000 views. The top webpages—with at least 500 views—generated over 63, 000 total views. The Health Indicators publication, overall, was viewed 172,539 times from May 2013 to October 2015. This compares to Health Reports' 1.4 million visits during the same period. Among health-related publications it is sixth, behind Health Reports, Health Profile (discontinued), Health Fact Sheets, Health at a Glance, and Health Trends (discontinued). Of note, the Health Profile, a now discontinued publication that presented most health indicators together for a single geography, was seventh on the overall list with 560,296 views (and ninth in the first seven months of the 2015/2016 fiscal year).
For the same period (2012/2013 to 2015/2016), the number of downloads (of CANSIM tables and publications) for HSP and Statistics Canada products totalled 447,436 and 13.6 million, respectively, with a sizable increase over the period. Of the various publications, Health at a Glance was downloaded most often and saw an increase throughout the period.
I don't know that it's very innovative or user friendly, but I generally find what I need.
Source: Interviews
Numerous key informants acknowledged the progress the agency is making with respect to innovative approaches to access and dissemination. There is a general sense among key informants that mechanisms for information dissemination are functional, in that they meet users' basic needs. Furthermore, the survey of users confirmed that the level of satisfaction with the different means of access is generally high.
However, accessibility is one of the dimensions of quality that generates the most comments, suggestions and criticism.
This is corroborated by the national Health Data Strategy (HDS),Footnote 33 developed by the Health Information Advisory Committee, which concludes that “there is a need to rethink the best approach to make the data accessible to all. Currently access to data is an impediment to the food industry for potential innovation, to academics who cannot access the Research Data Centres outside regular hours and to Canadians for making informed decisions. Changing the Statistics Act is one way to resolve the access to data.” The HDS also suggested that the key federal health information organizations (CIHI, CIHR and Statistics Canada) should facilitate a meeting of researchers on data access issues to identify the barriers and to propose workable solutions to remove them.
Furthermore, many key informants suggested that more can or should be done to facilitate access, ranging from improving existing resources, to increased engagement with and support for data users, as well as increased availability of microdata currently accessible largely through RDCs. It was commonly raised that steps should be taken to improve overall access to microdata—in particular, there appears to be dissatisfaction with the current practice of restricting access to health statistical information to RDCs and a belief that this information should, to the extent possible, be made more widely available.
Challenges
Key informants raised issues related to accessibility, including the following:
Certainly sometimes data access is a big challenge with Statistics Canada, and I recognize that that's partly because of some very strict privacy and confidentiality guidelines, but sometimes it's very challenging and maybe more so than is ideal.
Source: Interviews
Confidentiality/privacy clauses within the Statistics Act
Access to HSP data is hampered by the Statistics Act, and, in particular, by the clauses within the Act that relate to privacy or confidentiality (or, alternatively, an overly cautious interpretation of those clauses by Statistics Canada).
It was suggested that Statistics Canada should recognize that some users of HSP data, such as key federal partners and provincial ministries of health, routinely deal with identifiable data and/or already have governance mechanisms in place with respect to confidentiality, implying that adjustments should be made to the procedures for gaining access to data for such users.
Data-sharing Agreements (DSAs)
Concerns about the processes involved in obtaining access to data through the establishment of DSAs were expressed, including the complexity and rigidity of the process and a perceived lack of focus by the HSP on the needs and priorities of its federal partners.
Research Data Centres (RDCs)
Challenges involved in accessing data through the centres were expressed by RDC users. These challenges include the time, energy and cost required to secure access, which could be greater for individuals who do not personally reside in cities where an RDC is located.
However, a few key informants observed that the challenges associated with accessing data through the RDCs are not only related to time, cost and geography, but also to the processes and requirements that Statistics Canada has in place to protect privacy and confidentiality. As such, accessibility issues with respect to the RDCs are related to this larger issue.
In the Internet world, you shouldn't have to go to an RDC to get data. It's surprising to me that with the emergence of the RDCs, access to data has become even more restrictive.
Source: Interviews
This issue was also raised during program consultation (2015). In terms of access, for instance, all CCHS clients specified that they would like access to the full master file from their office even though they understand the need for the share files and the research data centres (RDC program).
A small number of RDC users also recommended that more be done to keep researchers abreast of developments with the potential to influence their work, such as upcoming data releases or changes to data that are already available.
Statistics Canada's website
Issues were identified with respect to the accessibility of information on Statistics Canada's website—particularly difficulties with website navigation and search capabilities, even for experienced users.
Suggestions pertaining to the website typically related to changes that might improve the general findability of information, such as including additional tiers of subtopics, offering suggestions for related resources, or introducing a service that users can access when they are having difficulties locating information.
Comparison to other data providers
Key federal partners typically view Statistics Canada as comparable to CIHI in data accessibility, although a few described having relatively easier access to CIHI data. However, several key informants compared access to the HSP statistical information to information disseminated by statistical agencies in the United States. In particular, they argued that U.S. health data collected through the National Health and Nutrition Examination Survey (NHANES) is substantially simpler to access than comparable Canadian data, adding that changes to the Statistics Act would likely be required for a similar dissemination approach to be viable in Canada. Among interviewees (primarily users and experts) who work with or have knowledge about other data providers, Statistics Canada is generally viewed as comparable or superior to other data providers in the context of access to health statistical information.
The evaluation found evidenceFootnote 34 of ongoing initiatives put in place to improve accessibility and respond to some of these concerns, including the following:
- The program is exploring and developing ways (workshops, meetings, conferences, social media) to inform potential users about new data holdings and the various methods to access these holdings, in particular, CHMS developed a specific communication plan, with consideration of two streams of users (a broader audience and specialized academic audience).
- There is increased access to vital statistics and cancer statistics for analysis and research—more files available in the RDCs and RTRAs; new data products based on CCR record linkages with other sources (DAD, radiation therapy); data sharing agreements with the provinces to facilitate access to administrative data for research.
- New approaches to dissemination
The U.S. survey that is comparable to the CHMS makes their data publicly available so university researchers can access it. That's what researchers would love to see in Canada. I gather that this cannot be done with population health surveys under the Statistics Act.
Source: Interviews- Transition to the New Dissemination Model (NDM) of Statistics Canada: The Health Statistics Division Dissemination Renewal Task Force was created with the mandate to review HSD's current dissemination objectives, practices, processes and procedures and propose changes that reflect divisional priorities and new corporate requirements.Footnote 36
- With the implementation of the NDM, there will be improved accessibility to health indicator information (for example, allowing a view of a specific indicator in a table with pre-selected disaggregates rather than the full list of indicators), and improved accessibility to lower levels of geography (a maps-to-data interface to search within a map for a desired geography location level, resulting in links to any data, analyses, or documentation related to that level of geography). Currently indicators can only be accessed in Canada, province/territory, census metropolitan area, and health region levels.Footnote 37
- A special working group on dissemination of the results from the CCHS–Nutrition was created to identify dissemination needs and develop a plan to ensure that analysts have the relevant data and documentation.Footnote 35
- Maintain access and availability of high-quality publications (Health at a Glance releasing 8 to 10 articles in 2015/2016; continuing updates to Health Profiles, Health Indicators and Health Trends).Footnote 38
3.4 Coherence
Summary
Although some decisions regarding changes in surveys were made over time, there are no issues with the coherence of the HSP statistical information. Additional information about changes and their impact on coherence is provided to support user information needs. HSP management demonstrated commitment in managing coherence. The trade-off between coherence and relevance is managed adequately in the decision-making process.
Some changes made to the CCHS as of 2015 caused concern among data users. We wondered how we would be able to use the data from a continuity perspective. However, we're realizing that there are new indicators that were necessary. But a major change, like the one in 2015, followed by another in 2017 with the introduction of a new Internet collection mode is causing us some concern.
Source: Interviews
Regardless of all efforts and thoughtful considerations, there are situations where coherence cannot be maintained, for reasons such as significant and necessary changes of methodology, changes in infrastructure, or content framework. In this regard, the evaluation findings tend to demonstrate that the trade-off between coherence and relevance exists and is managed adequately in the decision-making process. Overall, most of the key informants were satisfied with the coherence of HSP statistical information. Even though some interviewees argued that the agency is sacrificing relevance for coherence and raised the potential implications of methodological changes, others acknowledged the need for change when and where the issues occurred.
One such example is the physical activity module of the CCHS, which has been completely redone. Thus the previous data are no longer comparable and a new trend will be created. With regard to the CCHS, a comparability issue resulting from the recent redesign of the survey was anticipated. In the first release after the redesign for the 2015 reference year (in June 2016), directly comparing the new data with the data released from 2001 to 2014 was not recommended. In such cases, program efforts are directed to providing enough information on the changes and their impact on the comparability/coherence of the data. The survey results confirmed user satisfaction with data coherency—for example, only 7% (16 out of 226) of CCHS–annual component survey respondents were dissatisfied with the coherency, which was 3 % (2 out of 66) and 3% (3 out of 96), respectively, for the CCHS focus components on healthy aging and mental health.
The dissemination plan for the 2015 CCHS–Nutrition survey takes into consideration the concordance and comparison issue with CCHS–Nutrition (2004) for both the foods and the vitamin and mineral supplements given that the coding systems have changed.Footnote 39 Moreover, the document review revealed that development of long-term content plans for two major surveys—CCHS (from 2015 to 2022) and CHMS (for Cycles 5 to 8)—helps with the objective to harmonize the content across surveys, as it allows for better coordination of the content, and, consequently, using coordinated definitions, instruments and standards as much as possible. Potential coherence issues are discussed by the Expert Advisory Committees and clarifications are made in order to harmonize the content and avoid duplications.
The coherence of statistical information reflects the degree to which it can be successfully brought together with other statistical information within a broad analytic framework and over time. The use of standard concepts, classifications and target populations promotes coherence, as does the use of common methodology across surveys. Coherence does not necessarily imply full numerical consistency.
Source: Statistics Canada (2002)
The coherence of the vital statistics data is facilitated by the legislation governing the collection of vital events information. More specifically, “Provincial and territorial Vital Statistics Acts (or equivalent legislation) render compulsory the registration of all live births, stillbirths, deaths and marriages within their jurisdictions. These acts follow, as closely as possible, a Model Vital Statistics Act that was developed to promote uniformity of legislation and reporting practices among the provinces and territories.”Footnote 40 Documents confirm that the Vital Statistics Program is keeping track of changes in provincial legislation so that any data adjustments can be implemented, if necessary.Footnote 41
As reported by the Program Consultation Feedback Report (2015), although the Canadian Cancer Registry (CCR) does a good job of providing pan-Canadian estimates for cancer incidence, treatment of cancer (surgery and radiotherapy) has been identified as a gap for the registry that needs to be filled. Two options are being investigated. The first is record linkage. This would involve bringing existing datasets together with the incidence data on the registry to form a more complete picture of cancer treatment in Canada. The other option is for the provinces to work with care providers to report the data directly to the provinces in a standard way across Canada; the data would then be compiled and added to the Canadian Cancer Registry. Should the record linkage result in insurmountable quality issues, primary collection will be explored. With a national registry, consistency and standardization are key because, in order to compare data across the jurisdictions, all data must refer to the same definitions and standards. Since there are multiple provinces and data providers, these consultations would most likely take a long time to conduct based on the length of time needed to negotiate standards that everyone can work with.
Overall, the 2015/2016 operational plan addresses the coherence of the data through the following actions:
- The Health Survey Content Coherence Committee was established to identify, discuss and resolve content coherence issues among population health surveys (at the questionnaire level). The committee meets monthly and is comprised of representatives from Health Statistics Division and Health Analysis Division.Footnote 42
- Participation in the departmental Harmonized Content Committee to improve coherence in collection and dissemination between surveys for similar concepts.
- Participation in the field working groups that may be formed to ensure consistency across surveys during the transition of collection activities to e-questionnaires and to the Integrated Collection and Operation System (ICOS).
- Completing a comparability study for the VSP Death database, between data coded using the new automated cause of death coding software (IRIS) and the one used from 2000 to 2012.
- Work on the update of age standardization within HDS products, in order to facilitate national and international comparison.
3.5 Interpretability
Summary
The evaluation findings confirmed that the interpretability of the HSP statistical information is deemed adequate, most notably with high-quality metadata and documentation. The Health Statistics Program has provided data users with the required guidance in the form of reference information.
They have data user guides for the CHMS and they're very comprehensive. But, for example I'm trying to find the Cycle 3 User Guide for the CHMS and it's taking a long time to find it.
Source: Interviews
The HSP develops and disseminates information about the definitions, methods and various quality characteristics that supplement the health statistics products and help users in the accurate interpretation and analysis of statistical information. Most interviewees were satisfied with the interpretability of statistical information generated through the HSP. In particular, they reported that the metadata and documentation provided by Statistics Canada is of high quality. However, a few interviewees identified issues in locating specific pieces of documentation they viewed as necessary to fully understand the data provided by Statistics Canada (access issue).
The high level of satisfaction with the CCHS–annual user's survey confirmed this trend, with 85% of the 226 interviewees satisfied with the interpretability of the data.
The interpretability of statistical information reflects the availability of the supplementary information and metadata necessary to interpret and utilize it appropriately. This information normally includes the underlying concepts, variables and classifications used, the methodology of data collection and processing, and indications or measures of the accuracy of the statistical information.
Source: Statistics Canada (2002)
The dissemination plan for the 2015 CCHS–Nutrition suggests that similar practices regarding the release of metadata will be employed—the plan includes activities such as developing the structure of the data users guides; user data training; and the production of supporting materials such as concurrent data user guides (if necessary), a revised set of derived variable specifications, a compendium of tables, and a set of CANSIM table specifications.Footnote 43
As stated in the Program Consultation Feedback Annual Report (2015), the CHMS fact sheets are one of the survey areas where the current products have difficulty meeting needs. According to the program area, given the complexity of the survey, it is difficult to write the fact sheets and make them available and understandable to the general public while, at the same time, still being of value to researchers. Statistics Canada regularly collaborates with experts at Health Canada and the Public Health Agency of Canada in an attempt to bridge these gaps. Moreover, in response to the new Statistics Canada policy (2014) that states each data release in The Daily should provide analytical information, it was noted that in each Daily article, links to CHMS metadata were provided along with the links to the data. More recently, the CHMS communication plan mentions Chat-with-an-Expert sessions (real-time online 1- to 1.5-hour discussions with experts from the program) as part of the support and promotion activities. However, challenges in interpreting results from the CHMS without a full nutrition module and geocoding were identified by federal partners.
We can't interpret the CHMS biomarker data fully given there is no strong nutrition module included.
The primary limitation to interpretability is that the data are currently not geocoded. The value and reach of the data would be exponentially improved by using GPS data linkages under the provision that the linkages can only be made by Statistics Canada employees.
Source: Interviews
The user supporting documentation for the vital and cancer statistics differs from the one related to population surveys as the production process is very different. The Canadian Cancer Registry (CCR) provides details about data elements in the patient records, the tumor characteristics and its diagnosis in tumor recordsFootnote 44 in a document called Canadian Cancer Registry System Guide. Similarly, the VSP supports and updates, on an annual basis,Footnote 45 documents such as Data Quality, Concepts and Methodology: Definitions, Vital Statistics Death Database Glossary, which, to a great extent, are consistent with the recommendations of the World Health Organization and the United Nations. More recently, the CCR is developing new metadata products that describe the CCR data holdings in order to provide analytic tools for a varied group of stakeholders and users.Footnote 46
3.6 RelevanceFootnote 47
Summary
According to the agency's 2009 quality guidelines,Footnote 48 relevance is enhanced when relationships are established and maintained with users. The analysis demonstrated that the HSP consults with its stakeholders to identify the changing or emerging needs and requirements of users, as well as potential information gaps, to address them accordingly.
The evaluation found that the HSP as a whole, including its specific survey programs and administrative data sets, is able to provide health statistical information that meets stakeholders' information needs and priorities. However, while continued efforts are deployed by the HSP to meet stakeholders' needs through consultations and reviews, some gaps in terms of alignment with needs were identified by the evaluation.
Engagement and consultation processes
Over the past five years, the HSP has been carrying out multiple activities in order to maintain the relevance of the program to its users, to better address their needs, and to identify data gaps and priorities for all its components.Footnote 49
The evaluation found mixed perceptions of the success and effectiveness of HSP's consultation and engagement processes. While there was overall satisfaction with the consultation process, some stakeholders called for better communication, particularly with respect to the data that are available and the constraints (e.g., budget, survey lengths) to which the HSP is subject. A desire and willingness to be more involved in survey design and data analysis planning, or, at a minimum, to be kept informed about survey content, data analysis plans, and product publication/release schedules was expressed.
The relevance of statistical information reflects the degree to which it meets the real needs of clients. It is concerned with whether the available information sheds light on the issues that are important to users. Assessing relevance is subjective and depends upon the varying needs of users. The agency's challenge is to weigh and balance the conflicting needs of current and potential users to produce a program that goes as far as possible in satisfying the most important needs within given resource constraints.
Source: Statistics Canada (2002)
Responsiveness to stakeholders' needs
In terms of responsiveness, the evaluation found that, overall, the HSP has been able to meet stakeholders' needs and priorities. The results of the user survey indicate that 138 out of 325 respondents (42%) believe that the HSP completely—or to a great extent— covers the issues of most importance, while 164 out of 325 respondents (50%) indicated it was “to some extent.” The results are slightly different when heavy users or the most knowledgeable respondents of HSP products were asked whether the HSP responds to key emerging issues or trends: 40 out of 203 (20%) indicated “completely or to a great extent”; 135 out of 203 (67%) “to some extent”; and 18 out of 203 (9%) “not at all.” The interviews conducted confirm that the HSP's components are responsive to stakeholders' needs overall. However, some areas in need of improvement in each program component have been identified.
The evaluation found that the CCHS–annual is responsive to stakeholders' needs and priorities. The results of the survey conducted for this evaluation indicate that 203 out of 226 respondents (90%) are satisfied with the products. The CCHS also offers the Rapid Response option (new initiative) to meet emerging and evolving needs for additional content, on a cost-recovery basis. The option allows clients to purchase 3 minutes of questionnaire time for a three-month collection period. Based on the Consultation Feedback Annual Report (2015), all clients have been very satisfied with the Rapid Response option, except for availability of provincial data, where gaps were identified.
In general, yes, it's responsive, but there are a couple of issues. Statistics Canada has made the Rapid Response piece of CCHS available, which is wonderful, but it's at a national level, which for a ministry of health is only somewhat useful.
Source: Interviews
A larger, more representative Inuit sample would lead to better quality estimates and estimates that could be broken down by variables such as age, sex etc. that could be used for more detailed analyses. A nationally representative Inuit sample consists of a sample drawn from each of four Inuit land claim regions. While CCHS coverage for Nunavut has improved in recent years, coverage in Nunavik in northern Quebec and Nunatsiavut in northern Labrador is likely very limited. Coverage in the Inuvialuit region of the Northwest Territories may also be problematic. In terms of health status and outcomes, there are great differences between these four regions
Source: Interviews
Overall, the evaluation found that the CCHS focus is responsive to stakeholders' needs and priorities. For instance, the survey shows a high level of satisfaction for CCHS Healthy Aging (85% satisfied) and for CCHS Mental Health (83% satisfied). However, some gaps, related to time periods between surveys (i.e., mental health and nutrition) and the inclusiveness of geographic areas (CCHS focus content surveys such as mental health and nutrition are not administered in the North) were identified. Moreover, the fact that some subpopulations are not fully represented in the CCHS as well as the wording used in sexual orientation questions were also identified as gaps.
Sexual orientation questions in the CCHS used wording/constructs from the 2004 CCHS—these questions are 15 years old (basically heterosexual or not). I understand this from a coherence perspective, but it's just not useful today.
Source: Interviews
In 2012 the relevance and performance of the CHMS was evaluated as part of the horizontal evaluation of the federal government's Action Plan to Protect the Health of Canadians from Environmental Contaminants. The evaluation report concluded that, although the CHMS is responsive overall to current and emerging content needs, the absence of a coordinated longer-term content plan is seen as a gap. To address the recommendations of the evaluation, the CHMS Program developed an eight-year content plan in 2013.
The results of the user survey indicate that 83 out of 101 respondents (82%) are satisfied with the statistical information available. However, there is one known gap with regional-level data, which is requested by interested data users. Due to cost and logistics, CHMS is conducted at the national level only and, at this point, there is no funding to consider expansion.Footnote 50 In addition, comprehensive data on children is not included in the CHMS, which would be valuable for stakeholders.
The Canadian Vital Statistics Program (VSP) remains relevant via consultations with the Vital Statistics Council of Canada. Overall, stakeholders are satisfied with the ongoing work to maintain the relevance and the usefulness of the VSP. The results of the survey conducted for this evaluation indicate that 91 out of 114 respondents (80%) are satisfied with the product. However, a lack of detail has been identified regarding death from drug toxicity—specific drugs are not identified. Furthermore, work must be undertaken to maintain the relevance of the VSP as it pertains to Physician Assisted Death (PAD) and the definition of stillbirth (given the increase in fetal reduction associated with the increase in assisted human reproduction). Another issue is the linkage between the Vital Statistics Program and the Canadian Cancer Registry to ensure that important information, such as survival data, can be analyzed. The HSP is working with stakeholders, such as Health Canada, the Public Health Agency of Canada and the Canadian Institute for Health Information, to ensure that needs are met in these areas.
Although the CCR does a good job of providing pan-Canadian estimates for cancer incidence, cancer treatment (surgery and radiotherapy) has been identified as a gap for the registry and all agree that it needs to be filled. The program is exploring two options to fill these gaps—a record linkage with other existing datasets, or asking care providers to report data to provincial cancer registries in the standard way, which would then be compiled and added to the CCR.
The evaluation found that the health indicators component of the HSP meets the needs and priorities of the stakeholders—97 out of 106 respondents (92%) are satisfied. Consultations take place via the Consensus Conference on Health Indicators (Statistics Canada/CIHI).Footnote 51 The fourth Consensus Conference gathered 61 participants across Canada. Most of the 80 indicators identified are relevant and meaningful to the majority of users. For the indicators that are less useful, a review is being conducted to determine whether they should be dropped or modified to increase their relevance.Footnote 52
The evaluation found a high level of satisfaction with Health at a Glance (94% satisfied).
Current/Emerging Needs and Expectations
The survey conducted confirms that certain areas need improvement. Among respondents consulted through the evaluation survey, 143 out of 325 (44%) believe that the HSP should produce additional information. When asked which information should be produced, nearly 40% of the responses indicated the concept of big data (integrated data across social domains) and determinants of health. Lack of geographic data (11%) and longitudinal data (10%) were also identified as needed.
Similarly, the key informants interviewed described a wide range of current and emerging needs and priorities relating to their particular field of expertise or domain of work, including:
- research on health equity, social determinants of health, and the broader concept of wellness;
- data, more data, or more frequent data collection on specific topics, including environmental exposure, pharmaceutical use, disabilities, mental health, institutionalization, nutrition (primarily consumption patterns), health needs of refugees, health needs of veterans, aging, birth defects, cancer screening, children's health, First Nations health;
- data/research that captures health outcomes;
- patient-oriented research;
- larger survey sample sizes; and
- technologies for human measurement (e.g., technologies for measuring chemical exposure in humans and genotyping).
Despite the diversity of key informants' needs and priorities, there were also some notable commonalities. The most frequently cited needs/priorities across all key informant categories were administrative data linkage and increased longitudinal data.
Administrative data linkage
Across all key informant categories, but especially among users and experts, the most commonly identified need was increased administrative data linkage and the related concept of big data.
Longitudinal data
A need for more longitudinal data was identified, primarily by RDC users. These key informants observed that the HSP is focusing on cross-sectional surveys—a trend they have observed throughout Statistics Canada. They emphasized the need for longitudinal data to facilitate the monitoring of health trends and understanding the impact of social determinants of health.
3.7 Use of the statistical information
Summary
The HSP data are used by all levels of government to fulfill their mandates and responsibilities, as well as by researchers, international organizations, non-governmental organizations and Canadians. At Statistics Canada, the HSP data are used as inputs to other statistical and research programs.
This evaluation question explores the extent to which the HSP data are being used to inform debate, research and analysis, as well as decision-making. The scope of issues covered by the program, combined with the fact that all this information is readily available, free of charge from the Statistics Canada website, creates endless possibilities for data use. Consequently, while the evaluation findings shed some light on this matter, it is impossible to capture the full range of potential use of statistical information.
Who uses Health Statistics Program data, for what purpose, and how?
Based on Statistics Canada's administrative databases, document review, literature review, bibliometric and webometric assessments, surveys and interviews, the evaluation identified a variety of uses and users in all areas of activity from the public and private sectors.
The key federal organizations users are HC, PHAC, CIHI, and CIHR. Other federal organizations among the major stakeholders are Employment and Social Development Canada, Immigration, Refugees and Citizenship Canada, Environment and Climate Change Canada, Department of National Defence, Service Canada, Passport Canada, Canada Revenue Agency, and Canada Border Services Agency. At the subnational level, all provincial and territorial governments and municipalities are important users of the HSP's statistics.
Evidence from key informant interviews corroborates the findings drawn from the document review and adds examples of public sector use (federal, provincial, territorial and municipal). At this level, the HSP data are being used to inform the development, performance measurement and evaluation of policies and programs intended to promote the health of Canadians. The HSP data are also used for the formation of guidelines, standards and regulations, particularly at the federal level. As one example collected in the evaluation, analysis of CCHS data identified differences in risk behaviours between two regions that, in turn, stimulated discussion around the adequacy of current regulations.
There is also evidence that HSP products have been used by international organizations. For instance, health indicator publications were used by the Organisation for Economic Co-operation and Development (OECD),Footnote 53 United Nations Children's Fund (UNICEF),Footnote 54 Pan-American Health Organization (PAHO)Footnote 55 and the Commonwealth Fund to release comparative information internationally. HSP information is also used by the World Health Organization to develop the Global Reference List of health indicators.
Evaluation findings from key informant interviews also confirmed that non-governmental organizations use HSP statistics to, for instance, develop products intended for the Canadian public that raise awareness of particular health issues.
Researchers use HSP information in trend studies and analysis, and for in-depth research on various health issues disaggregated by social and economic variables. For example, CCHS data were used by researchers at CIHI and Public Health Ontario for the development of a Life Expectancy Calculator that helps Ontarians understand the effect of certain behaviours on their life expectancy. Moreover, for the period from 2011/2012 to 2014/2015, more than 500 single contracts were granted for RDC access. These contracts were done by an annual average of 520 persons. CCHS–annual and two years combined were, by far, the most-requested files in contracts. Most of the RDC users are students, professors and researchers (39%, 37% and 14%, respectively, in 2014/2015) at universities (92% of the total types of organizations in 2014/2015).
World Wide Web
The visibility of HSP information on the Web was explored as part of the evaluation through a webometric assessment of uptake (hyperlinks to HSP products). Approximately 60,000 hyperlinks to Statistics Canada's website are on the Internet, of which 1,219 (2%) are directed towards HSP products. The hyperlinks directed to HSP products relate to summary tables (489 or 40%); surveys (302 or 25%); CANSIM tables (219 or 18%); publications (143 or 12%); and The Daily (66 or 5%).Footnote 56
The five most referenced products are CCHS–annual (survey); life expectancy at birth, by sex, by province (summary table); health indicator profile, annual estimates, by age group and sex, Canada, provinces, territories, health regions (2013 boundaries and peer groups (CANSIM table); suicides and suicide rate, by sex and by age group (summary table); and CCR (description). See Table 3 below.
HSP-citing web pages appear in various large domains from around the globe. The largest number of citing web pages (587 or 48%) originates from the Canada domain “.ca,” followed by the commercial domain “.com” (376 or 31%); the non-profit organization domain “.org” (162 or 13%); and the network domain “.net” (40 or 3%). Of all 1,219 links to HSP products, 618 come from Canadian websites (.ca; .com; .org; and .net). Of all Canadian links to HSP products, 38% (233) are from private-non-profit organizations' websites; 27% (136) are from private organizations' websites; 23% (143) are from public organizations' websites—75% of them are in the federal government, the majority of which (63%) are from CIHR, HC and PHAC; and 7% (44) are from academic institutions. The most frequently citing organizations are universities: University of Toronto; University of Ottawa; and University of Alberta.
| HSP Product | Count |
|---|---|
| Summary Tables | |
| Life expectancy at birth, by sex, by province | 89 |
| Suicides and suicide rate, by sex and by age group | 52 |
| Leading causes of death, by sex | 38 |
| Other | 310 |
| Summary Tables total (40% of total HSP products) | 489 |
| Surveys | |
| Canada Community Health Survey Annual | 139 |
| Canadian Cancer Registry | 44 |
| Canadian health Measures Survey | 36 |
| Other | 83 |
| Surveys total (25% of total HSP products) | 302 |
| CANSIM Tables | |
| Health indicator profile, annual estimates, by age group and sex, Canada, provinces, territories, health regions (2013 boundaries) and peer groups | 57 |
| Deaths, by cause, Chapter XVI: Certain conditions originating in the perinatal period (P00 to P96), age group and sex, Canada | 23 |
| Deaths, by cause, Chapter IX: Diseases of the circulatory system (I00 to I99), age group and sex, Canada | 16 |
| Other | 123 |
| CANSIM Tables total (18% of total HSP products) | 219 |
| Publications | |
| Health Indicators | 34 |
| Nutrition: Findings from the CCHS | 30 |
| The Changing Face of Heart Diseases and Stroke in Canada 2000 | 13 |
| Other | 66 |
| Publications total (12% of total HSP products) | 143 |
| Daily | |
| CHMS: Directly measured physical activity of Canadians | 10 |
| Leading causes of death | 8 |
| Canadian Forces Mental Health Survey | 6 |
| Other | 42 |
| Daily total: (5% of total HSP products) | 66 |
| Grand Total | 1,219 |
Media
A review of Statistics Canada's administrative records provides evidence of the level of interest in the media. In 2012/2013, HSP products were cited 129 times in the media, 163 times in 2013/2014 and 143 times in 2014/2015. During these three fiscal years, the most cited products were the CCHS and the Death Database.
Impacts of using Health Statistics Program products
The bibliometric assessment of outputs looked at two specific measures related to the scientific impact of HSP products—one that measures the impact of papers published, and another that measures the visibility of journals in which the research papers are published. The impact of the data on published literature is illustrated by the presence and use of HSP statistics in peer-reviewed articles. According to the bibliometric assessment conducted as part of the evaluation, a total of 38,222 citations referring to Statistics Canada in peer-reviewed articles were found between 2000 and 2014,Footnote 57 of which 3,970 (10%) refer to HSP releases. A bibliometric uptake assessment of Health Reports (82 003 X) is also provided as context for interpretation purposes. This publication series received about 2,250 references over the period from 2000 to 2014—about 55% of what HSP received overall.
The references to Statistics Canada releases for the periods from 2000 to 2006 and from 2008 to 2014 have grown more than five-fold, while they have grown more than ten-fold for HSP releases for the same time periods. The document types mostly cited for HSP are publications (1,684 or 42%); surveys (1,521 or 38%); CANSIM tables (416 or 10%); The Daily (179 or 5%); and summary tables (170 or 4%). The five most cited products are CHMS (survey); Nutrition: Findings from the CCHS (publication); National Population Health Survey (publication); Health Indicators (publication); and CCHS–annual (survey).
Furthermore, the impact and visibility of publications produced by the HSP seem to be above the world average and even the Canadian average.Footnote 58 As illustrated in Figure 2, from 2000 to 2014, the impact of Canadian papers published is 39% higher than the world average, while the impact of Statistics Canada papers published is 32% higher. The impact of Statistics Canada's health sciences papers, which essentially represent HSP products, is 81% higher than the world average (also well above Canadian and Statistics Canada scores). The results for the second measure are also significant. From 2000 to 2014, the visibility of journals in which the Canadian research appears is 25% higher than the world average, while the visibility of Statistics Canada research is 27% higher. The visibility of Statistics Canada's health sciences research, which again represents HSP products, is 44% higher than the world average (also above Canadian and Statistics Canada scores).
Survey respondents were asked if the information produced by the HSP allowed them to understand population health trends and issues better. Of respondents, 93% indicated that the HSP information enabled a better understanding. In fact, the use of HSP products enabled researchers to carry out high-quality research.
Figure 2: Scientific Impact between 2000 and 2014

Description for figure 2: Canadian Community Health Survey response rates over time
This bar chart shows the impact and visibility of publications produced by the Health Statistics Program compared to the world average, the Canada average and the Statistics Canada average for the period 2000 to 2014
Impact
World: 1
Canada: 1.39
Statistics Canada: 1.32
Health Statistics Program: 1.81
Visibility
World: 1
Canada: 1.25
Statistics Canada: 1.27
Health Statistics Program: 1.44
If we didn't have [HSP data], we'd be regulating in the dark. It would be impossible to do a decent job of many aspects of [our] mandate. It would be like trying to see through a cloud.
Source: Interviews
Most key informants believe that not having access to HSP information would significantly affect their work. It would compromise the feasibility of useful analyses such as the identification of public health trends; the evaluation of the impact of publicly-funded health programs and initiatives; interjurisdictional comparisons; and the development of accurate forecasts and projections. Evidence from the survey confirms the contribution of HSP products to informed decision-making—when HSP users were asked through the survey if HSP products helped them make more informed decisions, 83% agreed while only 5% disagreed (12% didn't know).
Most stakeholders believe that, ultimately, the use of HSP products contributed to increasing public awareness of specific health issues (e.g., mental health, chronic disease) or subjects salient to an understanding of the health of the Canadian public (e.g., socioeconomic determinants of health, the contribution of dietary quality).
4. Findings: Economy and Efficiency
This section summarizes the assessment of economy and efficiency on the Health Statistics Program. The findings are based on the analysis of the program's resource utilization in relation to the production of its outputs and progress toward expected outcomes, and builds on qualitative information from document review and interviews with program management.
As presented in the evaluation limitations section, the current structure of the financial information, on an operational basis rather than on a project basis, limits the analysis of the impact of issues and initiatives on survey activities' cost and total budget. To alleviate this limitation, a pilot project resulting from the previous evaluation of the CHMS has been initiated to gather financial information on the CHMS at a more detailed level. Preliminary results are presented in the last subsection of this report.
Summary
The evaluation's evidence confirms HSP management's commitment and good practices to offer quality outputs that meet overall needs and priorities. However, some issues related to partnership with key federal players and collaboration with provinces/territories, as well as a decline in response rates and technological challenges have been identified as key factors that affect efficiency and program outcomes (timeliness for instance).
The evaluation's evidence confirms that the HSP continues to offer a range of output that meets overall needs and priorities despite some challenges that could be summarized by 1) increased expectation and information needs; 2) implementation challenges and associated costs such as a decline in response rates and technological issues; 3) partnership with key players; and 4) collaboration with the provinces/territories.
The HSP has operated during the five-year period, with overall program spending of $224 million (as presented in Table 4). The program spending was somewhat comparable in the fourth-last year of the period following a drop of 11% in 2012/2013. Reduced base funding and external cost recovery spending translated into a reduction in the program budget in the second year of the period as depicted in Figure 3 below.
| Expenditures | Fiscal Years | Total | ||||
|---|---|---|---|---|---|---|
| 2011/2012 | 2012/2013 | 2013/2014 | 2014/2015 | 2015/2016 | ||
| Salary ($) | 27,922,852 | 24,928,916 | 23,270,115 | 24,469,404 | 24,955,306 | 125,546,593 |
| Non-salary ($) | 13,424,180 | 11,630,550 | 12,509,348 | 9,706,799 | 10,052,521 | 57,323,398 |
| Employee benefit and pension ($) | 5,584,570 | 4,985,783 | 4,654,023 | 4,893,881 | 4,991,061 | 25,109,319 |
| Accommodation ($) | 3,629,971 | 3,240,759 | 3,025,115 | 3,181,023 | 3,244,190 | 16,321,057 |
| Total ($) | 50,561,573 | 44,786,008 | 43,458,601 | 42,251,106 | 43,243,079 | 224,300,367 |
| Number of employees (FTE's) | 457 | 415 | 362 | 377 | 400 | Annual Average 402 |
Figure 3: Health Statistics Program Expenditures from 2011/2012 to 2015/2016, by component
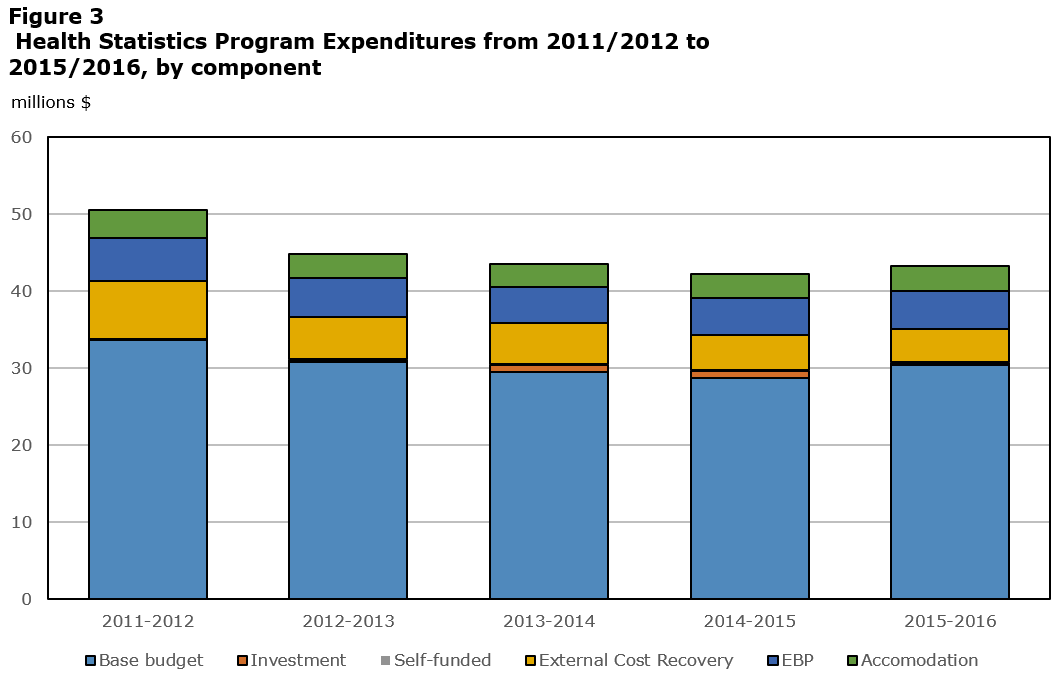
Source: Statistics Canada, financial system and computed information.
Description for Figure 3: Health Statistics Program Expenditures from 2011/2012 to 2015/2016, by component
This stacked bar chart shows expenditures for the Health Statistics Program by component for each fiscal year from 2011-2012 to 2015-2016 in $ millions
2011-2012
Base budget: 33.6
Investment: 0.1
Self-funded: 0.0
External Cost Recovery: 7.6
EBP: 5.6
Accommodation: 3.6
2012-2013
Base budget: 30.8
Investment: 0.2
Self-funded: 0.1
External Cost Recovery: 5.5
EBP: 5.0
Accommodation: 3.2
2013-2014
Base budget: 29.5
Investment: 0.9
Self-funded: 0.1
External Cost Recovery: 5.3
EBP: 4.7
Accommodation: 3.0
2014-2015
Base budget: 28.6
Investment: 1.0
Self-funded: 0.1
External Cost Recovery: 4.5
EBP: 4.9
Accommodation: 3.1
2015-2016
Base budget: 30.3
Investment: 0.3
Self-funded: 0.2
External Cost Recovery: 4.2
EBP: 5.0
Accommodation: 3
Financial evidence of the program's base funding indicates that utilization of resources in the delivery of the program was higher than originally planned for four years of the five-year period, ranging from +1.2% to +9.5%. The variance in 2013/2014, when expenditures of the base funding were 9.5% higher than the original budget, can be attributed for the most part to CHMS and higher data collection costs for the CCHS.
Implementation challenges in a new context
Key internal informants were asked to comment on the appropriateness of the level of resources to produce outputs. A mixed perception regarding the adequacy of the level of resources (financial, human and IT) and expectations was reported. Some informants stated that tight budgets have limited the flexibility of management to respond to problems. For example, management has had limited flexibility to deal with the wide-spread decline in response rates. The declining response rates require more effort than originally planned and additional unforeseen resources. Moreover, the implementation of projects, which requires the processing of large volumes of administrative data, is limited in the current IT infrastructure.
The document review revealed that program management demonstrates a commitment to manage efficiently in this context. Numerous initiatives and good practices have been conducted or initiated, including the following:
- review of the CHMS logistics activities for Cycle 3—the experience gained in the previous cycles was used to optimize the set-up and the hiring and retention of the field staffFootnote 59
- reorganization of the survey processing activities, reducing the number of FTEs;
- adoption of the SSPE and other common tools for various steps of the production processes;
- progress made towards implementation of the National Routing System as an input to the vital events data;
- finalization of the documentation and the post-mortem report for the 2015 CCHS–annual redesign, in order to support future survey redesigns by transferring knowledge and lessons learnedFootnote 60;
- review of the Long Term Care Facilities Survey to identify all possible administrative data sources in order to reduce respondent burdenFootnote 61; and
- consideration of changes to the CCHS model to best address user needs, and consideration of solutions such as the use of administrative data or Rapid Response functionality.
In addition, the HSP has aligned with corporate initiatives, for instance, in implementing electronic data collection using the corporate ICOS and participating in the field coordination activities to ensure consistency across surveys in the transition to an electronic questionnaire and ICOS environments.
A strategy for broad-based socioeconomic record linkage is being developed in the organization to increase the relevance of surveys and the use of administrative data. The HSP is instrumental in the implementation of this environment because of the experience gained with the Longitudinal Health and Administrative Data project, which participates in building internal expertise in this area (e.g., projects evaluating the quality and use of files created through record linkages).Footnote 62
The HSP is transforming its dissemination practices by incorporating them into the Statistics Canada New Dissemination Model and establishing, in 2014, the HSP Dissemination Renewal Task Force to propose changes that reflect divisional priorities and new corporate requirements.
In addition to these major corporate projects, the HSP uses generic processing systems and is involved in agency-wide efforts to explore mechanisms to enhance the use of administrative data, and to develop a more effective approach to data sharing agreements with external data providers.
Interviews with internal informants revealed that the transition to the common tools is viewed as positive, however, they also commented on the magnitude of the effort involved in the transition and raised concerns about the functionality of some tools. Centralization of information technology infrastructure resources to Shared Services Canada has been recognized as a major challenge in terms of space, infrastructure and tools for processing large volumes of data.
Partnership and collaboration
Health information in Canada relies on a complex governance structure involving a high number of players and stakeholders. Collaboration at the federal level plays a crucial role in the program via subject-matter knowledge sharing and funding of some data/surveys. The interviews with key informants at the federal level revealed concerns with respect to the current partnership. The need to revisit and strengthen this partnership by redefining roles and responsibilities and by maintaining ongoing communications was raised. In summary, mentioned were 1) a deterioration of the partnership in recent years, which has come to resemble a client relationship rather than a partnership; 2) a lack of involvement and information sharing in the decision-making process; and 3) challenges with respect to data sharing agreements.
It looks good on paper. There have been some situations where the partnership communications haven't followed through as effectively as might be hoped. We've experienced recently with this committee, the health partners are at the table, but they are viewed more as clients, rather than as partners in the decision-making process. It's almost like the committee is an FYI for the health portfolio, which wasn't the intent of the committee when it was first established. It was intended to be decision-making committee
Source: Interview
The success of the administrative programs and the record linkage project conducted by the HSP is crucially dependent on timely available input information from the provincial/territorial sources. Some evidence of issues and challenges related to the partnership between the HSP and the provincial and territorial health organizations have been noticed. Recent program documents suggest that the program is on the right track to getting these issues resolved, thus reducing the timeliness risk, for instance.
Another example of partnership between provincial/territorial ministries of health and Statistics Canada is the LHAD initiative that aims to help fill information gaps. Document reviewsFootnote 63 revealed that the limited success of the initiative could be linked to the inability of its governance structure to ensure support for the project at multiple levels, harmonized review procedures around privacy and confidentiality, and effective and streamlined policies and contractual arrangements governing data sharing between the provincial and territorial jurisdictions and Statistics Canada.
The interviews with many key informants confirmed that partnerships with the provinces and territories, particularly with respect to data sharing and data linkages, are somewhat challenging.
Follow-up on previous recommendation to improve efficiency reporting
Limited information for the analysis of efficiency (use of resources to generate products and outcomes) was previously identified as part of the Canadian Health Measures Survey (CHMS), 2008/2009 to 2012/2013 evaluation. Consequently, it was recommended that the survey cycle's financial information be made available by the Finance Branch to support CHMS performance data collection to demonstrate the level of efficiency over time for decision-making and accountability reporting.
The pilot project introduced in 2013/2014, resulting from this recommendation, aims at collecting CHMS financial information by survey cycle on a process–activity basis. Preliminary results confirm that the approach will make it possible to analyze the expenses (costs) of one survey cycle in relation to another cycle by survey process phase.
The advantages of such financial data aggregation are the capacity to isolate and identify cost variations by activity from one cycle to another and validate qualitative information on efficiency. For example, this becomes quantitative evidence of the cost impact of introducing new processes, initiatives and methods, or the cost impact of trends such as response rate decline, from one cycle to another. However, the nature and length of the CHMS cycle so far preclude an analysis between two cycles (pending). Moreover, for this method to become official reporting, a follow-up to verify and ensure the quality of the compiled information would be required.
5. Conclusions and Recommendations
Overall, the HSP has generally met the needs and priorities within budget, and generated the expected outcomes, namely providing access to high-quality, relevant statistical information to support public debate, decision-making and research.
Based on the evaluation findings, there is a recognition that the program must also ensure that the relevance of the statistical information is maintained by focusing on needs analysis versus capacity (surveyed populations, health determinants, collection frequency for certain themes). Lastly, the challenge of declining response rates with respect to accuracy must remain a priority for planning.
The evaluation's findings also show that the HSP encountered challenges in meeting release dates with vital and cancer statistics.
Recommendation 1:
Performance (timeliness)
Within the context of the relationship with provincial and territorial data providers, it is recommended that the Health Statistics Program take measures to improve the timeliness of the vital and cancer statistical information in order to meet target release dates and fulfill its mandate.
Issues were raised with respect to the current relationship with federal partners, particularly: 1) a perceived deterioration of the partnership in recent years, which has come to resemble a client relationship; 2) a lack of involvement and information sharing in the decision-making process; and 3) challenges with respect to data sharing agreements.
Recommendation 2:
Performance and efficiency (partnerships)
It is recommended that the Health Statistics Program work with its federal partners to improve the partnership approach. Particularly, this includes engaging with partners to review the current governance structure with respect to roles and responsibilities, the decision-making process, communications and expectations for data sharing.
6. Management Response and Action Plan
Recommendation #1 – Performance (timeliness)
Within the context of the relationship with provincial and territorial data providers, it is recommended that the Health Statistics Program take measures to improve the timeliness of the vital and cancer statistical information in order to meet target release dates and fulfill its mandate.
Statement of agreement or disagreement
Agreement
Management response
Management acknowledges that there have been issues of timeliness with the cancer and vital statistics programs, which are based on administrative records from provinces and territories.
Cancer Statistics
With the release of Cancer 2014 in February 2017, the Cancer Statistics Program will have returned to a regular release schedule that is as timely as possible in the context of the provision of data from provincial and territorial partners. Partners have indicated that a more ambitious schedule is not possible for them. Two provinces have indicated that they will not be able to provide 2015 data within the original proposed schedule. Management is establishing strategies to deal with missing or incomplete data submissions from the provinces and territories which could include publishing data for only the responding partners.
Vital Statistics
The backlog in the release of vital statistics will be cleared in 2017 with a return to timely releases in 2018. From 2018 onwards, vital statistics will be released 10 to 11 months after the end of the reference period. Not only does this mean that the program has recovered from the processing delays but this will be a significant improvement over past timelines where releases were 18-24 months following the reference year.
A processing backlog was incurred due to difficulties experienced by transitioning administrative data to the generic social surveys processing system (SSPE). This proved very problematic given that the SSPE was not built for administrative data and alternative processing approaches had to be developed to ensure more timely processing.
In addition, the National Routing System (NRS) is almost completely implemented with a potential to deliver the count of events on an on-going and almost real-time fashion. The more complex information, such as causes of death and particularly those that require coroners' investigations, are not always available in near real-time.
Cause of death data are coded at Statistics Canada for all provinces and territories except Ontario, British Columbia, and Québec. Death and Cause of Death data releases are dependent on the availability of the coded cause of death data from these 3 jurisdictions. There is currently a lag in the availability of cause of death data from Ontario and Quebec which may affect our ability to release the data according to the schedule.
In 2017, the vital statistics agreements will be signed and the NRS will be put in place for all remaining provinces and territories.
| Timeline | Deliverable(s) | Responsible party |
|---|---|---|
Cancer statistics:
|
Annual timely releases of cancer statistics. | Cancer Statistics Section, HSD |
| Vital statistics: 2017:
|
Backlog cleared up in 2017. Annual timely release of vital statistics moving to a release of data 10 – 11 months after the end of the reference period. |
Vital Statistics Section, HSD |
Vital statistics:
|
Signature of all agreements. Complete implementation of the NRS. |
Vital Statistics Section, HSD |
Recommendation #2 – Performance and efficiency (partnerships)
It is recommended that the Health Statistics Program work with its federal partners to improve the partnership approach. Particularly, this includes engaging with partners to review the current governance structure with respect to roles and responsibilities, the decision-making process, communications and expectations for data sharing.
Statement of agreement or disagreement
Agreement
Management response
A renewed governance is being developed for the health statistics program.
Together Statistics Canada, HC and PHAC form the Canadian Population Health Statistics Program (CPHSP) which governs the Canadian Community Health Survey, including the focus content, and the Canadian Health Measures Survey. At the December 2016 meeting of the CPHSP Steering Committee, the Assistant Deputy Ministers agreed to modernize the CPHSP Interdepartmental Letter of Agreement and to revise the governance structure. An initial meeting at the Director General level was held on January 11, 2017, to start moving towards these goals.
| Timeline | Deliverable(s) | Responsible party |
|---|---|---|
| December 2017 | New Inter-departmental Letter of Agreement (ILA) including new governance model. The new ILA will clarify the roles and responsibilities of the partners, decision-making process and communications. It will bring more clarity with respect to the sharing agreements. |
ACS Social, Health and Labour Statistics |
| March 2018 | A review of the functioning of the new ILA. The review will be recorded in the March 2018 DG meeting minutes and will outline the results of the new ILA and make recommendations going forward if necessary. |
DG Health, Justice and Special Surveys DG-level committee of the CPHSP |
Appendix 1: References
Bryant, T., D. Raphael, T. Schrecker and R. Labonte. 2011. “Canada: A land of missed opportunity for addressing the social determinants of health.” Health Policy. June. Vol. 101. p. 44–58.
Canadian Institute for Health Information and Statistics Canada. 2015. Rethink, Renew, Retire: Report from the Fourth Consensus Conference on Evaluating Priorities for Canada's Health Indicators. Ottawa.
Canadian Institute for Health Information and Statistics Canada. 2013. Health Indicators 2013. Ottawa.
Commission on Social Determinants of Health. 2008. Closing the Gap in a Generation: Health Equity Through Action on the Social Determinants of Health. Final Report of the Commission on Social Determinants of Health. Geneva: World Health Organization.
Council of Canadian Academies. 2015. Accessing Health and Health-Related Data in Canada.The Expert Panel on Timely Access to Health and Social Data for Health Research and Health System Innovation, Council of Canadian Academies. Ottawa.
Hawe, P., E. Di Ruggiero and E. Cohen. 2012. “Frequently asked questions about population health intervention research.” Canadian Journal of Public Health. Vol. 103, no. 6. p. e468–e471.
Health Information Advisory Committee. 2015. “Appendix 1: Inventory of health data.” Health Data Strategy: Collective Efforts to Address Canadian Health Data Challenges. Internal document.
Library of Parliament. 2008. The Federal Role in Health and Health Care. Publication no. 2008‑58‑E. Ottawa.
Morrison, J., M. Pons‑Vigués, L. Bécares, B. Burström, A. Gandarillas, F. Domínguez‑Berjón, È. Diez, G. Costa, M. Ruiz, H. Pikhart, C. Marinacci, R. Hoffman, P. Santana, C. Borrell and partners from the INEQ‑Cities Project. 2014. “Health inequalities in European cities: Perceptions and beliefs among local policymakers.” BMJ Open. May. Vol. 4, issue 5.
Organisation for Economic Co‑operation and Development (OECD). 2015. Health at a Glance, 2015. How Does Canada Compare? Paris: OECD Publishing.
Pan American Health Organization. 2012. Health in the Americas, 2012 Edition: Country Volume. Canada.
Pathak, S., M.D. Low, L. Franzini and J.M. Swint. 2012. “A review of Canadian policy on social determinants of health.” Review of European Studies. September. Vol. 4, no. 4.
Senate of Canada. 2009. A Healthy, Productive Canada: A Determinant of Health Approach. The Standing Senate Committee on Social Affairs, Science and Technology. Final Report of the Senate Subcommittee on Population Health. Ottawa.
Statistics Act, R.S.C. 1985, c. S-19. Ottawa: Department of Justice.
Statistics Canada. 2017. Statistics Canada's Quality Assurance Framework. Statistics Canada Catalogue no. 12‑586‑X. Ottawa.
Statistics Canada. 2015a. Health Statistics Division. Operational Plan 2015/2016. Internal document. Ottawa.
Statistics Canada. 2015b. Canadian Community Health Survey (CCHS)–Nutrition Dissemination Working Group Charter. Ottawa.
Statistics Canada. 2015c. Health Indicators Strategic Review Report. Ottawa.
Statistics Canada. 2015d. Consultation Feedback Annual Report. Health Statistics. Ottawa.
Statistics Canada. 2015e. Health Statistics Program: Presentation to the National Statistics Council, October 29, 2015. Ottawa.
Statistics Canada. 2014a. 2014-2015 Report on Plans and Priorities. ISSN 2292‑5252. Ottawa.
Statistics Canada. 2014b. Canadian Health Measures Survey (CHMS) Expert Advisory Committee Meeting, September 26, 2014. Internal document. Ottawa.
Statistics Canada. 2014c. Health Statistics Division (HSD) Dissemination Renewal Task Force Terms of Reference. Ottawa.
Statistics Canada. 2014d. Health Surveys Informal Content Coherence Committee Terms of Reference. April 19, 2010. Revised September 22, 2014. Ottawa.
Statistics Canada. 2014e. Evaluation of the LHAD Initiative. Longitudinal Health and Administrative Data Initiative. Ottawa.
Statistics Canada. 2013. Communication Plan for Canadian Health Measures Survey, 2013‑2016. Ottawa.
Statistics Canada. 2012. Data Quality in Statistics Canada's Population Surveys: The Case of the Canadian Community Health Survey. Ottawa.
Statistics Canada. 2011. Program Performance Report: 2008/2009 to 2009/2010. Health Statistics Program. Ottawa.
Statistics Canada. 2009. Statistics Canada Quality Guidelines. 5th edition. Statistics Canada Catalogue no. 12‑539‑X. Ottawa.
Statistics Canada. 2002. Statistics Canada's Quality Assurance Framework. Statistics Canada Catalogue no. 12‑586‑X. Ottawa.
Treasury Board of Canada. 2015. Whole‑of‑Government Framework. Ottawa.
Vital Statistics Council of Canada. 2014. Annual General Meeting 2014. Internal document.
Weiss, D., M. Lillefjell and E. Magnus. 2016. “Facilitators for the development and implementation of health promoting policy and programs: A scoping review at the local community level.” BMC Public Health. Vol. 16, no. 140.
Word Health Organization (WHO) Regional Office for Europe. 2012. Governance for Health in the 21st Century. Prepared by I. Kickbusch and D. Gleicher. Copenhagen, Denmark.
Appendix 2: Program Description
The mandate of the Health Statistics Division (HSD) is to provide accurate, timely and relevant information about the health of Canadians. The HSD, in collaboration with the Health Analysis Division (Analytical Studies Branch), provides statistical analyses and other information about the health of the population, the determinants of health and the scope and utilization of Canada's health care resources. This information is used to assist and support health planners and decision-makers at all levels of government, sustain demographic and epidemiological research, and to report to the Canadian public about their collective health and health care system performance.
HSD works in partnership with provincial and territorial vital statistics registrars and cancer registries, as well as data providers and users at the federal level, namely Health Canada and the Public Health Agency of Canada (PHAC), provincial level (provincial ministries of health), regional level (health regions), and with many other partners, including the Canadian Institute for Health Information (CIHI), to provide statistical information on, and to undertake research and analysis about, the health status of Canadians and the health system.
The Health Statistics Program's activities can be divided into three broad areas:
- statistical and administrative programs
- products and services
- special projects and initiatives.
Table 4: Health Statistics Program key surveys and data products
| Statistical Programs | |
|---|---|
| Canadian Community Health Survey (CCHS) | The CCHS has been the flagship population health survey in Canada since 2000. It includes two components: an annual component which covers a wide range of health topics and periodic focus content surveys which examine a single topic or sub-population in considerable depth. The objective of the annual component is to support health surveillance by providing cross-sectional estimates of health determinants, health status, and health system utilization data for sub-provincial community health regions across Canada. The primary objective of the focus content component is to support health research and policy development through in-depth examination of a single topic such as mental health, nutrition or a single sub-population such as the elderly. For example, each year the CCHS produces approximately three data files, a dozen of fact sheets and two Canadian Socio-Economic Information Management System (CANSIM) tables. |
| Canadian Health Measures Survey (CHMS) | The CHMS was launched in March 2007 in partnership with Health Canada and PHAC to expand the infrastructure required to collect physical measurements from participants (labs, scientific measurements, health professionals) and extends expertise to the Health Statistics Program. The survey collects important health information through self-reported data and direct physical measures. As part of the data collection, small amounts of blood and urine are collected from consenting respondents and stored at the National Microbiology Laboratory (NML) in Winnipeg for use in future health studies of national priority. The survey also extracts and stores DNA samples from participants who have provided consent specifically for this purpose. The biospecimens are made available, through the CHMS Biobank governance process, to any Canadian researcher who completes a strict review process and demonstrates that their research would benefit from a national population survey of about 5,600 participants per cycle and provide a public good benefit. CHMS aims to expand the infrastructure required to collect physical measurements from participants at a mobile examination centre and to extend expertise to the Health Statistics Program. Its marks a step toward filling gaps in the health information system since some important health issues cannot be monitored without direct physical measures (e.g., metabolic syndrome, exposure to environmental contaminants and physical activity). |
| Administrative Programs | |
|---|---|
| Vital Statistics | The Vital Statistics Program provides annual information on the number of registered births, deaths, and stillbirths in Canada, using administrative data files from the Vital Statistics Registries in each province and territory, and based on a standard set of variables for each type of vital event. |
| Cancer Statistics Program | The CCR is an annual administrative survey that collects information on cancer incidence in Canada from provincial-territorial Cancer Registries. It provides a nationally standardized and comparable database to study cancer patterns and trends, such as cancer incidence and survival. It contains data on all Canadian residents alive or dead who have been diagnosed with cancer from 1992 onward. In recent years, staging data has been added progressively to the registry for a few cancerous sites. |
| Health Statistics Program key surveys and data products | |
|---|---|
| Integration and Analysis | The focus of this activity, often performed using record linkages, is to integrate numerous health data sources to produce analytical products as well as key indicators covering health status, determinants of health, health system performance and community and health system characteristics. The Integration and Analysis Section is also responsible for the analyses of cost recovery projects such as the 2013 Canadian Forces Mental Health Survey. The section also carries out long-term health record linkage studies for clients on a cost recovery basis, using birth, death and cancer data. Analytical studies can look at health outcomes for various occupational, environmental, and clinical cohorts with results being used to review and refine exposure guidelines, to determine long-term benefits of treatments and to monitor health status indicators. Integration and Analysis is also responsible for the Health Indicators Program, which includes over 80 indicators measuring the health of Canadians, providing comparable health information at the health region and at the provincial/territorial level. |
| Client Services and Dissemination | This area is responsible for handling enquiries on data availability and access, data concepts, definitions and usage, cost recovery custom extractions, as well as remote access services and the provision of public use microdata files to users. In addition, dissemination activities include the development of the Health in Canada web portal, and CANSIM data. |
| Special Projects and Initiatives | |
|---|---|
| National Routing System (NRS) | The NRS, which began in 2005/2006, is intended to facilitate the movement of vital event information (i.e., births and deaths) between the provincial and territorial agencies that create the records and the federal departments and agencies that use the information. Instead of bulk updates at various times during the year, the information is transferred electronically and securely as soon as the event is registered, thus producing major improvements in timeliness. The NRS is a set of standards used for transmitting the data to Statistics Canada, the Canada Revenue Agency (CRA) and Employment Social Development Canada (ESDC). |
| Canadian Coroner and Medical Examiner Database (CCMED) | The objective of this project, which has been running since 2004/2005 on an occasional basis, is to provide standardized information on the circumstances surrounding the subset of deaths which are reported to coroners and medical examiners in Canada. CCMED represents an important step towards filling an information gap and contributes to numerous downstream policy and program discussions. |
| Neurological Survey Program | The neurological survey program consists of two separate cost recovery components. The first component is the Survey of Living with Neurological Conditions in Canada (SLNCC) and is intended to provide the rates of 19 neurological conditions in the general population as well as their impacts on various dimensions of life. The second component is an institutional-level survey that will provide the rates of the same 19 neurological conditions in the institutional setting by age group and gender as well as characteristics of the institutions. This program began in 2009/2010 and fills a major data gap given that rates of neurological conditions have never been available in Canada and little is known about the basic characteristics of institutional residents. This program is conducted on an occasional basis. |
| Survey of Living with Chronic Diseases in Canada | The Survey of Living with Chronic Diseases in Canada (SLCDC) is a recurring cost recovery survey which was initiated in 2007/2008 and has been repeated on a three-year cycle. It studies two different chronic diseases per cycle and provides information on the impacts of these diseases as well as on how people are managing their conditions. |
| Long Term Care Facilities Survey (LTCFS) | The Long Term Care Facilities Survey is conducted by Statistics Canada on a cost-recovery and as-required basis. It collects important information on facilities that provide care to residents with physical and cognitive health needs. The survey asks facility administrators about the characteristics of their residents, such as their age, sex, and level of care required. Administrators are also asked to provide statistical and financial information regarding the operation of their facilities. Statistics Canada uses information from this survey to improve knowledge of the health sector and how it contributes to the Canadian economy. |
| Canadian Health Survey on Children and Youth | A pilot for the Canadian Health Survey on Children and Youth is currently in development in partnership with Health Canada and PHAC. The survey will cover various health components and other related factors for the children aged 1 to 17 years old, hence filling a very important data gap in the health information domain. The pilot will be conducted in the autumn of 2016 while the first iteration of the main survey would be in 2018 or 2019. Financial contribution by PHAC has been confirmed for the first few iterations of the survey which would be conducted on a three-year cycle. |
Appendix 3: Health Statistics Program Logic Model
The program logic model presented in Figure 4 below is based on Statistics Canada's Quality Assurance FrameworkFootnote 64, which describes the six dimensions for quality management of all statistics data and products, (i.e., accessibility, timeliness, accuracy, interpretability, coherence and relevance). The logic model is also aligned with Statistics Canada's Corporate Management FrameworkFootnote 65, which illustrates how the agency delivers its strategic outcomes. The six dimensions of quality management are integrated into the framework as enablers in a hierarchical sequence from access, to quality (including accuracy, interpretability and coherence) and then relevance.Footnote 66
Figure 4: Health Statistics Program Logic Model

Description for Figure 4: Health Statistics Program Logic Model
This figure depicts the Consumer Prices Division and its stakeholders. It is divided into quadrants: internal stakeholders that are providers of input, internal stakeholders that are users of output, external stakeholders that are providers of input, and external stakeholders that are users of output.
The internal stakeholders that are providers of input for the Consumer Prices Division are:
- Business Survey Methods Division (BSMD)
- Culture, Tourism and the Centre for Education Statistics (CTCES)
- Collection, Planning and Management Division (CPMD)
- Income Statistics Division (ISD)
- Labour Statistics Division (LSD)
- Labour and Household Surveys Analysis Division (LHSAD)
- Producer Prices Division (PPD)
- Other
The internal stakeholders that are users of output of the Consumer Prices Division are:
- Producer Prices Division (PPD)
- System of National Accounts (SNA)
The external stakeholders that are providers of input for the Consumer Prices Division are:
- Price Measurement Advisory Committee (PMAC)
- Focal Points
- International Community
The external stakeholders that are users of output of the Consumer Prices Division are:
- Bank of Canada
- Finance Canada
- Human Resources and Skills Development Canada (HRSDC)
- Provincial governments
- Canadians
- Other
Appendix 4: Evaluation Issues and Questions
| Relevance |
| Issue # 1 Continued Need for Program – Assessment of the extent to which the program continues to address a demonstrable need and is responsive to the needs of Canadians |
| Is there a continued need for the program? |
| Issue # 2 Alignment with Government Priorities – Assessment of the linkages between program objectives and (i) federal government priorities and (ii) departmental strategic outcomes |
| Does the program align and support the past and current Government of Canada priorities, including the priorities of key contributing federal departments? Are there gaps? |
| Does the program address Statistics Canada's strategic outcomes? |
| Issue # 3 Alignment with Federal Roles and Responsibilities – Assessment of the role and responsibilities for the federal government in delivering the program |
| Are the current roles and responsibilities of the federal government appropriate in delivering the program? |
| Performance |
| Issue # 4 Achievement of expected outcomes – Assessment of progress toward expected outcomes with reference to performance targets and program reach; Assessment of program design, including the linkage and contribution of outputs to outcomes |
| To what extent do Canadians, public and private sector have access to quality statistical information and to associated support services? (Immediate outcome)How timely, accurate, interpretable, coherent, and accessible is the program's statistical information? |
To what extent are Canadians, public and private sector information needs are met by statistical information? (Intermediate outcome)?
|
To what extent do Canadians, public and private sector use statistical information to inform public debate, research and decision-making (Ultimate outcome)?
|
| Issue # 5 Efficiency and Economy – Assessment of resource utilization in relation to the production of outputs and progress toward expected outcomes |
| To what extent and how are the program resources being used to produce the intended outputs and outcomes? |
| Is there a valid alternative approach to the production of outcomes and utilization of resources for the program? |
Appendix 5: Evaluation Strategy
For each evaluation question, the evaluation used multiple lines of evidence consisting of both the quantitative and qualitative data collection methods described below. Multiple data sources provide information from various perspectives, which helps for triangulation and validation of evaluation findings, thus increasing their accuracy and credibility and strengthening the validity of conclusions.
The evaluation used the following approaches:
- Outcomes-based approach: assessing the progress the program components have made towards the achievement of expected outcomes, and whether there were adequate resources and use of opportunities for improvement.
- Utilization-focused approach: focussing parts of the evaluation on aspects of the program selected according to the needs of primary users for specific purposes and decision-making. This approach involves preliminary consultation with the management team of the program to discuss evaluation issues/questions, approach and scope and to identify potential components.
Data Collection Methods
Document review
The document review consisted of a review, synthesis and analysis of data from relevant documentation to provide a comprehensive understanding of the program and address the evaluation questions. The documents included, but were not limited to:
- Documents specific to HSP such as operational plans, agreements and memoranda of understanding, publications, special studies, Client Relationship Management System (CRMS) requests, HSP client satisfaction survey results, committee minutes, presentations, project/survey files, and other types of documents (such as news releases inventories by HSP) related to this evaluation.
- Program and policy related documentation such as Memoranda to Cabinet, Treasury Board Submissions, strategic plans, performance reports (QPR, BPR), HSP Performance Measurement Strategy, audit and evaluation reports (Statistics Canada or other departments), as well as other documents that make reference to HSP (e.g., documents related to Ministerial Review, Speeches from the Throne, federal budgets, legislation, policy statements, and OAG reports).
This review also included targeted reports and publications from the federal government (e.g. Health Canada, Public Health Agency of Canada, CIHR, etc.) and other Canadian institutions. These sources served as a line of evidence for all the evaluation issues and questions. It also included publications by international partners, such as the WHO and OECD, in order to assess the quality of Statistics Canada's statistical information compared to international standards, and identify potential alternatives.
Financial and Administrative Data Review
The following sources, among others, were examined as part of the data review:
- Financial documents and administrative documents/databases linked to the operations and activities of the HSP, such as the financial reporting system (FRS);
- Data linked to the publication and dissemination of HSP products;
- Data related to the quality of the outputs produced by the HSP;
- Information about data requests and support services provided to users by the HSP;
- Information about the exposure of the statistical information in the traditional media and the social media;
- Agreements and memoranda of understanding related to data sharing and cost-recovery activities.
This review was undertaken to provide a complete description of the program and its resources, assess the achievement of its outputs and outcomes, including its efficiency and economy, and inform the analysis and final reporting.
Key informant interviews
Forty interviews with 51 key informants were conducted and 2 written responses representing 7 respondents were analyzed to gain in-depth information on the evaluation issues and questions. The selection of participants was based on their expertise and role in the management and delivery of the HSP. It also includes stakeholders who benefit from the program activities.
| Interview Informant Categories | # of interviews | Total # of participants |
| Advisors | 1 | 1 |
| Experts | 6 | 7 |
| Users (research data centres) | 8 | 8 |
| Users (public sector) | 7 | 8 |
| Users (key federal partners) | 8 | 15 |
| Users (internal) | 3 | 5 |
| Informants (internal) | 7 | 7 |
| Total | 40 | 51 |
| Written responses informant categories | # of responses | # of entities |
| Users (key federal partners) | 2 | 7 |
Survey of key users
An on-line survey of users was conducted as part of the evaluation. The target population for this on-line survey was users of statistical information produced and released by the HSD. Representatives who participated in key informant interviews were not invited to participate in the survey in order to avoid respondent fatigue.
The focus was to assess users' past, current, and future needs and their appraisal of the data and services that were provided. The sample was composed of names from the program's list of key users and the Client Relationship Management System (CRMS) and any other sources such as the outreach list of users from regional offices. There was no intent to build a user's representative sample. Instead the intent was to get a clear picture by reaching a maximum number of users.
A total of 2911 users were invited by email to participate in the survey. Of this number, there were 402 emails which were returned: therefore, the number of users effectively surveyed was 2511. In total, 345 individuals completed all the questions in the survey. However, only 325 of these indicated they had accessed health statistics information: survey results in this report are therefore based on these 325 respondents. Given the above, the response rate to this survey was 12.94% (325/2511).
Bibliometric and Webometric Analysis
This data collection method is a source of information for the assessment of the program's higher-level outcomes that are linked to the use of statistical information. Common challenges to provide strong evidence for the use of programs' statistical products are related to the fact that the contribution of Statistics Canada to federal government outcomes is both direct, by informing public debate and decision-making on economic, social, international and government affairs, and indirect, by supporting policy formulation, implementation and evaluation within the federal government.Footnote 67 In addition, the good reputation and public trust of Statistics Canada rely on its neutrality, as far as the use of the information is concerned. This means that the agency purposefully has a limited influence on how the statistical information and products are used and their impact on society. Moreover, users do not have any obligation to inform Statistics Canada on how they use its data and information. Bibliometric and/or webometrics methods have a potential to be one strong line of evidence for the evaluation studies with the measurement of “use”.
Bibliographic methods are broadly defined as a set of methods and procedures used to measure bibliographic records. Bibliometric methods can be used to measure scientific outputs (scientometrics; basic units of measurement are articles in scientific journals) and technological outputs (technimetrics; basic units of measurement are patents). Less frequently, bibliometric methods can be adapted to quantify the impact of publications on an audience with specific characteristics, such as the academic community.
This evaluation measures the use of data and publications from the HSP in the scientific literature based on bibliometric methods. It attempts to: 1) measure the impact of scientific products (publications) from the program on the work of Canadian and international researchers, 2) identify institutions, sectors, countries and scientific disciplines of the authors, and 3) establish the types of scientific collaborations that are formed for the use of the program data.
When bibliometric methods can be modified to measure references and citations in web sites and social media, they are referred to as webometrics. Then, the basic units of measurement are website links. In the current evaluation study, webometrics measure the impact of products and publications from the HSP in specialized circles and by the general public. This has been undertaken by analyzing the Web in general.