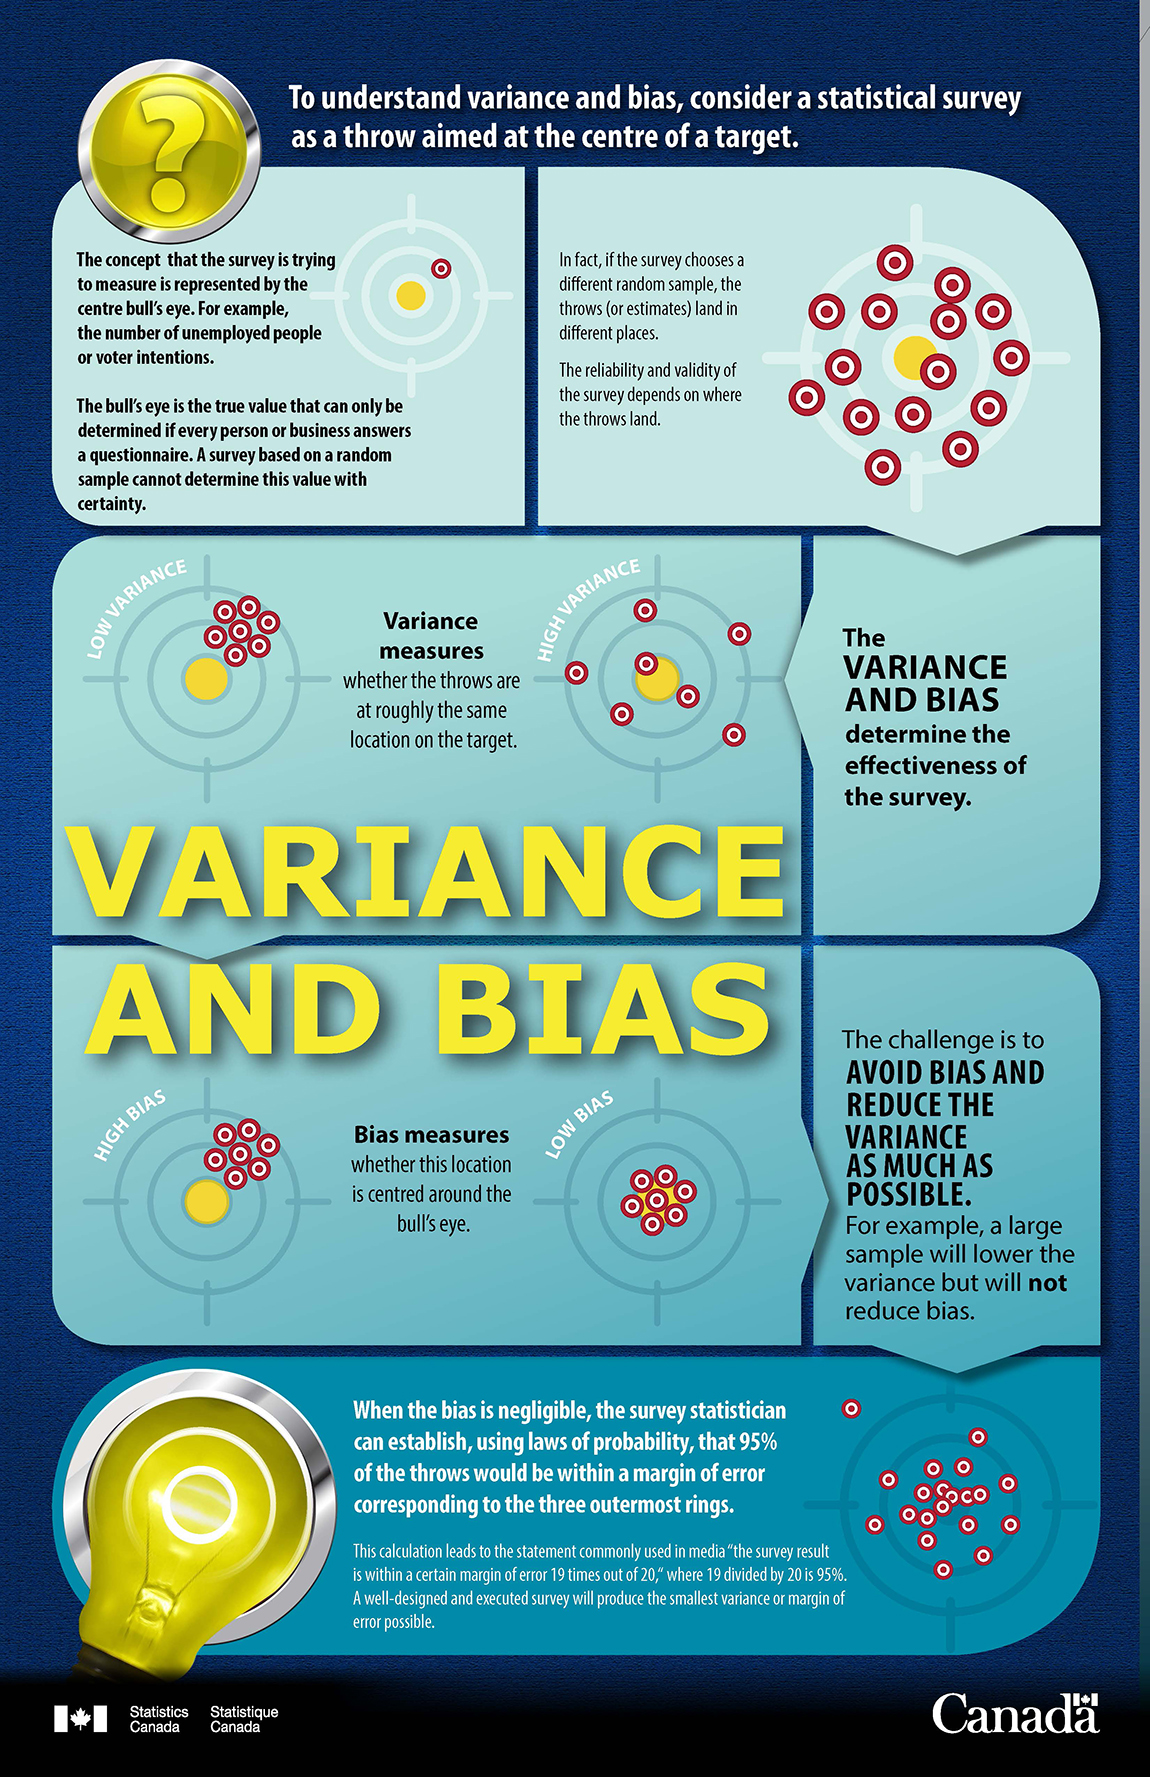
Description for graphic: Bias and Variance
To understand variance and bias, consider a statistical survey as a throw aimed at the centre of a target.
- The concept that the survey is trying to measure is represented by the centre bull's eye. For example, the number of unemployed people or voter intentions. The bull's eye is the true value that can only be determined if every person or business answers a questionnaire. A survey based on a random sample cannot determine this value with certainty.
{Visual}: A bull's eye is shown with a mark on the second innermost ring - In fact, if the survey chooses a different random sample, the throws (or estimates) land in different places. The reliability and validity of the survey depends on where the throws land.
{Visual}: A bull's eye with 15 marks scattered across it is shown. - The variance and bias determine the effectiveness of the survey.
- The challenge is to avoid bias and reduce the variance as much as possible. For example, a large sample will lower the variance but will not reduce bias.
- Variance measures whether the throws are at roughly the same location on the target.
{Visual}: 'Low Variance' is represented by a bull's eye with seven marks bunched together in the top right hand corner. 'High Variance' is represented with a bull's eye with seven marks scattered evenly across it. - Bias measures whether this location is centred around the bull's eye.
{Visual}: 'High Bias' is represented by a bull's eye with seven marks bunched together in the top right hand corner. 'Low Bias' is represented by a bull's eye with seven marks located in the center. - When the bias is negligible, the survey statistician can establish, using laws of probability, that 95% of the throws would be within a margin of error corresponding to the three outermost rings. This calculation leads to the statements commonly used in media "the survey result is within a certain margin of error 19 times out of 20, "where 19 divided by 20 is 95%. A well-designed and executed survey will produce the smallest variance or margin of error possible.
{Visual}: A bull's eye is shown to have 19 marks scattered across the innermost rings and one mark outside and to the left of the bull's eye.
Statistics Canada produces data on numerous topics of interest to Canadians. For example, the census of population collects data on every individual to produce very accurate counts every five years. To produce accurate economic and social data on a more frequent and timely basis, Statistics Canada typically conducts surveys that collect data on a random sample of individuals or businesses.
For example, the Monthly Survey of Manufacturing (MSM) publishes the values (in Canadian dollars) of sales of goods manufactured, inventories and orders six weeks after the end of every month. On October 16, 2014, the MSM estimated that $52,100 million of goods manufactured were sold in Canada in August 2014. Statistics Canada produced this estimate on the basis of data collected from a random sample of 10,500 business establishments across Canada.
Like any other survey, the aim of the MSM is to produce the most accurate results possible. How can we determine whether the MSM estimate of $52,100 million in sales of goods manufactured is, in reality, close to the actual level of sales in August 2014 in Canada? To do this, we use two measures of precision—bias and variance.
Variance is relatively easy to measure in a survey, whereas bias is more difficult. That's why, in an effective survey, we do everything possible to eliminate bias, so that the accuracy of the survey results depends on variance only. The MSM is no exception to this: by using a well-tested questionnaire, a proven methodology, specialized interviewers and strict quality control, and by following up with businesses that do not initially respond to the survey, we are able to minimize bias in the MSM.
Once we have minimized bias, we can adequately represent the accuracy of the survey results by variance only. We can express variance in various ways. For example, the August 2014 result of $52,100 million in sales of goods manufactured had a standard error of $260 million. The standard error represented 0.5% of the goods sold—this percentage is called the coefficient of variation, and is commonly used by Statistics Canada to express variance. Another method commonly used by the media to express variance is margin of error, which is also based on the standard error. With this method, the result of the August 2014 MSM could be expressed in the following familiar format: "Based on the Monthly Survey of Manufacturing, Statistics Canada estimates that $52,100 million of goods manufactured were sold in August 2014, with a margin of error of $520 million, 19 times out of 20." In this statement, the margin of error is twice the standard error.
In conclusion, bias and variance are key measures of the accuracy of survey results. When we conduct a survey using sound quality assurance principles, we avoid bias. When we design a survey on a sound scientific basis, we can calculate and control variance. Regardless of how we report variance—as a measure of the precision of survey results—the interpretation is always the same: the smaller the variance and the associated standard error, coefficient of variation and margin of error, the more reliable the corresponding survey results are considered to be.