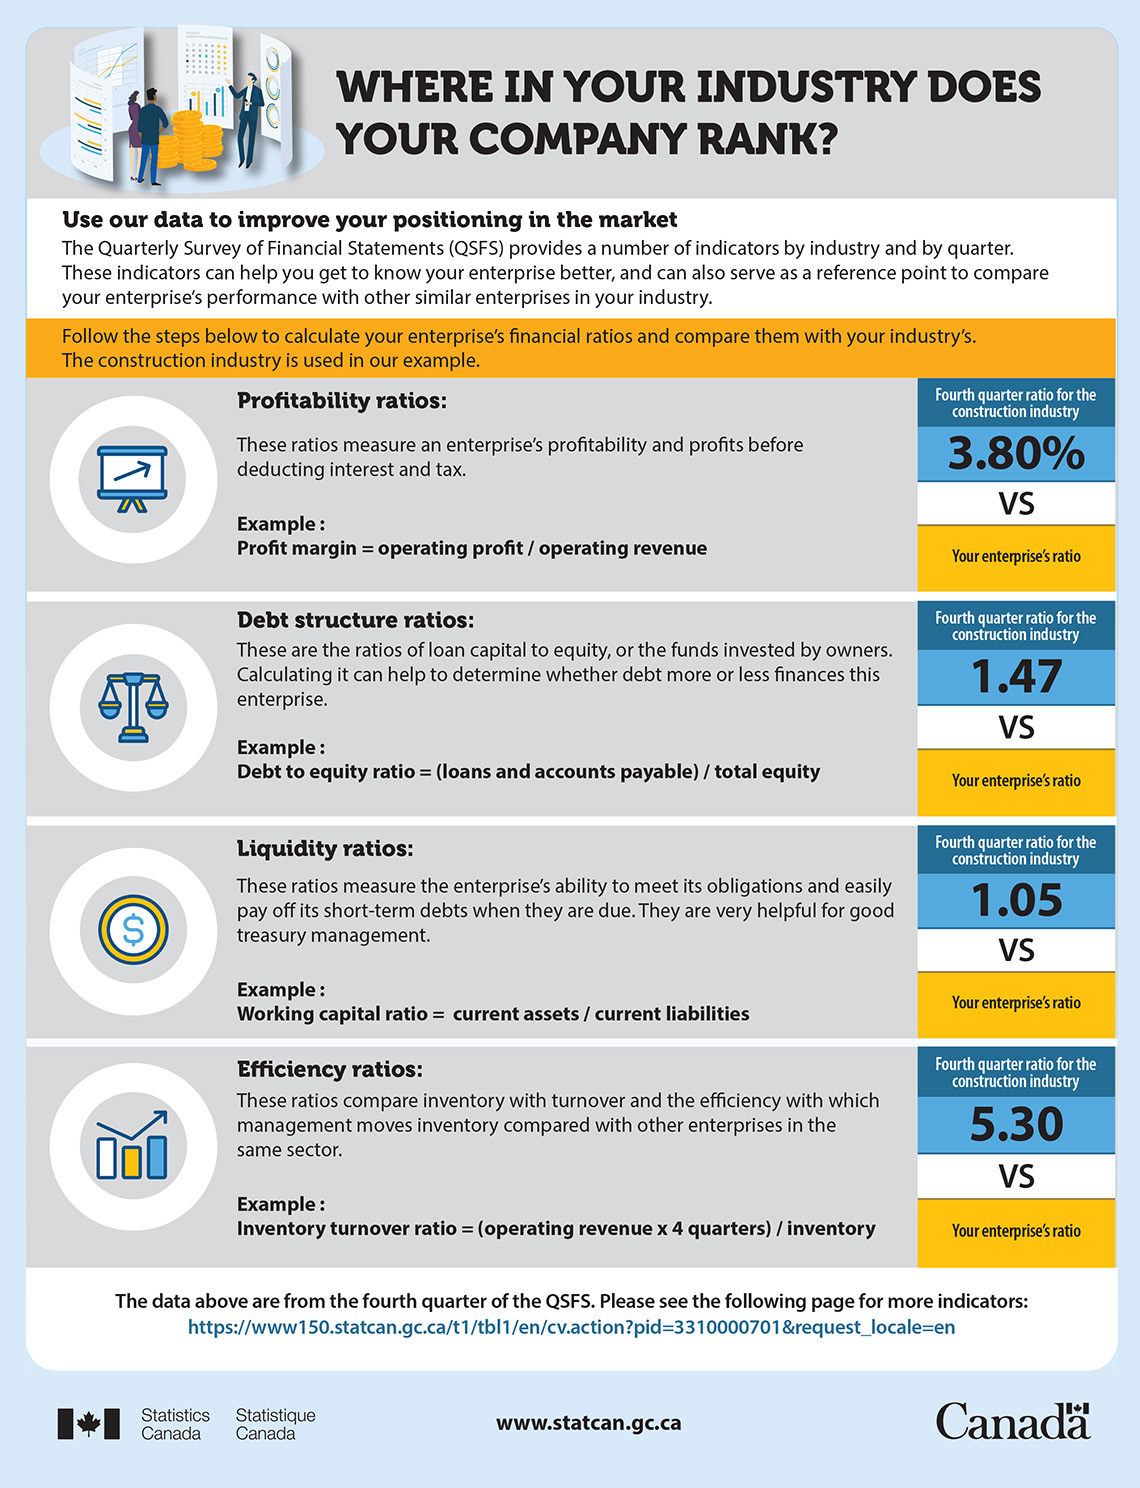
Description: Where in your industry does your company rank?
Use our data to improve your positioning in the market
The Quarterly Survey of Financial Statements (QSFS) provides a number of indicators by industry and by quarter. These indicators can help you get to know your enterprise better, and can also serve as a reference point to compare your enterprise's performance with other similar enterprises in your industry.
Follow the steps below to calculate your enterprise's financial ratios and compare them with your industry's. The construction industry is used in our example.
Profitability ratios
These ratios measure an enterprise's profitability and profits before deducting interest and tax.
Example:
Profit margin = operating profit / operating revenue
Fourth quarter ratio for the construction industry
3.80%
vs.
Your enterprise's ratio
Debt structure ratios
These are the ratios of loan capital to equity, or the funds invested by owners. Calculating it can help to determine whether debt more or less finances this enterprise.
Example:
Debt to equity ratio = (loans and accounts payable) / total equity
Fourth quarter ratio for the construction industry
1.47
vs.
Your enterprise's ratio
Liquidity ratios
These ratios measure the enterprise's ability to meet its obligations and easily pay off its short-term debts when they are due. They are very helpful for good treasury management.
Example:
Working capital ratio = current assets / current liabilities
Fourth quarter ratio for the construction industry
1.05
vs.
Your enterprise's ratio
Efficiency ratios
These ratios compare inventory with turnover and the efficiency with which management moves inventory compared with other enterprises in the same sector.
Example:
Inventory turnover ratio = (operating revenue × 4 quarters) / inventory
Fourth quarter ratio for the construction industry
5.30
vs.
Your enterprise's ratio
The data above are from the fourth quarter of the QSFS. Please see the following page for more indicators: Quarterly balance sheet and income statement, by industry