Chart 2
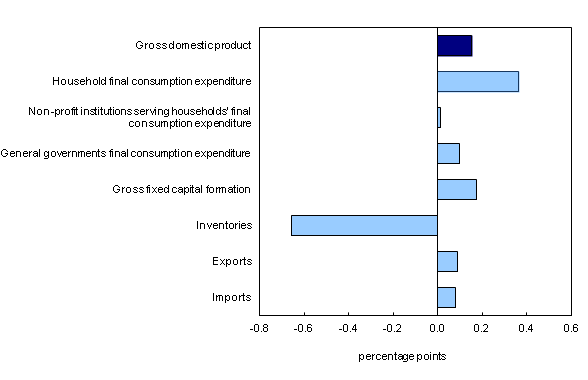
Contributions to percent change in real gross domestic product, fourth quarter 2012

Chart description
The title of the graph is "Contributions to percent change in real gross domestic product, fourth quarter 2012."
This is a bar clustered chart.
This is a horizontal bar graph, so categories are on the vertical axis and values on the horizontal axis.
There are in total 8 categories in the vertical axis. The horizontal axis starts at -0.8 and ends at 0.600000000000001 with ticks every 0.2 points.
There are 1 series in this graph.
The horizontal axis is "percentage points."
The vertical axis is "gross domestic product and components."
The title of series 1 is "gross domestic product and components."
The minimum value is -0.655 and it corresponds to "Inventories."
The maximum value is 0.364 and it corresponds to "Household final consumption expenditure."
| percentage points | |
|---|---|
| Imports | 0.080 |
| Exports | 0.089 |
| Inventories | -0.655 |
| Gross fixed capital formation | 0.174 |
| General governments final consumption expenditure | 0.098 |
| Non-profit institutions serving households' final consumption expenditure | 0.014 |
| Household final consumption expenditure | 0.364 |
| Gross domestic product | 0.153 |
- Date modified: