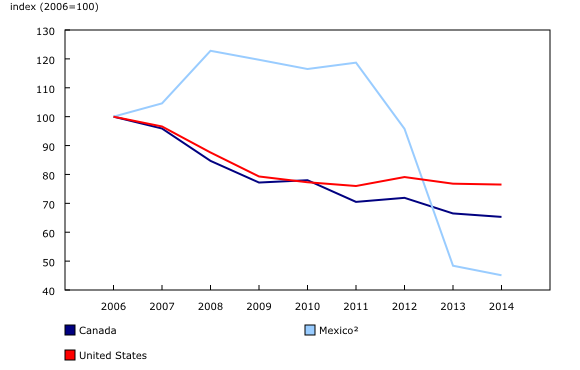
Chart 3
North America's transport-related road fatalities¹

1.
Road fatalities stem from the operation of passenger cars, light trucks, motorcycles, buses and large trucks, and include pedestrians.
2.
The number of fatalities occurring on federal highways in Mexico is not included in 2013 and 2014.
Source(s):
North American Transportation Statistics.
Chart description
This is a line chart.
| Canada | Mexico² | United States | |
|---|---|---|---|
| 2006 | 100.0 | 100.0 | 100.0 |
| 2007 | 95.9 | 104.6 | 96.6 |
| 2008 | 84.7 | 122.8 | 87.6 |
| 2009 | 77.2 | 119.7 | 79.3 |
| 2010 | 78.0 | 116.5 | 77.3 |
| 2011 | 70.5 | 118.7 | 76.0 |
| 2012 | 71.9 | 95.8 | 79.1 |
| 2013 | 66.5 | 48.4 | 76.8 |
| 2014 | 65.3 | 45.1 | 76.5 |
1.
Road fatalities stem from the operation of passenger cars, light trucks, motorcycles, buses and large trucks, and include pedestrians.
2.
The number of fatalities occurring on federal highways in Mexico is not included in 2013 and 2014.
Source(s):
North American Transportation Statistics.
- Date modified: