Rail transportation, 2016
Archived Content
Information identified as archived is provided for reference, research or recordkeeping purposes. It is not subject to the Government of Canada Web Standards and has not been altered or updated since it was archived. Please "contact us" to request a format other than those available.
Released: 2018-04-25
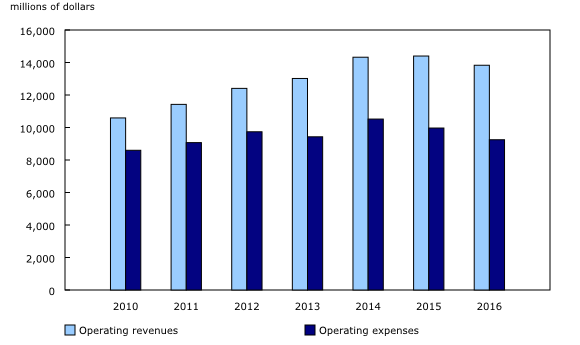
Canadian railway lines had operating revenue of $13.8 billion in 2016, down 4.0% from 2015. The drop was largely attributable to lower operating revenue for freight transportation.
In 2016, operating expenses of the rail carriers fell by 7.2% to $9.2 billion, down from $10.0 billion in 2015. The drop was driven by lower expenses in all four expense accounts (way and structures, equipment, rail operation and general expenses).
As a result of the larger drop in operating expenses over operating revenue, the railways recorded a higher net rail operating income in 2016 of $4.6 billion.
The amount of revenue freight tonnage declined 3.7% to 319.9 million tonnes, down from 332.1 million tonnes in 2015. There was also a corresponding drop of 3.9% for the revenue freight tonne-kilometres in all freight carriers.
The average number of employees fell 6.3% in 2016 compared with 2015, while total employee compensation declined 5.8%. However, the average annual employee compensation rose 0.4%.
In 2016, the number of locomotives in service decreased 0.8% to 3,157, the third consecutive yearly decline. The total number of freight cars (-3.0%) and the total number of passenger cars (-6.1%) also declined. In addition, the total amount of track operated by all carriers fell 2.1% to 62 207 kilometres.
Results from the Annual Capital and Repair Expenditures Survey indicated that capital spending on non-residential tangible assets fell by 9.6%, from $3.3 billion in 2015 to $3.0 billion in 2016, following seven consecutive annual gains. However, preliminary estimates for 2017 show that the industry's capital expenditures in non-residential tangible assets rose 1.4% and are anticipated to rise by 2.0% in 2018, largely attributable to an increase in spending on capital construction as spending on machinery and equipment is expected to drop.
Overall, fuel consumed by all railway rolling stock fell 6.3%, from 2.0 billion litres in 2015 to 1.9 billion litres in 2016, the second consecutive yearly decrease. Similarly, the total cost of diesel fuel purchased by the rail carriers fell 17.5% to $1.3 billion. Freight diesel consumption, which represented over 94% of total fuel consumption, also declined in 2016.
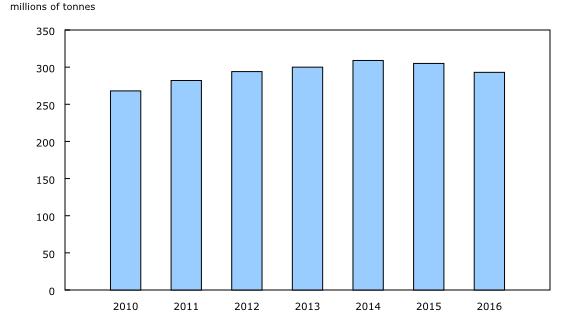
The volume of commodities transported by rail down for a second straight year in 2016
In 2016, the volume of commodities transported by Canadian rail carriers decreased for a second consecutive year, down 3.9% to 292.9 million tonnes.
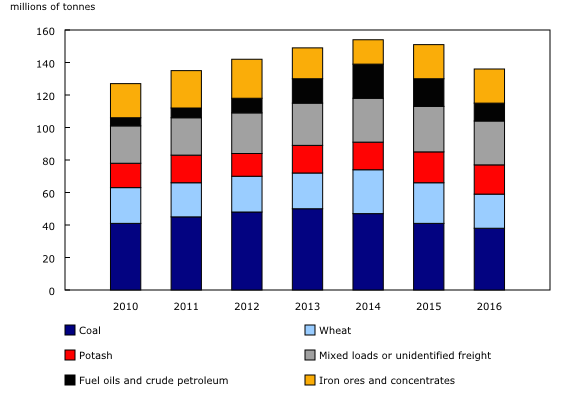
The drop was largely attributable to lower shipments of fuel oils and crude petroleum (-5.9 million tonnes or -35.7%), coal (-3.2 million tonnes or -7.8%) and wheat (-3.1 million tonnes or -12.7%).
Over half (57.4%) of all rail shipments by weight originated in three provinces in 2016: British Columbia (61.0 million tonnes), Alberta (58.3 million tonnes) and Saskatchewan (48.9 million tonnes).
From 2015 to 2016, tonnage loaded in containers-on-flat-cars edged up 0.5% to 36.6 million tonnes, while tonnage loaded in trailers-on-flat-cars decreased by 96.8% to 18 000 tonnes.
Shipments of coal and wheat decreased in 2016, but these products remained the top two commodities by weight. The top six commodities shipped by Canadian railways accounted for 43.2% of the total tonnage in 2016.
Note to readers
This release is based on two data sources—an annual survey and a commodity origin and destination statistics administrative file from Transport Canada. The former collects financial as well as operating and employment data from a census of Canadian railways that provide for-hire freight and passenger services.
The commodity origin and destination statistics file monitors movements of commodities carried by Canadian National Railway (CN), Canadian Pacific Railway (CP), carriers that interline with CN and CP, as well as a number of regional and short-haul carriers that do not interline with either CN or CP.
Data aggregations are available for Canada and select geographic regions.
Contact information
For more information, or to enquire about the concepts, methods or data quality of this release, contact us (toll-free 1-800-263-1136; 514-283-8300; STATCAN.infostats-infostats.STATCAN@canada.ca) or Media Relations (613-951-4636; STATCAN.mediahotline-ligneinfomedias.STATCAN@canada.ca).
- Date modified:


