Homicide in Canada, 2009
Archived Content
Information identified as archived is provided for reference, research or recordkeeping purposes. It is not subject to the Government of Canada Web Standards and has not been altered or updated since it was archived. Please "contact us" to request a format other than those available.
by Sara Beattie and Adam Cotter
Homicide rate remains stable over past decade
Highest homicide rates continue to be in western and northern Canada
Abbotsford-Mission has highest homicide rate for second year in a row
Gang-related homicides decline
Winnipeg reported highest rate of gang-related homicides
Firearm-related homicides down 12%
Two-thirds of recovered firearms not registered
Highest rate of male youth accused of homicide since data was first collected
Second lowest rate of female victims ever recorded
Increase in homicides committed by strangers
Slight increase in spousal homicides
Taxi drivers and police officers have highest occupational risk
Detailed data tables
Notes
There were 610 homicides reported by police in 2009, 1 less than the previous year.
Homicides continue to be a relatively rare occurrence in Canada, accounting for less than 1% of all violent crimes reported by police. Canadians are about six times more likely to commit suicide and about five times more likely to be killed in a traffic accident than they are to be a victim of homicide.1
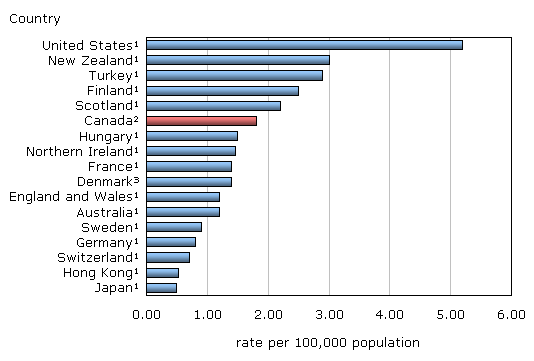
Homicide is the most serious criminal offence, and a country's homicide rate can be used as a barometer to measure the level of violence in that society. It is also the only criminal offence that is directly comparable among nations. Canada's homicide rate continues to be about one-third that of the United States, but comparable to many European nations (Chart 1).
Chart 1
Homicide rates for selected countries
1. Figures reflect 2008 data.
2. Figures reflect 2009 data.
3. Figures reflect 2007 data.
Source: Statistics Canada, Interpol Ottawa and national statistical office websites.
Homicide rate remains stable over past decade
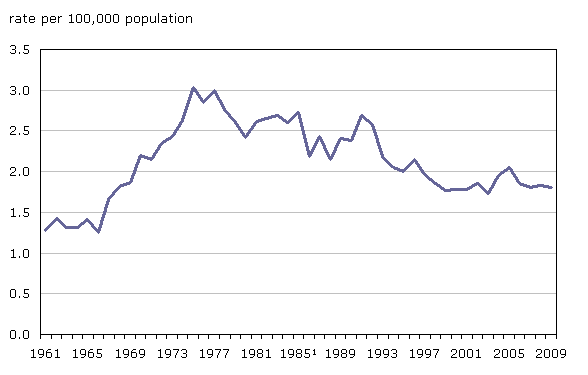
Between the mid-1960s and mid-1970s, Canada experienced a sharp rise in homicide, as the rate more than doubled over this period, from 1.25 homicides per 100,000 population in 1966 to 3.03 in 1975. The homicide rate generally declined over the next 25 years, dropping 42% between 1975 and 1999. Since 1999, despite some annual fluctuations, the rate has remained relatively stable (Chart 2).
While the majority (94%) of homicide incidents in 2009 involved one victim, there were 35 incidents involving multiple victims: 26 involved 2 victims, 6 involved 3 victims and 3 involved 4 victims.
Chart 2
Homicides peaked in mid-1970s
1. Excludes 329 victims killed in the Air India incident.
Source: Statistics Canada, Canadian Centre for Justice Statistics, Homicide Survey.
Highest homicide rates continue to be in western and northern Canada
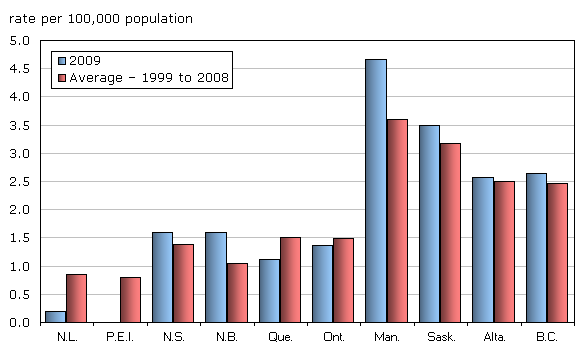
Historically, the western provinces and the territories have reported the highest homicide rates in the country. This trend continued in 2009 with Nunavut and Yukon reporting the highest rates in the nation. Among the provinces, Manitoba reported the highest rate for the third consecutive year, followed by Saskatchewan, British Columbia and Alberta.
Prince Edward Island and Newfoundland and Labrador reported the lowest rates (Table 1B). This pattern was similar to that for overall violent crime.
Alberta, with 95 homicides in 2009, had the largest decline among the provinces, down from 110 in 2008 (Table 1A). Quebec's homicide rate per 100,000 population continued to decline in 2009, reaching its lowest point in over 40 years (Table 1B).
In 2009, two provinces had notable increases in homicides from the previous year: Saskatchewan, with 36 homicides (an increase of 6 from 2008) and New Brunswick, with 12 homicides (an increase of 9 from 2008). The increase in New Brunswick followed a 40-year low in 2008 (Table 1B).
Chart 3
Highest homicide rates in Manitoba and Saskatchewan
Source: Statistics Canada, Canadian Centre for Justice Statistics, Homicide Survey.
Abbotsford-Mission has highest homicide rate for second year in a row
Violent crime, and particularly homicide, is often perceived to be a phenomenon of larger cities. However, the homicide rate for the 10 census metropolitan areas (CMAs)2 with populations over 500,000, representing almost 18 million Canadians, was 1.7 in 2009, compared to a rate of 2.1 for the 10.5 million Canadians living in non-CMA areas under 100,000 population.
Over the previous 10 years, the homicide rate in CMAs and non-CMAs was virtually identical. The lowest homicide rates were actually reported in CMAs between 100,000 and 500,000 population, both in 2009 and over the previous 10 years.
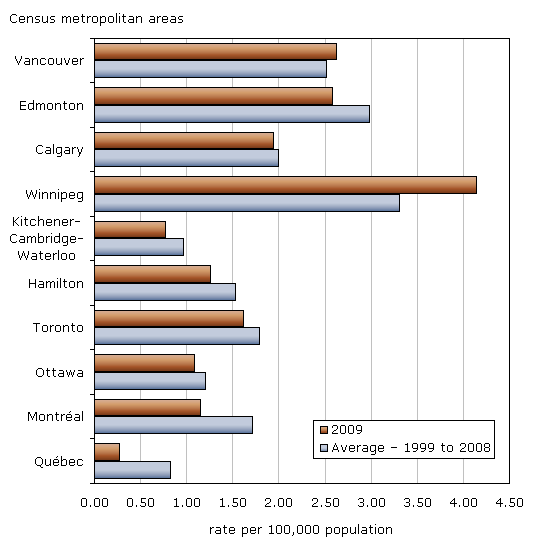
Among CMAs, Abbotsford-Mission reported the highest homicide rate per 100,000 population (5.2) for the second consecutive year in 2009, followed by Thunder Bay (5.0), Winnipeg (4.1), Saguenay (3.4), Halifax (3.0), Vancouver (2.6) and Edmonton (2.6) (Table 2).
Comparing the three largest CMAs, Toronto reported 90 homicides in 2009, 13 fewer than in 2008. Vancouver reported 61 homicides in 2009, 7 more than in 2008, for a rate of 2.6. Toronto's rate of 1.6 per 100,000 population was below the national average of 1.8. Montréal reported 44 homicides, down 4 from 2008, for a rate of 1.2.
Chart 4
Among the largest census metropolitan areas homicide rates highest in west
Source: Statistics Canada, Canadian Centre for Justice Statistics, Homicide Survey.
Gang-related homicides decline
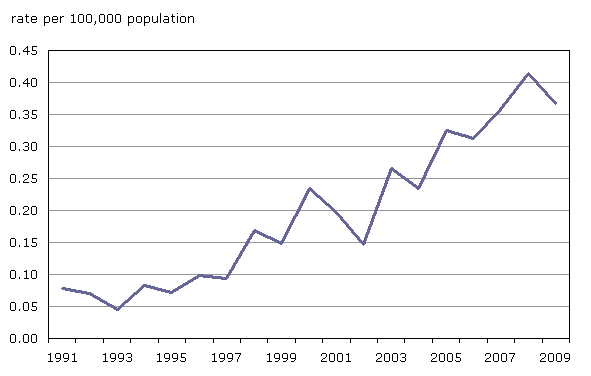
Homicides classified as "gang-related" by police, include victims who are members of organized crime groups and street gangs, as well as any innocent bystanders in a gang-related homicide incident. In 2009, 124 homicides (or 1 in 5) of the 610 homicides reported by police were considered to have been gang-related, 14 fewer than in 2008. Despite the decline, gang-related homicides have generally been increasing since the early 1990s.
Most of the 2009 decrease occurred in Alberta, where gang-related homicides dropped from 35 in 2008 to 13 in 2009. Gang-related homicides in this province had previously generally been increasing since 2003 (Table 3).
Chart 5
Gang-related homicides decline in 2009
Note: These data became available beginning in 1991.
Source: Statistics Canada, Canadian Centre for Justice Statistics, Homicide Survey.
Historically, gang-related homicides have been more likely than non-gang-related homicides to be classified as first degree murder—a homicide that was planned and deliberate. Bill C-14 was introduced in 2009 to ensure that all gang-related homicides would be classified as first-degree, whether or not they meet the pre-existing standards of being planned and deliberate.
Both victims and offenders of gang-related homicides are, on average, younger than those of non-gang-related homicides. The average (mean) age of gang-related homicide victims was 28 years compared to 35 years for non-gang-related homicide victims.
The average age of persons accused of committing a gang-related homicide in 2009 was 23 years, compared to 30 years for non-gang-related accused persons.
Winnipeg reported highest rate of gang-related homicides
The large majority of gang-related homicides occurred within Canada's largest cities. The 10 largest CMAs accounted for half of Canada's homicides in 2009, but more than two-thirds of gang-related homicides.
Winnipeg, with 9 gang-related homicides, reported the highest rate per 100,000 population among the 10 largest CMAs, followed by Vancouver. Despite having the most (30) gang-related homicides of any CMA in 2009, Toronto's rate was lower than both Winnipeg and Vancouver.
The largest decline among all CMAs was seen in Calgary, which had the highest rate in the country in 2008. The number of gang-related homicide victims in Calgary fell from 16 in 2008 to 5 in 2009.
Firearm-related homicides down 12%
For the past 30 years, there have been two primary methods used to commit homicide: shooting and stabbing. In 2009, this trend continued, as there were 210 victims (36%) killed by stabbing and 179 victims killed by a firearm (30%). A further 20% of victims were beaten, 7% were strangled or suffocated and 7% were killed by other methods such as vehicles, fire (smoke inhalation, burns), poisoning and shaken baby syndrome (Table 6).
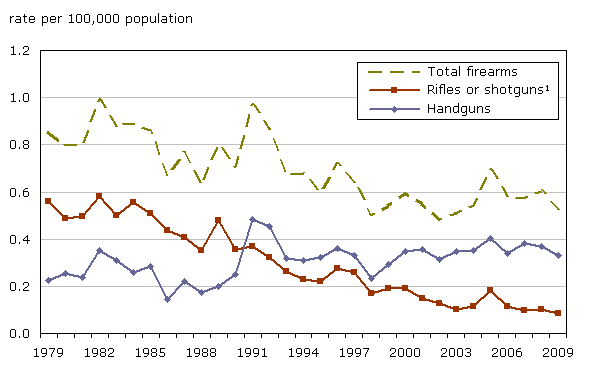
In 2009, the rate of homicides committed with a firearm dropped by 12%, after having increased 24% between 2002 and 2008. Previous to 2002, firearm homicides had generally been declining since the mid-1970s.
Declines were reported for all three of the most common types of firearms in 2009: handguns, rifles/shotguns and sawed-off rifles/shotguns. Handguns were the most common type of firearm used in homicides.
Of the 179 homicides committed with a firearm in 2009, 112 (or 69%) involved handguns. There were 29 homicides committed with a rifle/shotgun, the lowest number reported since data was first collected in 1961, and 14 with a sawed-off rifle/shotgun (Table 4).
Despite declining in 2009, the use of handguns has generally been increasing over the past 30 years. In contrast, the use of rifles/shotguns has generally been declining.
Chart 6
Use of firearms declines in 2009
1. Excludes sawed-off rifles or shotguns.
Source: Statistics Canada, Canadian Centre for Justice Statistics, Homicide Survey.
Handguns remained the most common type of firearm involved in homicides in major metropolitan areas, accounting for almost three-quarters (73%) of all firearm homicides in CMAs in 2009. In non-CMA areas, rifles or shotguns were the most prevalent, being used in about four in ten firearm homicides.
With 33 fatal shootings, Vancouver reported the highest rate of firearm homicides per 100,000 population among the largest 10 CMAs, followed by Toronto (Table 5).
In 2009, 80% of gang-related homicides were committed with a firearm, compared to 16% of homicides that did not involve gangs. Among all gang-related homicides that were committed with a firearm in 2009, handguns were used in 70% of incidents.
Two-thirds of recovered firearms not registered
Over the past 5 years, police have recovered 253 firearms that were used to commit homicide where the registration status with the national Firearms Registry was known. Of these, 78 (31%) were registered and 175 (69%) were not registered. Of the firearms that were registered, 52 were rifles or shotguns, 17 were handguns and 9 were sawed-off rifles or shotguns.
For the 212 incidents where the firearm was recovered and ownership could be determined, 103 (49%) were owned by the accused, 17 (8%) by the victim and 92 (43%) by another person. The firearm was reported as stolen in 43 of these incidents.
Highest rate of male youth accused of homicide since data was first collected
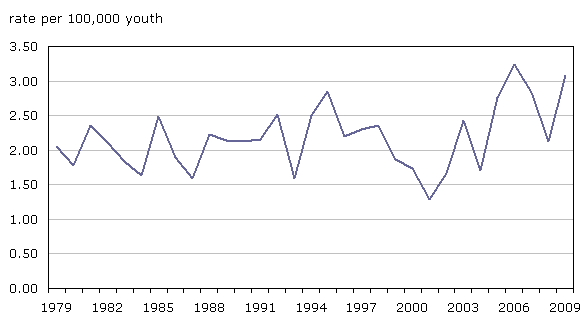
Police identified 78 youth aged 12 to 17 accused of committing homicide in 2009 including 73 males and 5 females. This was an increase of 23 over 2008 and the second highest number and rate in over 30 years (Table 7). The rate of youth accused of homicide has generally been increasing since 2001.
The 2009 rate of male youth accused (5.6 per 100,000 male youth) was the highest rate reported since data were first collected in 1961.
In 2009, there were 22 youth (all of whom were male) accused of committing a gang-related homicide, up from 10 in 2008. Most of the increase occurred in Manitoba, the province with the highest youth homicide rate.
Compared to adults, more incidents of homicide involving youth were gang-related. Among incidents with an accused youth, 28% involved gangs compared to 12% of incidents with an adult accused.
Chart 7
Second highest rate of youth 12 to 17 years accused of homicide in over 30 years
Note: Data are available back to 1961.
Source: Statistics Canada, Canadian Centre for Justice Statistics, Homicide Survey.
Second lowest rate of female victims ever recorded
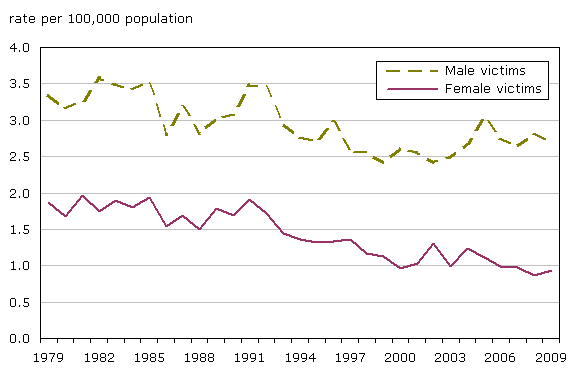
There were 160 female homicide victims in 2009, 14 more than in 2008. Despite this increase, 2009 represented the second lowest proportion (26%) of female homicide victims since data were first collected. The rate of female victims has generally been declining since the late 1960s.
Chart 8
Second lowest rate of females killed in over 30 years
Note: Data are available back to 1961.
Source: Statistics Canada, Canadian Centre for Justice Statistics, Homicide Survey.
As has been the case historically, males accounted for about 9 in 10 accused in homicides in 2009 (Table 9). Males accused of homicide have been getting younger in recent years. The average (mean) age of accused males has fallen from 32 in 2002 to 29 in 2009. The average age of accused females has remained constant at around 30 years of age.
Increase in homicides committed by strangers
Homicide victims in Canada are most likely to be killed by someone known to them (chart 9). Of all homicides that were solved (police identified an accused person) in 2009, 39% of victims were killed by an acquaintance, 34% by a family member and 9% by someone known to them through criminal activities such as drug trafficking (Table 8).
Chart 9
Most homicides committed by someone known to victim
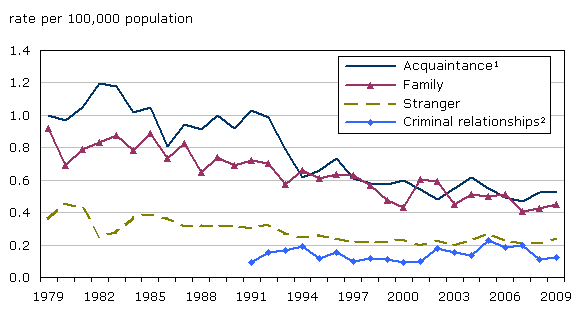
1. Prior to 1991, criminal relationship was included in acquaintance.
2. Include prostitutes, drug dealers and their clients, loansharks, gang members. It should be noted that some gang homicides are scored under "acquaintance". Criminal relationship was added to the Homicide Survey in 1991.
Source: Statistics Canada, Canadian Centre for Justice Statistics, Homicide Survey.
In addition, 82 homicides were committed by someone not known to the victim, an increase of 17% over 2008. The number of homicides committed by a stranger was also substantially higher than the previous 10 year average. In 2009, Alberta and Saskatchewan had the largest increases in homicides committed by strangers from the previous year.
Slight increase in spousal homicides3
The rate of spousal homicide has generally been declining since the mid-1970s. In 2009, there were 65 spousal homicides, 3 more than the previous year. Despite this increase, spousal homicide rates in 2007, 2008 and 2009 were the lowest reported since the mid 1960's (Chart 10). There were four more female spousal homicide victims than in 2008 and two fewer male spousal homicide victims. There was also one more same-sex spousal homicide than in 2008.
In 2009, spousal homicide rates were lowest in Newfoundland and Labrador, Prince Edward Island, Nova Scotia and the Yukon. The highest rates were found in Nunavut, Northwest Territories, Manitoba, Saskatchewan and British Columbia.
Women continue to be about three times more likely to be victims of spousal homicide than men. In 2009, 49 women and 15 men were killed by a current or former spouse (excludes one same-sex spousal victim). Men were more likely to be killed by a common-law spouse, while women were more often killed by a legally-married spouse. Women also continue to be at greater risk than men of being killed by an ex-spouse. In 2009, 14 of 49 female spousal victims were killed by a separated or divorced spouse, compared to 2 of 15 male spousal victims (Table 8).
In addition to the 65 spousal homicides, there were 23 homicides committed by a current or former boyfriend/girlfriend or intimate partner in 2009, 4 fewer than the previous year. The majority of these victims (78%) were female.
Chart 10
Spousal homicide rate generally declining over the past 30 years
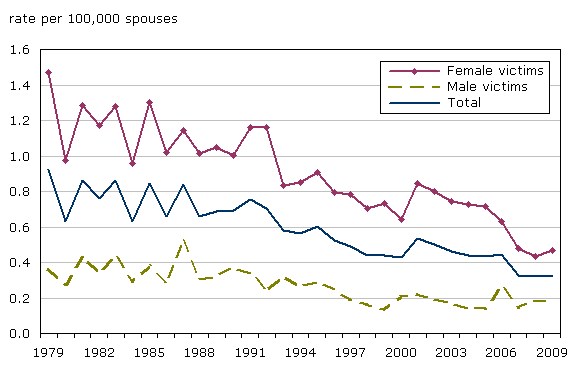
Note: Spouses include legally married, common-law, separated, and divorced persons age 15 years or older. Excludes same-sex spouses due to the unavailability of Census data on same-sex couples.
Source: Statistics Canada, Canadian Centre for Justice Statistics, Homicide Survey.
Taxi drivers and police officers have highest occupational risk
On average, 13 victims have been killed each year since 1999 while "on the-job", including 11 in 2009. A recent report4 concludes that taxi drivers and police officers have the highest rates of homicide per 100,000 persons in their occupation. In 2009, there were three taxi drivers and one police officer killed as a direct result of their profession.
In addition, police reported three prostitutes killed as a direct result of their profession in 2009, lower than the average of seven prostitutes killed annually over the past decade.
Detailed data tables
Table 1A Number of homicides by province or territory, 1979 to 2009
Table 1B Homicide rates by province or territory, 1979 to 2009
Table 2 Homicides by census metropolitan area
Table 3 Gang-related homicides, by region, 1999 to 2009
Table 4 Homicides involving firearms, by type of firearm, Canada, 1999 to 2009
Table 5 Gang-related and firearm homicides, census metropolitan areas over 500,000 population, 2009
Table 6 Methods used to commit homicide, Canada, 1999 to 2009
Table 7 Youth (12 to 17 years) accused of homicide, Canada, 1999 to 2009
Table 8 Solved homicides by accused-victim relationship, Canada
Table 9 Homicide victims and accused persons, by sex, Canada, 1999 to 2009
Notes
- There were 3,097 deaths resulting from a traffic accident and 3,511 suicides reported to Statistics Canada, Canadian Vital Statistics–Death Database in 2006, the latest year for which data are available.
- A census metropolitan area (CMA) consists of one or more neighbouring municipalities situated around a central core. A CMA must have a total population of at least 100,000 of which 50,000 or more live in the central core. To be included in the CMA, other adjacent municipalities must have a high degree of integration with the central core, as measured by commuting flows derived from census data. A CMA typically comprises more than one police service.
- Includes common-law, separated and divorced spouses.
- Sara Dunn, "Homicides against police officers, 1961 to 2009", Juristat, vol. 30, no. 3, Statistics Canada catalogue no. 85-002.
- Date modified:

