
By Christian Ritter, William Spackman, Todd Best, Serge Goussev, Greg DeVilliers, Stephen Theobald, Statistics Canada
Introduction
As Statistics Canada (StatCan) has shifted to an administrative-data-first strategy (Statistics Canada Data Strategy), the agency has also increasingly researched and leveraged Machine Learning (ML) (Data science projects), not only due to the volume and velocity of the new data, but also due to its variety as certain parts of the data are unstructured or semi-structured. The agency's adoption of ML has been guided by the Framework for Responsible ML (Responsible use of machine learning at Statistics Canada) to make investments to support sound application and methods, and has also included a focus on developing production level code and other best practices (Production level code in Data Science). One of the types of best practices that has been developed is a focus on transparency, reproducibility, rigour, scalability, and efficiency – processes that are also known as Machine Learning Operations or MLOps. This article provides an overview of the investments made and plans for future development in MLOps at Statistics Canada, focusing on the price statistics use case, specifically for the Canadian Consumer Price Index (CPI).
Similar to many National Statistical Organizations (NSOs), Statistics Canada's CPI program leverages supervised Machine Learning to classify new unique products (UN Task Team on Scanner Data (2023)) from alternative data sources (ADS), such as scanner, web scraped, or administrative data, to the product classes used for its CPI. A particular concern with this administrative data from the consumer economy is how dynamic it is over time, as new products enter the market and old products exit. From an ML point of view, this change over time can be considered as the gradual shift of the data distribution for each month's data that needs to be classified, compared to the distribution on which an ML model was trained on, resulting in gradual model degradation (see Figure 1 for a visualization of concept). As shown by Spackman et al (2023) and Spackman et al (2024), misclassification can also affect a price index, thus a reliable approach is needed to combine data and model monitoring, validation of records to correct for misclassification, and frequent retraining to make sure that price indices are unaffected any misclassifications. MLOps helps address these concerns through a robust ML production process.
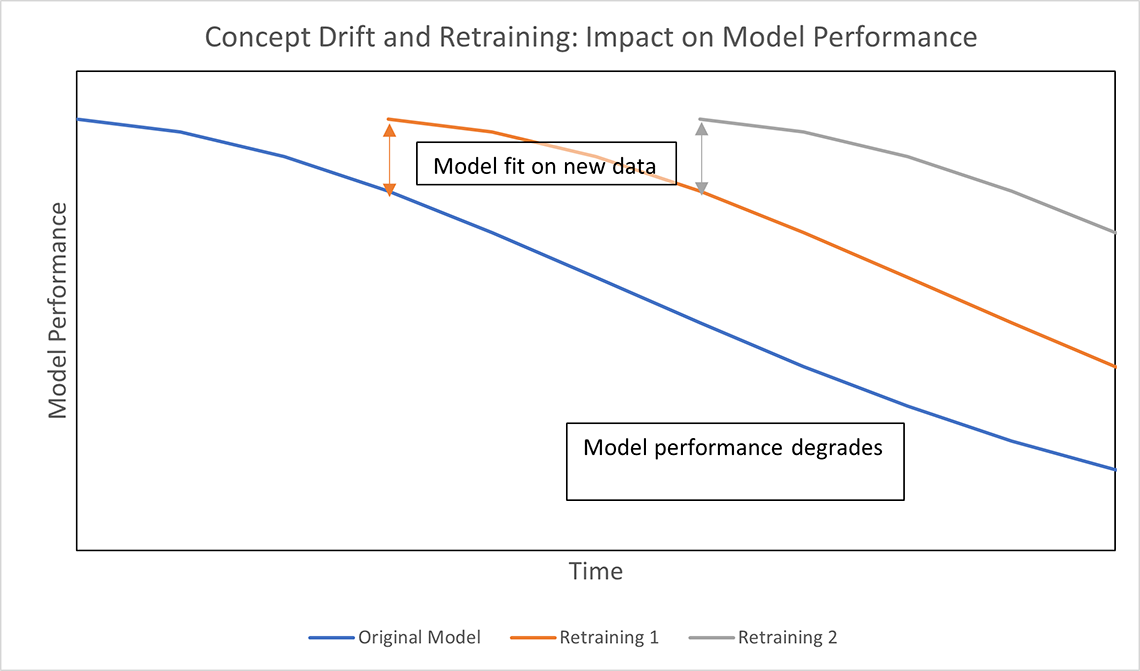
Description - Figure 1: Concept Drift and retraining: Impact on Model Performance.
Classification performance on new products that are observed in web scraped data decreases steadily over time, however retraining the model on a periodic basis (every 3 months, for instance) will bring up the performance.
Why does MLOps bring value in this situation?
The application of ML to a production process requires detailed consideration of several end-user business needs, such as:
- Overall efficiency, such as cost effectiveness of the maintenance.
- Ability to perform model inference on production of big data with its 5+ v's (volume, veracity, velocity, variety, and value).
- Ensure transparent and efficient usage of the highly complex algorithms.
- Ensure a continuous reliable and acceptable model performance with low risk.
- Enable the use of many models, in parallel or through updates.
- Handle the complex dependency of open-source ML frameworks and packages.
- Meet organizational governance requirements.
Addressing such business needs puts the actual ML model as a very small component in the context of the overall ML production process as highlighted in Sculley et al (2015) and shown in Figure 2.
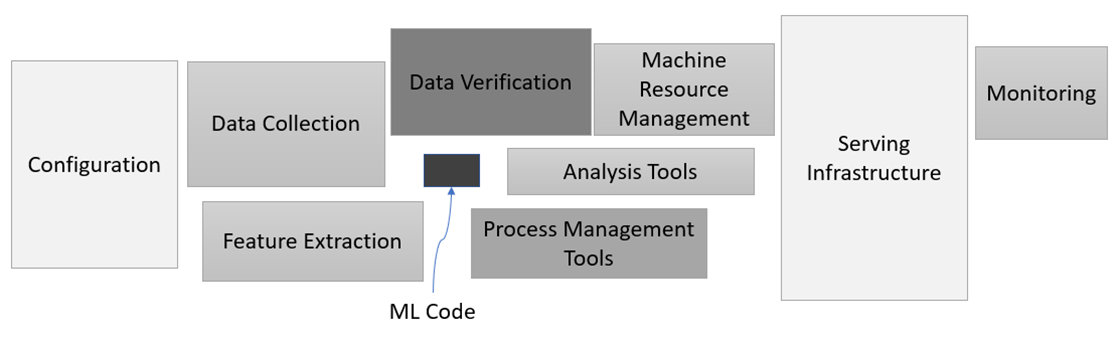
Description - Figure 2: Hidden Technical Depth in Machine Learning Systems, adapted from Figure 1 in Sculley et al (2015).
Machine Learning, as in the modeling itself, is actually a small component of many larger components when it comes to robust production systems. For example, configuration is a big topic, having processing for serving, monitoring, or analyzing the model and performance is key. Developing processes for data verification, resource management, process management, and data collection and extraction – are all necessary to also invest in.
In general, there have been significant efforts to address similar business needs for decades (particular in the finance industry), but this effort received a significant boost of relevancy when ML went mainstream across industries, and additional needs emerged, e.g., the need to handle big data and the more and more complex neural networks. MLOps describes the ML production process which aims to address all the common business needs previously listed. The MLOps of today can be understood as a paradigm or approach to enable automated, effective, transparent, and iterative delivery of ML models into production while also focusing on business and regulatory requirements. Hence it has many benefits, especially for StatCan. MLOps covers statistical methodologies (e.g., drift detection, misclassification), best practices in software engineering (e.g., DevOps) as well as (cloud) infrastructure and tools (e.g., system design, monitoring, scalable solutions).
The automated and iterative approach in MLOps borrows from DevOps practices of software engineering, which in the ML context enables cost savings, increased speed of model creation and model deployment, allowing the usage of many models. Furthermore, governance and transparency increase through use of MLOps. The model creation process with its complex multi-step approach involving data and software dependencies is represented through training pipelines. Frequent model (re)training (continuous retraining) is often necessary to mitigate the accuracy degradation of ML models due to data drift.
Complementarily, the model deployment process often borrows from software engineering with the concept of 'deployment' of software, the model, and its dependencies, into an isolated production environment. Often, the deployment occurs on scalable infrastructure (i.e. easy to increase or decrease compute resources) to handle the big-data characteristics; with the model encapsulated and integrated through a clear, easy-to-use interface (i.e. interactable via an Application Programming Interface or API). This process has its ML-specific components, such as the need to log and monitor data and model behavior and potentially allow for ML interpretability or explainability functionality.
How does MLOps approach integrate within price statistics needs?
Supervised machine learning is a key tool within consumer price statistics processing pipelines. Specifically, as the CPI is built up from price indices for elementary aggregates, which are pairings of product and geography classes (The Canadian Consumer Price Index Reference Paper, Chapter 4 – Classifications), classification must be done for unique products to their correct respective product codes (i.e. categories). From a technical point of view, this is a Natural Language Processing problem, similar to other examples at Statistics Canada (2021 Census Comment Classification), whereby the text describing a product is used by the model to classify the product to a group used for price indices. As classification is not perfect, manual validation of records is necessary to correct errors prior to compiling price indices. This validation additionally helps create new examples that can be used as retraining data. Statistics Canada has a rich experience of this process, with more detail outlined as step 5.2 of the Generic Statistical Business Process Model (GSBPM) (2021 Census Comment Classification). Figure 3 demonstrates this key step as central to a processing pipeline on a typical alternative data source such as scanner data, prior to the file being able to be used in production.
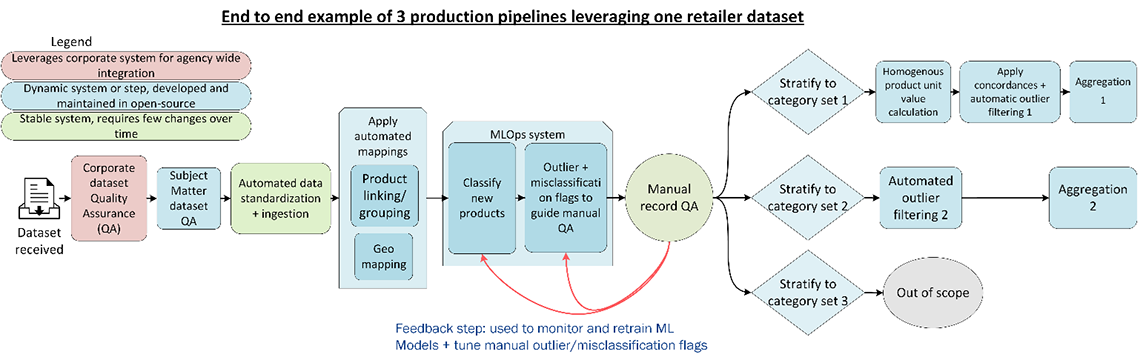
Description - Figure 3: Application of MLOps within the consumer price statistics processing pipeline. Manual record quality assurance (QA) is useful for not just validation of the classification step, but also to create retraining data. To support this manual QA, a specific misclassification and outliner flag processes is designed.
The consumer price statistics processing pipeline starts with dataset quality assurance. It then continues to the standardization of the data and ingestion of it into a central storage location for analytics. From here, near identical but homogeneous products can be linked together and geography is mapped for price statistics needs. This is where MLOps system is required – to classify each unique product to the product class it should belong to. Records are then manually reviewed, with specific focus paid to records flagged as misclassified or outliers. Finally, elementary price aggregation can be done on this data, depending on the strata that this specific price aggregation methodology needs.
Adopting MLOps principles to this use case would add considerable maturity to the process. Table 1 below summarizes the value promised (left) and how it addresses concrete price statistics needs (right).
| MLOps Promise | How it addresses price statistics needs |
|---|---|
| General cost savings | Automation of processes save cost on compute and data scientist work |
| Stabilizes pipeline for entire ML lifecycle through DevOps practices | Less error prone and lower risk of friction along the road from model development to production |
| Ease friction at every point in the MLOps process through automation | Automation of complex steps of Data Science work includes preprocessing and training, makes work reproducible and transparent |
| Re-use of model creation pipeline to produce 100s of models | Training models based on new data can be used to continuously create ML models, by pointing the training pipeline to new data |
| Allows faster ML model deployment, easier and faster | Addresses need to produce multiple models per alternative data source at higher frequency |
| Leverages central location of model tracking and versioning | Maintaining 100s of models requires a central model store, also increasing lineage and governance control |
| Easy and automated scaling of compute during the MLOps process appropriate to the time and scale needed | Allow to scale with the increasing amount of data using high performance compute and distributed systems, with cost-effective usage |
| Extended monitoring: from infrastructure to model monitoring | Ensuring reliable performance of models despite a multitude of factors such as model updates, data drift, and errors |
| Common workflow and policy | A standardized automated process allows the organization to address its requirements around Artificial Intelligence (AI) usage |
| Handles complex (open source) dependencies | Software engineering best practices such as virtualization, testing and Continuous Integration (CI) and Continuous Delivery (CD) (together referred to as CI/CD), reduce the risk of (silent) failure |
| Auditing and governance | Reproducibility through version control of all ML artifacts, easy adoption of accountability and control frameworks such as Responsible AI Framework |
Road to adoption via Iterative Maturity Model
Integration into existing process
As described above, product classification (and outlier/misclassification detection) are components of a much larger process with alternative data, and hence the integration needs to be performed in a decoupled modular fashion, following best architectural design practices. Classification service/MLOps system is exposed through dedicated REST APIs to the rest of the processing system which allows a smooth integration. Updates and changes to this MLOps system must not impact the overall system so long as no API contracts are violated.
Maturity steps
Based on business requirements and a feasibility study, an iterative approach was designed for MLOps adoption through four MLOps Maturity levels. These steps, similar to industry best practices such as described by Google (MLOps: Continuous delivery and automation pipelines in machine learninng) or Microsoft (Machine Learning operations maturity model), adopt an increasing level of automation and addresses of a variety of risks. Value generation is possible from Level 1 onwards by addressing the most critical aspects of production ML.
| Maturity | Coverage |
|---|---|
| Level 0 | Before the MLOps adoption; Jupyter notebook used for modeling and Luigi scripts for inference and orchestration |
| Level 1 | Automatic training through continuous training pipelines, ML artifact management and version control; basic data quality checks and monitoring |
| Level 2 | Automatic scalable ML model inference on new data; continuous deployment to scalable endpoints |
| Level 3 | Monitoring with performance-based drift detection, shadow model deployments, automated retraining, responsible AI with model cards and standardized reporting |
Overview of the system architecture and capabilities
Before diving into each component and capability of the system, a visual of the overall architecture and execution workflows is provided. Pipelines (as code) are published to the production environment and then executed following MLOps best practices to ensure reproducibility. Metadata is kept on each aspect and provenance is well established.
Production workflow
Firstly, the workflow that happens every time with a new retailer dataset is described. Figure 4 visualizes the steps that can be summarized as a multi-step batch process:
- Initial state: A new retailer dataset arrives through bronze-silver-gold process in the data warehouse.
- A Synapse pipeline is triggered which extracts the new unique product data to the data lake and calls our main REST endpoint.
- The main REST endpoint executes an orchestration pipeline which interacts with different (component) pipelines.
- First it calls the data validation pipeline which tests data expectations defined through great expectations (Great Expectations GitHub). Failure results in automatic data reports.
- The classifier pipeline follows, with the type of data and the retailer in question being used as parameters to identify the production-staged models in the registry as well as the corresponding deployments under the managed endpoints as appropriate in this case.
- The deployments distribute the data across multiple nodes for processing in parallel.
- The resulting classifications are validated and checked for outliers/misclassifications via versioned methods. Outliers or misclassified product candidates are categorized.
- The orchestrator puts the classified data onto the lake which triggers the execution of a Synapse pipeline for the loading of this output data into the data warehouse.
- Classification results and outlier data is ingested back into the data warehouse.
- Classification results and outlier data are now available in the warehouse for downstream consumption (and most critically validation).
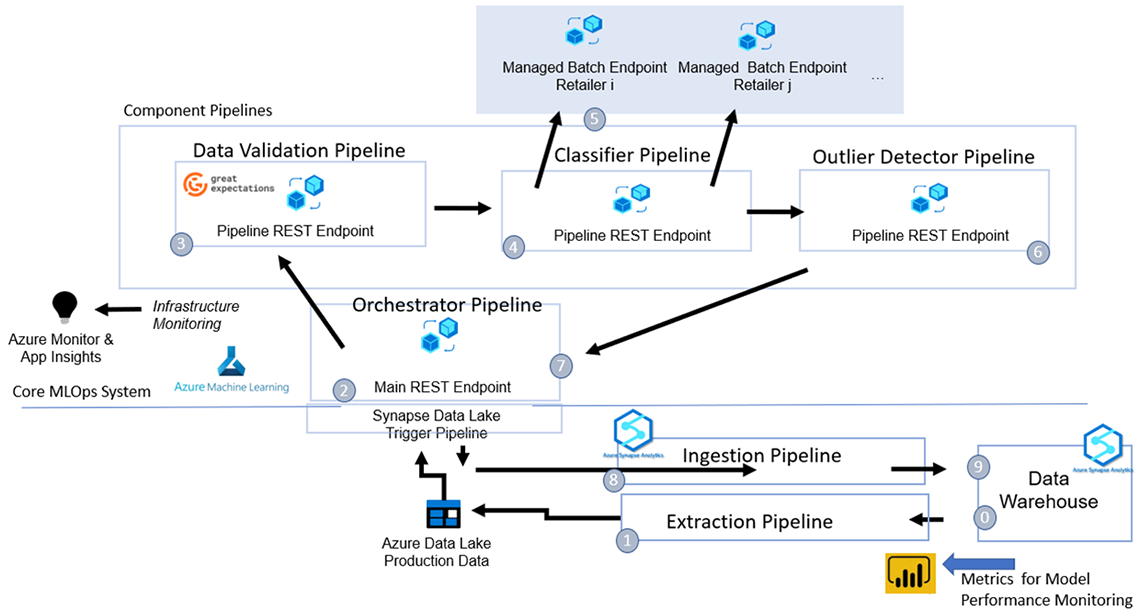
Description - Figure 4: Schematic Production Processing Workflow
See production workflow summary above for a detailed step by step overview of this 9-step process.
Model creation workflow
The process to create the model is done separately from the production workflow. Figure 5 visualizes the steps:
- Modeling code is pushed to the development branch on GitLab, which triggers the CD pipeline to integrate the pipeline code in Azure Machine Learning (Azure ML).
- Inside the CI process, the code is tested following established procedures.
- Once approved through a merge request, the CD pipeline publishes the training pipeline to the workspace as a new version, where it becomes available for execution. Note it contains the training configuration for different retailers as required.
- The training pipeline can be executed by pointing it to a location on the data lake where the pre-determined training (or retraining) data is stored. This step can be scheduled to run when updated retraining data is created. If training is successful, the model is registered in the Azure ML model registry under a unique name and version.
- The definition of which model is in production is stored in a configuration file on GitLab; changing this file triggers a change in the deployment configuration. Models in MLflow (MLflow Tracking: An efficient way of tracking modeling experiments) are tagged accordingly in the model registry, and then deployed as a deployment under a corresponding managed endpoint.
- Depending on the needs of the data, one model may be used for each retailer or multiple. Shadow models are also leveraged where applicable to allow a robust update process of models after a phase of monitoring.
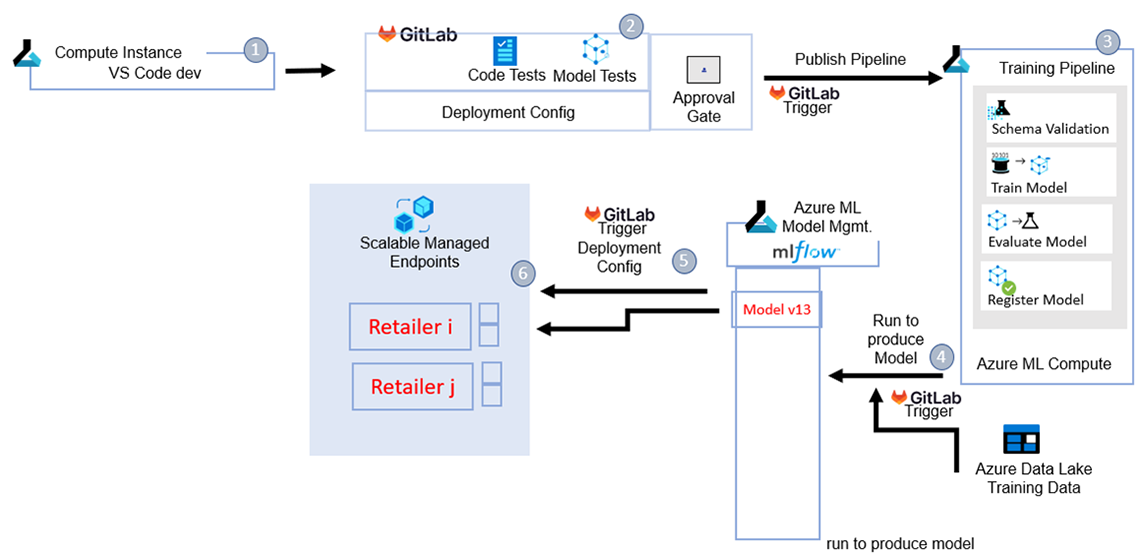
Description - Figure 5: End-to-end: from training to deployment.
See model creation workflow summary above for a detailed step by step overview of this 6-step process.
Detailed overview of MLOps capabilities
While the system architecture automates in a robust way all required production aspects as well as supports automated retraining, these steps are necessary to deal with data drift.
Concept of data drift
In dynamically changing and non-stationary environments, the data distribution can change over time yielding the phenomenon of concept drift (João, et al. 2014). In the context of consumer price data, this could be reflected as new product categories being introduced to the market over time and changing consumer preferences. Degradation of model performance will be encountered if the change in data distribution alters the decision boundary between classes, known as real concept drift (Figure 6).
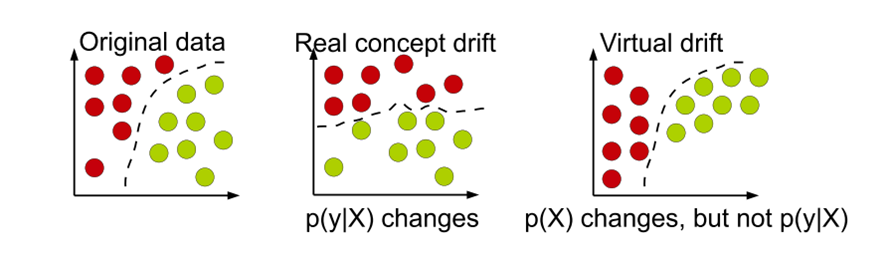
Description - Figure 6: Types of drifts: circles represent instances, different colors represent different classes (João, et al. 2014).
A simplified example is provided to demonstrate drift. The original data (left) follows a specific distribution, and a model learns to fit a decision boundary to categorize the data into two classes. If the distribution shifts (middle), i.e. P(y|X), retraining is needed to refit the data and learn a new decision boundary to categorize the data into two classes. However, there can also be virtual drift, whereby P(X) shifts, but the p(y|X) does not shift, hence the existing decision boundary still works well.
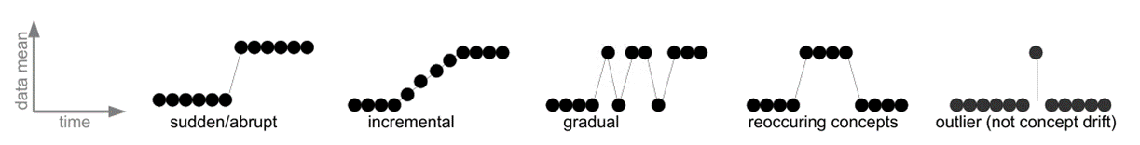
Description - Figure 7: Patterns of changes over time (outlier is not concept drift) (João, et al. 2014).
Five scenarios are shown for distribution change. The first is a sudden or abrupt shift, whereby the distribution shifts at one point and then stays at the new distribution. The second could be incremental, whereby shift happens continuously over time and eventually it stabilizes to a new level. The third could also be gradual, but instead of being continuous, it could shift rapidly and then shift back, and operate like this for a while before settling at the new level. Fourthly, shift could be reoccurring, whereby a shift occurs to a new level, but it stays at this level for only a while, before returning back to the original level. Finally, there could just be an outlier and not drift.
It is important that the implemented MLOps Production system have tools to both detect and address concept drift as it is encountered over time.
Drift detection
As consumer price data is not known to shift suddenly, performance-based drift detection was chosen (Spackman et al. 2023). As the name suggests, performance-based drift detection evaluates the performance of the predictive model to determine if drift has occurred. This approach is appropriate if there is a high proportion of validation to correct possible misclassification after the model, as is the case for our implementation. In our production systems, the performance of the predictive model is not known at the time of classification. To calculate the performance, some subset of the predicted instances must be flagged for quality assurance (QA). Once there is a set of quality assured data, the model predictions can be compared to the true classes to calculate evaluation metrics to measure the performance. For this evaluation to be trusted, the subset of predicted instances chosen for QA must be selected in an unbiased way. One such method to select an unbiased sample is to randomly select a specific proportion of instances from each run of the predictive model. Figure 8 below shows a demonstration of our Model Performance Monitoring Dashboard, which showcases various F1, precision and recall values for distinct runs of the predictive model, which can be used to determine whether drift has occurred.
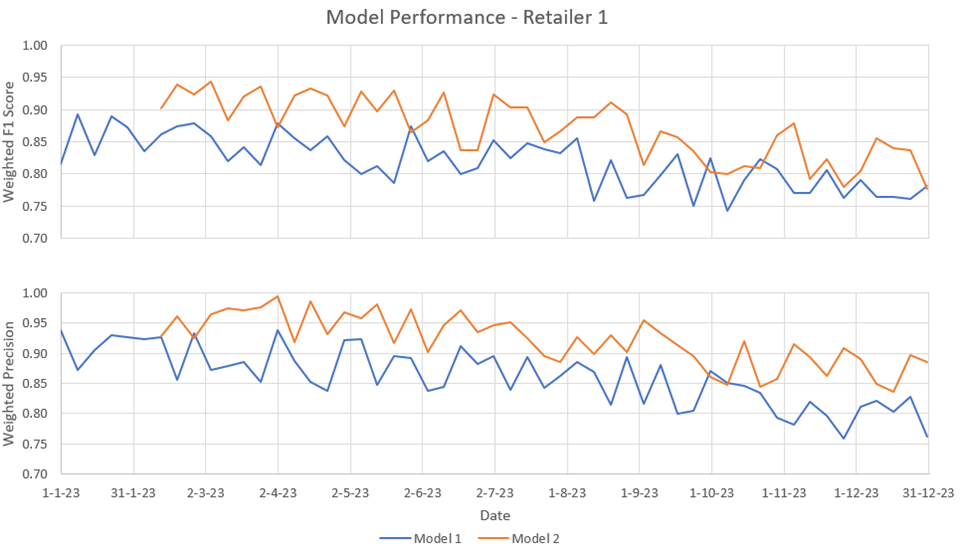
Description - Figure 8: Model performance dashboard that shows the performance of the model over time
Performance of models is tracked over time. When two models are deployed in production, using a main model and shadow models, performance can be compared.
Model retraining
As a result of performance monitoring over time, data drift was noticed in production models; thus, a process is required for mitigating the impact in the MLOps system. One option for counteracting concept drift is to periodically refit the production model(s) using new data. In earlier stages of MLOps maturity, this is a cumbersome and time-consuming process, thus operationalizing the model retraining process represents a key component of MLOps maturity.
Figure 9 demonstrates the flow of new products through the MLOps system. As new products are ingested into the production system, they are automatically classified. As mentioned previously, a fraction of the products is selected to have their classes manually verified and corrected, by a trained annotator. Based on a manual review process, performance metrics for the classifier can be estimated. The products that have been manually verified, additionally serve as new training data, that can be used to retrain the classifier, which is then deployed to production.
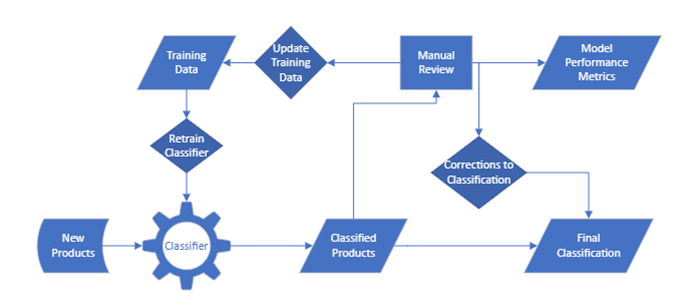
Description - Figure 9: Classification, Review, and retraining process
As new products are classified – a proportion is randomly selected for retraining. Model performance is tracked on this random set, and retraining data is also created from this set of data. Corrections are also utilized for the final set that can be combined with other flagging methods to make sure that well classified products are used for price statistics.
This review and refitting process remains consistent between MLOps maturity levels, with the difference being the automation the retraining pipeline. At the final maturity level, the training data update, model refitting and model deployment are fully automated; triggered either by the completion of the manual review step or on a fixed schedule.
Data validation and expectation checks
Changes in data quality are a significant problem to model performance and quality outputs in production. In fact, data has become the most important part of a data science project (data-centric age) as model architectures and models are readily available. Hence it is necessary to establish a good data quality framework and methods. In the context of ML, it is important to align the quality checks with the expectation of the Data Scientist who builds the models. A separate data validation pipeline was introduced just for this task, which performs checks with the open-source framework Great Expectations (GE) (Great Expectations GitHub).
GE has a high degree of flexibility and scalability in the type of checks that can be applied, as well as outputting the expectation in a way as to enable easy version control. GE also produces automatic and easily readable data quality reports for domain experts and Data Scientists that are accessed directly in the Azure ML User Interface. As well, GE provides an extension library of off-the-shelf data validation expectation checks for rapid deployment and reusability across varying datasets and provides multiple options for connecting to varying data sources (CSVs on data lakes or file servers, databases, etc). On top of this, GE provides the ability to develop custom expectation suites and checks, which allows for the tailoring of designer expectations checks for fringe use cases that would not typically be covered by standard data validation methods.
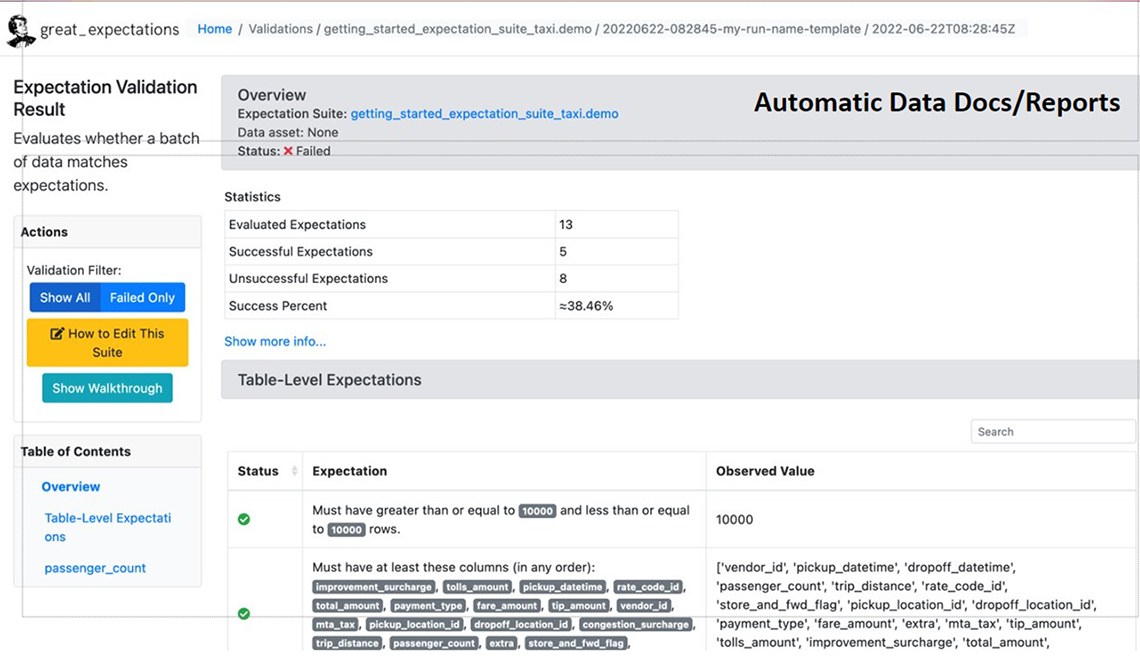
Description - Figure 10: A data validation report from Great Expectations
This shows an application of the output of the python package Great Expectations, after it has validated a specific dataset. The page has a summary of the validation on the top right, a more detailed table of checks that have been performed and the expectations matched to what has actually been seen in this dataset. Finally, the page has a set of actions that can expand various aspects of the page to provide the data scientist greater detail of the checks completed.
Version control
Proper use of version control (Version Control with Git for Analytics Professionals) is a key requirement for an MLOps system. It is an important requirement within the broader adoption of open-source best practices for production development by NSOs (Price and Marques 2023), and for the ML use case includes not only code version control, but also versions of additional parts in the ML lifecycle, including data version control, experiment version control, and model version control. For robust provenance and lineage, the tracking of versions of different parts of the process is needed. For example, given a model in production, one would want to know the data the model was trained on, the training code used, etc.
- Code Version Control: The MLOps system uses code quality control and CI/CD best practices. Particularly the usage of GitOps, which defines the Git repository as the source of truth and the state of the system being adopted. Pipelines and deployments are similarly defined as code.
- Data Version Control: Data version control allows the traceability of produced ML model back to the version of the data on which it was trained. In a production data process with frequent arrival of new data, it is also essential to keep track of the version of the data. Azure ML datasets are used for both needs.
- Model Version Control: Model version control can be facilitated through a central model store, which stores the model artifacts and performs the model metadata management. The most prominent opensource tool for model management is MLflow. Azure ML model store is used as it allows interaction with MLflow.
- Package Dependency Version Control: Package dependency version is done through virtual environments and docker images in which the dependencies are encapsulated. Azure Container Registry and Azure ML environments are used to handle the dependencies for data pipelines and ML models.
- Pipeline Version Control: With daily execution of many pipelines, version control of new published pipelines is essential. Azure ML pipeline versioning is used to publish pipelines and manage them under pipeline endpoints.
- Deployment Versioning: The version of the deployment is managed through dependencies on the model version.
Figure 11 (below) summarizes how these various components are combined together to form a lineage graph for deployed models.
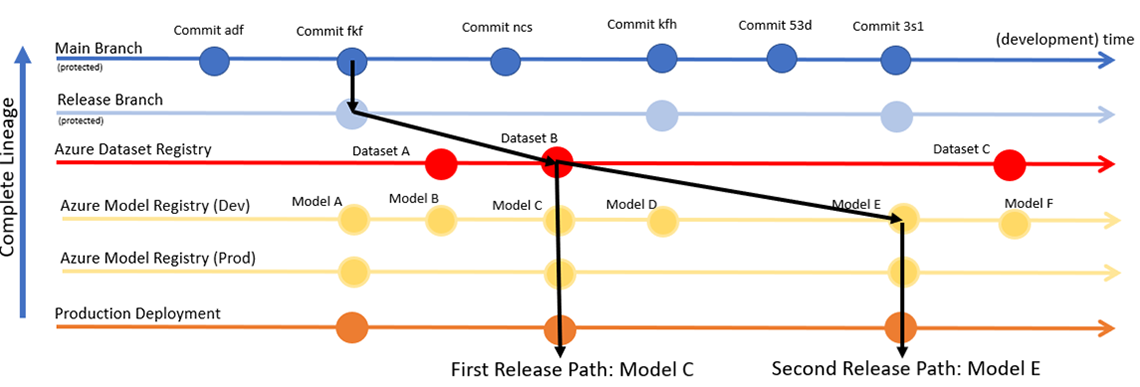
Description - Figure 11: Lineage graph for deployed models.
The diagram summarizes how lineage of models can be managed. Firstly, from the main branch, a new release is planned, and a release branch is created. From there, a new dataset is registered on which models will be trained. With this dataset, multiple models can be trained in development. The final model can be deployed to production and used on new data. If experiments are done to improve the model on the same data, this newer model can similarly be deployed, even if the data on which it was trained or the code in the main branch was never changed.
Conclusion
This article summarized how MLOps can provide tremendous value to a critical statistical program at Statistics Canada, building maturity and robustness for a production process in a way that is aligned with Statistics Canada's Responsible Machine Learning framework (Responsible use of machine learning at Statistics Canada). The agency will continue to evaluate how MLOps can be applied to other use cases as well as continue to make investments to expand developed capabilities. For instance, the following capabilities are being explored: explainable AI dashboards as part of the model choice step in the model creation workflow, more robust data drift detection, more explicit shadow model deployment to support model evaluation (or just always run a backup model in production if required), as well as enhanced cost tracking to further optimize operational use.
Bibliography
João, Gama, Žliobaitė Indrė, Albert Bifet, Mykola Pechenizkiy, and Abdelhamid Bouchachia. 2014. "A survey on concept drift adaptation." ACM computing surveys (CSUR) 46, no. 4 1-37.
Price, Matthew, and Diogo Marques. 2023. "Developing reproducible analytical pipelines for the transformation of consumer price statistics: rail fares, UK." Meeting of the Group of Experts on Consumer Price Indices. Geneva: UN.
Sculley, David, Gary Holt, Daniel Golovin, Eugene Davydov, Todd Phillips, Dietmar Ebner, Vinay Chaudhary, Michael Young, Jean-Francois Crespo, and Dan Dennison. 2015. "Hidden technical debt in machine learning systems." Advances in neural information processing systems (28).
Spackman, William, Greg DeVilliers, Christian Ritter, and Serge Goussev. 2023. "Identifying and mitigating misclassification: A case study of the Machine Learning lifecycle in price indices with web-scraped clothing data." Meeting of the Group of Experts on Consumer Price Indices. Geneva: UN.
Spackman, William, Serge Goussev, Mackenzie Wall, Greg DeVilliers, and David Chiumera. 2024. "Machine Learning is (not!) all you need: Impact of classification-induced error on price indices using scanner data." 18th Meeting of the Ottawa Group. Ottawa: UNECE.
UN Task Team on Scanner Data. 2023. "Classifying alternative data for consumer price statistics: Methods and best practices." Meeting of the Group of Experts on Consumer Price Indices. Geneva.