If necessary, please make address label corrections in the boxes below.
Legal name
Business name
Title of contact
First name of contact
Last name of contact
Address (number and street)
City
Province/territory or state
Country
Postal code/zip code
Language preference
English
French
This information is collected under the authority of the Statistics Act, Revised Statutes of Canada, 1985, Chapter S-19.
Completion of this questionnaire is a legal requirement under this act.
Survey purpose
To obtain information on the supply of and demand for energy in Canada. This information serves as an important indicator of Canadian economic performance, is used by all levels of government in establishing informed policies in the energy area and, in the case of public utilities, is used by governmental agencies to fulfil their regulatory responsibilities. The private sector likewise uses this information in the corporate decision-making process. Your information may also be used by Statistics Canada for other statistical and research purposes.
Confidentiality
Statistics Canada is prohibited by law from releasing any information it collects which could identify any person, business, or organization, unless consent has been given by the respondent or as permitted by the Statistics Act. Statistics Canada will use the information from this survey for statistical and research purposes.
Security of emails and faxes
Statistics Canada advises you that there could be a risk of disclosure during facsimile or e-mail. However, upon receipt, Statistics Canada will provide the guaranteed level of protection afforded to all information collected under the authority of the Statistics Act.
Data-sharing agreements
To reduce respondent burden, Statistics Canada has entered into data sharing agreements with provincial and territorial statistical agencies and other government organizations, which have agreed to keep the data confidential and use them only for statistical purposes.
Reporting instructions
Please refer to the reporting instruction before completing this report.
Reporting Period
Month
Year
Does this establishment ship or receive products by pipeline, tanker or barge?
Yes
No
Operations (Cubic Metres)
Instructions:
For product definitions and detailed survey instructions please consult the provided references.
All values should be reported in cubic metres. All values should be positive except for Column H (Losses and Adjustments During Month), which can be negative.
Each bolded product line should be balanced. When products are balanced, Stocks Beginning of Month + Receipts + Production = Inputs + Shipments + Fuel Uses + Losses and Adjustments + Stocks End of Month. A warning will appear if the values are not balanced.
The Losses and Adjustments column for each bolded product line should be under 5% of (Stocks Beginning of Month + Receipts + Production). A warning will appear if the value is too high.
Total Inputs and Production (Line 79) should be within 5%
2022 Monthly Refined Petroleum Products
Item Description
Stocks Beginning of Month
Receipts During Month
Inputs During Month
Production During Month
Shipments During Month
Fuel Uses During Month
Losses and Adjustments During Month
Stocks End of Month
Crude oil, Total (including synthetic crude oil)
Conventional crude oil - light
Conventional crude oil - heavy
Crude bitumen
Lease condensate
Synthetic crude oil
Hydrogen
Other hydrocarbons
Renewable fuels, Total
Fuel Ethanol (denatured)
Biodiesel Fuel (FAME)
Renewable Diesel Fuel (HDRD/HVO)
Other renewable fuels
Oxygenates (excluding fuel ethanol), Total
Ethyl tertiary butyl ether (ETBE)
Other oxygenates
Hydrocarbon gas liquids, Total
Ethane and ethylene, Total
Ethane
Ethylene
Propane and propylene, Total
Propane
Propylene
Normal butane and butylene, Total
Normal butane
Butylene
Isobutane and isobutylene, Total
Isobutane
Isobutylene
Pentanes plus
Unfinished oils, Total (excluding synthetic crude oil)
This module provides a concise summary of selected Canadian economic events, as well as international and financial market developments by calendar month. It is intended to provide contextual information only to support users of the economic data published by Statistics Canada. In identifying major events or developments, Statistics Canada is not suggesting that these have a material impact on the published economic data in a particular reference month.
All information presented here is obtained from publicly available news and information sources, and does not reflect any protected information provided to Statistics Canada by survey respondents.
COVID-19 timeline
On August 5th, the Government of the Northwest Territories announced it had extended the territory-wide Public Health Emergency until August 17th. On August 23rd, the Public Health Emergency was extended until August 31st. On August 31st, the Public Health Emergency was extended until September 14th.
On August 5th, the Government of Nunavut announced it had extended the territory's public health emergency until August 19th. On August 20th, the public health emergency was extended until September 2nd.
On August 6th, the Government of Nova Scotia announced it was renewing the state of emergency, effective August 8th, until August 22nd. On August 20th, the Government renewed the state of emergency until September 5th.
On August 24th, the Government of Manitoba announced it was extending the state of emergency for a period of 30 days.
On August 25th, the Government of the Yukon announced that the state of emergency declared on March 27, 2020, in response to COVID-19 would end effective midnight.
Selected COVID-19 responses
The Government of Newfoundland and Labrador announced on July 30th that the province would be moving to step two of the reopening plan on August 1st, and that:
Outdoor gatherings may increase to 500 people;
Indoor gatherings may increase to 350 people with physical distancing;
No capacity restrictions at retail stores, restaurants, and lounges;
Indoor and outdoor sports tournaments permitted with COVID-19 protocols; and
Recreational and arts facilities follow the limits for formal gatherings.
The Government of Manitoba announced on August 3rd that it would implement new public health orders on August 7th, one month earlier than forecast, and that the following sectors would be allowed to open without restrictions:
Indoor and outdoor gatherings at private residences;
Gyms and fitness centres;
Libraries;
Personal services such as hair and nail salons;
Day camps; and
Retail businesses, markets, garden centres, and malls.
The Government also said that other sectors would open with limited restrictions including:
Restaurants and bars will no longer need to restrict the size or space between tables and dining will not be restricted to households or vaccinated individuals;
Museums, galleries, and movie theatres will remain limited to 50% capacity but will no longer be restricted to vaccinated individuals;
Casinos and bingo halls, professional sporting events, horse and auto racing, and concert halls may now open to 100% capacity but will continue to be limited to vaccinated individuals;
Indoor and outdoor sports and recreation will fully reopen with limits only on spectator capacity;
Overnight camps will be permitted with limits on camper cohorts; and
Remote working will no longer be required or recommended by public health.
On August 24th, the Government announced that new public health orders will require all designated provincial public service workers who have ongoing contact with vulnerable populations, especially children, to be fully immunized for COVID-19 by October 31st or undergo regular testing.
On August 27th, the Government announced it had developed new requirements for people to be fully immunized to participate in certain events and activities. The Government said these requirements would come into effect by public health order on September 3rd for all health regions and would include:
Indoor and outdoor ticketed sporting events and concerts;
Indoor theatre/dance/symphony events;
Restaurants (indoor and patio dining);
Nightclubs and all other licensed premises;
Casinos, bingo halls, and VLT lounges;
Movie theatres;
Fitness centres, gyms, and indoor sporting and recreational facilities (excluding youth recreational sport); and
Organized indoor group recreational classes and activities, and indoor recreational businesses.
The Government of Nunavut on August 3rd released Nunavut's Path: Living with COVID-19, which outlines the minimum public health measures required to manage existing risk, identifies public health measures according to three separate, community-specific vaccination levels, and identifies how to declare future outbreaks.
On August 17th, the Government announced it had suspended Nunavut's Common Travel Area with the Northwest Territories (N.W.T.) following the increased risk of COVID-19 in the N.W.T.
The Government of Yukon announced on August 3rd that effective August 4th, it would lift some public health restrictions, including:
Self-isolation after domestic travel will no longer be required for vaccinated or unvaccinated people; and
Bars and restaurants will be able to return to full capacity for bar and countertop service.
On August 20th, the Government released Forging Ahead: The Yukon's Continuing Response to COVID-19, which included details about how the Yukon would begin to move forward without widespread public health measures.
The Government of Canada announced on August 13th its intent to require vaccination as early as the end of September across the federal public service and no later than the end of October for employees in the federally regulated air, rail, and marine transportation sectors. The Government said the vaccination requirement will also extend to certain travellers, including all commercial air travellers, passengers on interprovincial trains, and passengers on large marine vessels with overnight accommodations, such as cruise ships.
The Government of Ontario announced on August 17th it was making COVID-19 vaccination policies mandatory in high-risk settings, pausing the province's exit from the Roadmap to Reopen, and providing third doses of the COVID-19 vaccine to vulnerable populations.
The Government of New Brunswick announced on August 19th it had agreed to a mandatory vaccination or testing policy for all provincial government employees and that, once in place, will require all provincial government employees to be fully vaccinated or submit to regular testing until they have received both vaccine doses. The Government said that vaccination will also be a condition of employment for new hires.
The Government of British Columbia announced on August 20th that it was introducing new public health orders covering the entire Interior Health region to manage COVID-19 activity and that effective midnight:
Low-intensity indoor group exercise is permitted to a maximum 10 people per class; high-intensity indoor group exercise is not permitted.
Effective August 23rd:
Gatherings in vacation rentals are limited to five guests;
Indoor personal gatherings are limited to five guests;
Outdoor personal gatherings (e.g. birthday parties, backyard BBQs, block parties) are limited to no more than 50 people; and
Organized indoor gatherings (e.g. weddings, funerals, seated events) are limited to 50 people, and outdoor gatherings are limited to 100 people.
The Government said these measures will remain in place until the end of September.
On August 23rd, the Government announced that proof of vaccination will be required in British Columbia for people attending certain social and recreational settings and events, including indoor ticketed sporting events, indoor and patio dining in restaurants, fitness centres, casinos, and indoor organized events like conferences and weddings. The Government said that as of September 13th, one dose of vaccine will be required for entry to these settings and that by October 24th, entry will require people to be fully vaccinated.
The Government of the United States announced on August 20th it was extending restrictions on non-essential travel at land and ferry crossings with Canada and Mexico through September 21st.
The Government of Nova Scotia announced on August 23rd it was targeting September 15th as the start of the next phase of its reopening plan and that at that time the only restrictions that will remain in place for the general population within Nova Scotia are those related to the management of COVID-19 cases. The Government also said it was leaving border policies in place through the fall, including isolation based on vaccination status and testing, and that effective August 25th, the border policy will also apply to people coming from New Brunswick due to a rise of COVID-19 activity in that province.
The Government of Quebec on August 24th confirmed plans to introduce a vaccine passport beginning September 1st. The Government said use of the passport will be limited to activities deemed non-essential and which take place in places where the risk of transmission between individuals is high, including events and festivals, performance halls and halls where sporting events take place, casinos, cinemas, training halls, team sports, bars, restaurants, and certain extracurricular activities.
Wildfires
On August 3rd, the Government of British Columbia announced it had extended the provincial state of emergency until August 17th to support the ongoing co-ordinated response to the wildfire situation and ensure public safety. On August 17th, the Government extended the state of emergency until August 31st. On August 31st, the Government extended the state of emergency until September 14th.
Resources
Calgary-based Imperial Oil Limited announced it was moving forward with plans to construct a renewable diesel complex at its Strathcona refinery near Edmonton. Imperial said the new complex is expected to produce more than 1 billion litres of renewable diesel from locally sourced and grown feedstocks and that a final investment decision will be based on several factors, including government support and approvals, market conditions, and economic competitiveness.
Brazil-based Vale S.A. announced that a new five-year collective bargaining agreement with United Steelworkers (USW) Local 6500 in Sudbury was ratified, ending the labour disruption that began June 1, 2021. Vale said employees would return to work the week of August 9th, with production ramping up in the weeks ahead.
Australia-based BHP announced it had approved $7.5 billion in capital expenditure for the Jansen Stage 1 potash project in Saskatchewan. BHP said Jansen is expected to produce approximately 4.35 million tonnes of potash per year, with first ore targeted in 2027.
Vancouver-based Conifex Timber Inc. announced it would temporarily curtail lumber production at its Mackenzie, British Columbia, sawmill for two weeks commencing August 23, 2021.
Manufacturing
Massachusetts-based Moderna, Inc. and the Government of Canada announced a Memorandum of Understanding to build a messenger RNA (mRNA) vaccine manufacturing facility in Canada. The parties said the collaboration aims to provide Canadians with access to a domestically manufactured portfolio of mRNA vaccines against respiratory viruses, including COVID-19, seasonal influenza, respiratory syncytial virus (RSV), and potential other vaccines.
Unifor announced on July 31st that Local 112 and 673 members at Bombardier Aviation's Downsview plant in Toronto had voted to ratify new three-year collective agreements, which cover approximately 1,500 Bombardier Aviation workers.
Finance and insurance
Toronto-based Brookfield Asset Management Reinsurance Partners Ltd. and American National Group, Inc. of Texas announced they had entered into a definitive merger agreement whereby Brookfield Reinsurance will acquire American National in an all-cash transaction valued at approximately USD $5.1 billion. The companies said the merger is expected to close in the first half of 2022, subject to certain customary closing conditions, including antitrust clearance and receipt of insurance regulatory approvals.
Toronto-based WPT Industrial Real Estate Investment Trust (WPT) and Blackstone Real Estate Income Trust, Inc. (BREIT) of New York announced that WPT had entered into an arrangement agreement under which BREIT will acquire all of the outstanding units of WPT in an all-cash transaction valued at USD $3.1 billion including the assumption of debt. The companies said the transaction is expected to close in the fourth quarter of 2021, subject to customary conditions, including WPT shareholder approval.
Toronto-based ECN Capital Corp. announced it had entered into a definitive agreement with Truist Bank of North Carolina to sell all of the issued and outstanding equity interests in each of Service Financial Company, LLC and Service Finance Holdings, LLC for cash proceeds of USD $2.0 billion. ECN said the transaction is expected to close in the fourth quarter of 2021, subject to standard licensing and regulatory approvals and the satisfaction of customary closing conditions.
Other news
Yukon's minimum wage increased from $13.85 per hour to $15.20 per hour on August 1st.
New York-based Pfizer Inc. and Trillium Therapeutics Inc. of Mississauga announced that the companies had entered into a definitive agreement under which Pfizer will acquire Trillium for an implied equity value of USD $2.26 billion. The companies said the transaction is subject to court, regulatory, and shareholder approvals as well as certain other closing conditions customary for transactions of this nature.
United States and other international news
The Bank of England's Monetary Policy Committee (MPC) voted to maintain the Bank Rate at 0.1%. The MPC also voted to maintain the stock of sterling non-financial investment-grade corporate bond purchases at £20 billion, and to continue with the existing programme of U.K. government bond purchases, maintaining the target for the stock of these government bonds at £875 billion.
The Reserve Bank of Australia (RBA) maintained the targets for the cash rate and the yield on 3-year Australian Government bonds at 0.10%. The last change in the target for the cash rate was a 15 basis points reduction in November 2020. The RBA also said it would continue to purchase government securities at the rate of AUD $5 billion a week until early September and then AUD $4 billion a week until at least mid-November.
The Reserve Bank of New Zealand (RBNZ) kept the Official Cash Rate (OCR), its main policy rate, unchanged at 0.25%. The last change in the OCR was a 75 basis points reduction in March 2020.
The Monetary Policy and Financial Stability Committee of Norway's Norges Bank decided to keep the policy rate unchanged at 0.0%. The last change in the policy rate was a 25 basis points reduction in May 2020.
On August 28th, United States President Joseph R. Biden, Jr., declared that an emergency exists in the State of Mississippi and ordered Federal assistance to supplement State, Tribal, and local response efforts due to the emergency conditions resulting from Hurricane Ida beginning on August 28, 2021, and continuing.
On August 29th, United States President Joseph R. Biden, Jr., declared that a major disaster exists in the State of Louisiana and ordered Federal aid to supplement State, tribal, and local recovery efforts in the areas affected by Hurricane Ida beginning on August 26, 2021, and continuing.
California-based Square, Inc. and Afterpay Limited of Australia announced they had entered into a Scheme Implementation Deed under which Square has agreed to acquire all of the issued shares in Afterpay for an implied value of approximately USD $29 billion. The companies said the transaction is expected to close in the first quarter of 2022, subject to shareholder and regulatory approvals and other customary conditions.
New York State-based PepsiCo, Inc. announced it had entered into an agreement with PAI Partners (PAI) of France to sell Tropicana, Naked, and other select juice brands across North America for cash proceeds of approximately USD $3.3 billion. Pepsi said the transaction is expected to close late in 2021 or early 2022, subject to customary conditions, including works council consultations and regulatory approvals.
Germany-based adidas AG announced it had entered into a definitive agreement to sell Reebok to Authentic Brands Group (ABG) of New York for a total consideration of up to €2.1 billion. The company said the transaction is expected to occur in the first quarter of 2022, subject to customary closing conditions.
Financial market news
West Texas Intermediate crude oil closed at USD $68.50 per barrel on August 31st, down from a closing value of USD $73.95 at the end of July. Western Canadian Select crude oil traded in the USD $48 to $57 per barrel range throughout August. The Canadian dollar closed at 79.26 cents U.S. on August 31st, down from 80.24 cents U.S. at the end of July. The S&P/TSX composite index closed at 20,582.94 on August 31st, up from 20,287.80 at the end of July.
Retail Commodity Survey: CVs for Total Sales June 2021
This table displays the results of Retail Commodity Survey: CVs for Total Sales (June 2021). The information is grouped by NAPCS-CANADA (appearing as row headers), and Month (appearing as column headers).
NAPCS-CANADA
Month
202103
202104
202105
202106
Total commodities, retail trade commissions and miscellaneous services
0.66
0.63
0.76
0.63
Retail Services (except commissions) [561]
0.66
0.63
0.75
0.62
Food at retail [56111]
0.61
0.65
0.64
0.58
Soft drinks and alcoholic beverages, at retail [56112]
0.56
0.56
0.63
0.63
Cannabis products, at retail [56113]
0.00
0.00
0.00
0.00
Clothing at retail [56121]
1.30
1.75
1.77
1.50
Footwear at retail [56122]
2.01
1.81
2.22
1.82
Jewellery and watches, luggage and briefcases, at retail [56123]
5.10
6.63
8.17
4.69
Home furniture, furnishings, housewares, appliances and electronics, at retail [56131]
0.83
0.81
0.62
0.68
Sporting and leisure products (except publications, audio and video recordings, and game software), at retail [56141]
2.30
3.06
3.51
2.50
Publications at retail [56142]
8.72
7.33
6.41
7.80
Audio and video recordings, and game software, at retail [56143]
5.43
4.17
4.57
4.73
Motor vehicles at retail [56151]
2.18
1.96
2.68
2.25
Recreational vehicles at retail [56152]
5.44
4.42
5.75
2.61
Motor vehicle parts, accessories and supplies, at retail [56153]
1.86
1.92
2.03
1.79
Automotive and household fuels, at retail [56161]
2.19
2.45
1.84
1.60
Home health products at retail [56171]
2.73
2.33
2.73
2.79
Infant care, personal and beauty products, at retail [56172]
2.37
2.18
1.98
1.92
Hardware, tools, renovation and lawn and garden products, at retail [56181]
1.66
1.87
1.94
1.90
Miscellaneous products at retail [56191]
3.21
2.94
3.18
3.21
Total retail trade commissions and miscellaneous services Footnote 1
1.83
1.74
2.08
2.04
Footnotes
Footnote 1
1. Comprises the following North American Product Classification System (NAPCS): 51411, 51412, 53112, 56211, 57111, 58111, 58121, 58122, 58131, 58141, 72332, 833111, 841, 85131 and 851511.
Name of Senior Administrative Officer (if different from above)
Instructions
Please read carefully the accompanying Guidelines.
All amounts should be expressed in thousands of dollars ($'000).
In the "Observations and Comments" section, please explain financial data that may not be comparable with the prior year.
Please do not fill in shaded areas. All non-shaded cells should be completed.
A nil entry should be indicated with a zero.
Please complete and return the Transmittal Letter.
Reserved for Statistics Canada
Full-time equivalent
Report Status
Institution Code: cbeYYIII
Comments
Table 1
Income by fund Table summary
This is an empty data table used by respondents to provide data to Statistics Canada. This table contains no data.
Types of income
Funds
General operating
Special purpose and trust
Sponsored research
Ancillary
Capital
Endowment
Total funds
Entities consolidated
Entities not consolidated
Sub-total
(thousands of dollars)
Government departments and agencies - grants and contracts
Federal
1. Social Sciences and Humanities Research Council
2. Health Canada
3. Natural Sciences and Engineering Research Council
Table 2 Expenditures by fund
Table summary
This is an empty data table used by respondents to provide data to Statistics Canada. This table contains no data.
Table 3
Statement of changes in net assets by fund Table summary
This is an empty data table used by respondents to provide data to Statistics Canada. This table contains no data.
Total interfund transfers and interfund reallocations in column Total funds must net to zero for lines Interfund transfers and Interfund reallocations.
The Total funds in Net asset balances, end of year (Net asset balances are comprised of:) must agree with the Total funds in Net asset balances, end of year (Objects).
Table 4
General operating expenditures by function Table summary
This is an empty data table used by respondents to provide data to Statistics Canada. This table contains no data.
Table 5
Affiliation report Table summary
This is an empty data table used by respondents to provide data to Statistics Canada. This table contains no data.
Code Legal Name of Affiliated Institution
Category of Affiliation
Health Research Institute
Other Research Institute
Affiliated Hospital
Other Affiliated Institution
Associated Hospital
Other Associated Institution
Federated Institution
Basis of Reporting
Amount Included in Annual Return ($'000)
Included
Excluded
For columns 1 to 9, indicate with an "x" in the appropriate column.
Part I: Separate legal entities consolidated
1
2
3
4
5
6
7
8
9
10
For columns 1 to 7, indicate with an "x" in the appropriate column.
Part II: Separate legal entities not consolidated
List each separate legal entity over $100,000
11
12
13
14
15
16
17
18
19. Total of all other legal entities under $100,000
The total for Amount Included in Annual Return must agree with the total amount reported for Sponsored research – Entities not consolidated in Table 1, as well as the total amount reported for Sponsored research – Entities not consolidated in Table 2.
Table 6
Other federal government departments and agencies – Grants and contracts Table summary
This is an empty data table used by respondents to provide data to Statistics Canada. This table contains no data.
Source of grant/contract
Funds
General operating
Special purpose and trust
Sponsored research
Ancillary
Capital
Endowment
Total funds
Entities consolidated
Entities not consolidated
Sub-total
(thousands of dollars)
1. A. Indirect costs of research
B. Separately list each department and agency over $100,000:
2
3
4
5
6
7
8
9
10
11
12
13
14
15
16
17
18
19
20
21
22
23
24
25. C. Total of all departments and agencies under $100,000
The total of each column must agree with the appropriate column for Government departments and agencies - grants and contracts, Other federal in Table 1.
Table 7
Provincial government departments and agencies – Grants and contracts Table summary
This is an empty data table used by respondents to provide data to Statistics Canada. This table contains no data.
Source of grant/contract
Funds
General operating
Special purpose and trust
Sponsored research
Ancillary
Capital
Endowment
Total funds
Entities consolidated
Entities not consolidated
Sub-total
(thousands of dollars)
A. Ministry responsible (total grants and contracts):
1
2. CFI matching funds
B. Other (list each department and agency over $100,000):
3
4
5
6
7
8
9
10
11
12
13
14
15
16
17
18
19
20
21
22
23
24. C. Total of all departments and agencies under $100,000
Quarterly estimates of labour productivity growth and related variables were published for the first time on December 20, 2000 for the aggregate business sector and on December 12, 2003 for its major industrial sectors.Footnote 1
The seasonally adjusted statistical series at the aggregate level (total economy, business sector and non-business sector) begins at the first quarter of 1981, while those at the industry level are available only back to the first quarter of 1997. These quarterly estimates are meant to help those who are focused on analysis of the short-term relationship between real output, employment, hours worked and compensation.
Quarterly estimates of labour productivity and related series are published in index form (using a base year consistent with National Accounts) at the aggregate and industry levels.
Hours worked for all jobs
Hours worked represents the total number of hours that a person devotes to work, whether paid or unpaid. Generally, this includes regular and overtime hours, coffee breaks, on-the-job training, as well as time lost due to momentary interruptions in production when the persons involved remain on the job. However, time lost due to strikes or lockouts, to statutory holidays, vacations, as well as illness, maternity or other personal leave are all excluded from the total number of hours worked.
Quarterly estimates of labour input make the distinction between two main categories of jobs:
Paid workers jobs, which comprise employee jobs as well as jobs held by owners of an incorporated enterprise.
Jobs occupied by self-employed workers which comprise employers of an unincorporated business, unincorporated own-account jobs and unpaid family-related jobs.
The number of hours worked is calculated as the product of the number of jobs times the average hours worked that is collected by the Labour Force Survey (LFS).
The number of jobs in the business sector is obtained residually by subtracting all jobs occupied in non-commercial activities from the number of jobs in the total economy. An estimate of the number of jobs for the overall economy is first produced from LFS estimates for all ten Canadian provincesFootnote 2, to which are added secondary jobs of workers with more than one job. Employees who hold a job but were not at work during the LFS reference week, and have no right to compensation during their absence, are removed from the estimates. Finally, all workers in self-employed jobs who were not at work during the reference week are also excluded.
In the System of National Accounts (SNA), non-commercial activities comprise two main components: the government sector and non-profit institutions servicing households. The number of jobs estimates for the government sector come mainly from the Survey of Employment, Payroll and Hours (SEPH). Estimates for non-profit institutions servicing households mainly encompass social and community services including religious groups, philanthropic foundations, civic, professional and other similar organizations. Employment for non-profit institutions is built from a linkage between the edited PD7Footnote 3 files and SNA's T4 allocation system developed from Business Register information.
Once the number of jobs for the business sector has been derived, the number of hours worked is calculated by multiplying each component of jobs by their respective average hours worked.
At the industry level, all data on average hours worked by industry and by category of worker are taken from LFS. However, the industrial breakdown for the employee jobs are mainly from SEPH. Only data from LFS are used to estimate the employee jobs in agriculture, agricultural services, and fishing and hunting. In the case of the categories of jobs occupied by self-employed workers, the industrial detail is obtained by integrating information from the five-year censuses and the LFS.
Jobs and hours worked estimates by industry are then adjusted to their respective business sector total of jobs and hours worked, obtained residually from the total economy and the non-commercial sector.
Finally, to ensure consistency with the annual data from the labour productivity database, the quarterly indices of labour input are adjusted to their respective annual benchmarks when they become available. A new yearly benchmark becomes available at the business sector level upon the release of the first quarter indices for the business sector, and upon the release of the third quarter indices at the industry level.
Real gross domestic product (GDP) as the measure of output
Quarterly estimates of real value added (or real GDP) used to calculate the productivity in the business sector and its component two-digit industries are built-up using a chained Fisher volume index method.
For the business sector, quarterly estimates of output are derived from chained Fisher volume indexes of GDP at market prices (expenditure-based), sourced from Quarterly Income and Expenditure Accounts. These quarterly estimates of real GDP in the business sector are constructed after removing the value added of the government sector, non-profit institutions, and the rental value of owner-occupied dwellings. Value added related to paid employees of private household employees is also removed. This approach is similar to that used for the quarterly measures of productivity in the United States.
Corresponding exclusions are also made for labour compensation and hours worked, in order to make output and the labour statistics consistent with one another. In 2019, nominal GDP in the business sector accounted for roughly 73.5% of the Canadian economy.
Since October 1st, 2012, the output series reflect the capitalization of research and development activities and military weapons systems introduced by the Canadian System of National Economic Accounts. This change brought Canada in line with the United States, thereby improving the comparability of the quarterly measures of productivity with those published by the U.S. Bureau of Labor Statistics.
At the industry level, quarterly estimates of output are obtained from the estimates of value added at basic prices, published by the Industry Accounts Division. The chained Fisher volume index is used in years for which final supply and use tables are available. For the most current years without these annual benchmarks, real value added is based on a fixed-weight Laspeyres volume index. It should be noted that quarterly estimates of the value added used to calculate the productivity in the service-producing businesses as well as its component — the real estate, rental and leasing sector — exclude the rental value of owner occupied dwellings as there are no data on the number of hours that homeowners spend on dwelling maintenance services. Private households are also excluded from other business services — the industry grouping to which they would normally be associated.
All quarterly estimates by industry are available for two-digit NAICS industries, the goods-producing business sector, and the service-producing business sector.
It should be noted again that the GDP in the business sector is at market prices but the GDP by industry series is at basic pricesFootnote 4. As the valuation of output in the business sector differs from that used at the industry level, these measures are not directly comparable.
Labour productivity: a measure of real GDP per hour worked
Quarterly estimates of productivity for the total economy, business sector and by industry are based on a Fisher-chained volume index of GDP.
The labour productivity measures relate real output (real GDP) to labour input (hours worked). They estimate the change in the output per hour worked from one period to another. In other words, the growth of labour productivity is meant to estimate the efficiency with which the number of hours worked in all jobs involved in one sector is used in production. Economic performance, as measured by labour productivity, must be interpreted carefully, since these estimates reflect changes in other inputs, in particular the capital, in addition to the efficiency growth of production processes.
As a consequence of the use of different index numbers and of the different valuation of output measures — market prices for the aggregate of the business sector and basic pricesof the major industrial sectors— the aggregation framework of productivity accounts for the business sector as a whole is not entirely consistent with those that are detailed by industrial sector.
Total labour compensation and unit labour cost
Labour compensation measures the value of labour services entering in the production process. This compensation consists of all payments in cash or in kind made by domestic producers to workers for services rendered – in other words, total payroll. It includes the compensation of employees consisting of wages and salaries (including bonuses, gratuities, taxable allowances and retroactive wage payments) and supplementary labour income of paid workers (various contributions to employees), plus an imputed labour income for self-employed workers.
As was the case for estimating jobs, the labour compensation estimates in the business sector are obtained residually by subtracting the wages, salaries and supplementary labour income for the non-business sector from labour compensation for the total economy.
The data on income for all paid jobs in the total economy and at the industry level are taken directly from the estimates of compensation of employees in the quarterly income and expenditure accounts. Compensation of employees for self-employed workers is established by imputation. This imputation is based on relative distance modelling (as observed in 5-year censuses) between compensation rates for self-employed workers and paid employees, and varies from one industry to another.
No compensation of employees is imputed to unpaid family workers since by definition, they get no compensation for their work.
In all sectors, labour compensation is comprised not only of wages and salaries, but also of employer's contributions to indirect benefits (such as the pension and insurances plans). These initial estimates are also obtained from the quarterly income and expenditure accounts, but for productivity measures, an additional industry distribution is carried out.
Compensation per hour worked (or hourly compensation) is the ratio of the total compensation for all jobs to the number of hours worked.
Unit labour cost is the labour cost per unit of output. It is calculated as labour compensation divided by real value added. It is also equal to the ratio of labour compensation per hour worked (hourly compensation) and labour productivity. In other words, it is the joint result of changes in hourly compensation and productivity: unit labour cost increases when labour compensation per hour worked increases more rapidly than labour productivity. It is widely used to measure inflation pressures arising from wage growth.
The unit labour cost in U.S. dollars is equivalent to the ratio of the Canadian unit labour cost to the exchange rate. The latter corresponds to the U.S. dollar value, expressed in Canadian dollars. The exchange rate used is the monthly average exchange rate in Canadian dollars, published by the Bank of Canada.
Relative unit cost is an often-used concept for determining Canadian businesses' competitiveness compared to a foreign competitor. The relative unit cost is defined as the difference between the rate of growth of Canada's unit labour cost and that of a foreign country, with these costs expressed in a common currency for purposes of comparison.
Statistical adjustments
Seasonal Adjustment
Economic time series observed monthly or quarterly often show seasonal patterns that repeat every year during the same month or quarter. Seasonal patterns are changes that occur regularly during a given period of time. They relate to the seasons, sociological patterns and the pace of human activity.
All necessary basic variables for productivity analyses (such as hours worked, jobs, output and compensation) are seasonally adjusted using Statistics Canada's X-12-ARIMA program. Seasonal adjustment consists in removing the combined seasonal and calendar effects from the series, and it therefore helps to highlight the most relevant fluctuations (from an economic point of view). A series that is affected by seasonal fluctuations presents little interest or benefit for economic interpretation since these fluctuations substantially mask cyclical trends.
Seasonal adjustment is generally made by two main categories of workers (paid workers and unincorporated self-employed workers) at the industry level, and the seasonally-adjusted aggregates of jobs and hours worked are obtained by summation. In the hours worked series for the total economy, the class of paid workers is split between employees and incorporated self-employed, which facilitates the reconciliation with the data published by LFS.
Regression models to adjust for reference week effects and holiday effects on hours worked
The definition of the LFS reference week (usually the week with the 15th day of the month) implies that the actual dates of the week vary from year to year. This variability may impact the month-to-month change in hours worked estimates. In addition, hours worked are affected by variability in the dates of the reference week, combined with the presence of fixed (Thanksgiving, Remembrance Day) or moving (Easter Friday and Easter Monday) holidays. Specifically, in some years, holidays may occur during the reference week, reducing work hours during that week. This variability could introduce significant fluctuations in estimates of hours worked, and it is therefore removed from the series prior to seasonal adjustment.
In order to remove reference week effects and holiday effects, hours worked series are the subject of prior adjustments. These corrections remove the effects attributable to the situations where the 15th of the month falls relatively early or late for reference week and the situations where some holidays fall outside the reference week.
These effects are estimated by the seasonal adjustment method X-12-ARIMA using appropriate regression specifications with ARIMA residuals.
Benchmark adjustment
As a result of using different data sources and methodologies, the annual values (jobs, hours worked, GDP, compensation) and the yearly totals of the independently produced quarterly estimates are not identical. For instance, some components of labour statistics are processed only on an annual basis such as the employment in the three Canadian territories, the employment on Indian reserves, the international flows of workers, etc. However, this difference between the two sets of estimates is eliminated by integrating the annual benchmark values into the quarterly estimates. This integration process, called benchmarking, generates a series which moves as much as possible with the original quarterly series and sums to the annual benchmarks. In other words, this procedure restores coherence between time series data of the same target variable measured at different frequencies (e.g. quarterly and annually).Starting in June 2011, Statistics Canada's in-house SAS Proc Benchmarking program has been used for this purpose. This procedure is available in G-Series production versions v1.04 and v2.0.Footnote 5
Raking procedure used in seasonal adjustment
Seasonally adjusted estimates of overall jobs and hours worked for the business sector are derived by subtracting adjusted estimates for the non-business sector from those of the total economy. The resulting overall estimate is used as a quarterly benchmark for other seasonally adjusted series by industry. For example, hours worked estimates by industry are adjusted independently and then adjusted so that their total sums to the overall quarterly benchmark, while maintaining consistency with the annual detail. This procedure is known as raking. Starting in June 2011, Statistics Canada's in-house SAS Proc TSRaking program has been used for this purpose. This procedure is available in G-Series production versions v1.04 and v2.0.
Revisions to the quarterly series
Statistical revisions are carried out to incorporate the most recent information from quarterly and annual surveys, taxation statistics, public accounts, censuses, etc., as well as from the annual benchmarking process to the supply and use tables.
Quarterly labour productivity estimates and related measures are released four times per year. As shown above, the estimates are produced from various data sources, and they are often revised as a result of the updates to benchmark data, methodologies, and seasonal adjustment.
Data are released within 63-67 days after the reference period. Estimates for each quarter are revised when those for subsequent quarters of the same year are published. At the time of the third quarter of each year, revisions are generally undertaken back three years in conjunction with the National Economic Accounts Quarterly GDP revision process. Benchmarked estimates are not normally revised again except when periodic comprehensive revisions are carried out to incorporate the latest international concepts, classifications, and estimation methods.
Privacy Preserving Technologies Part Two: Introduction to Homomorphic Encryption
By Zachary Zanussi, Statistics Canada
Have you ever wished that there was a way to access data to perform analytics while preserving the privacy of the data itself? Homomorphic encryption is an emerging privacy preserving technique with potential applications that will allow for greater access while keeping data encrypted and secure.
The first article in the series, Brief Survey of Privacy Preserving Technologies introduced privacy preserving techniques (PPTs) and how they are poised to enable analytics while protecting the privacy of the data. This article will build on that topic by taking a deeper look at one of these techniques, homomorphic encryption (HE), including what it is, how it works and what it can do for you.
This article begins with an overview of HE and introduces some common use cases. It gives an honest evaluation of HE's advantages and disadvantages. Then it will cover some of the more technical details to prepare you to dig into these techniques yourself! By the end of this article, hopefully you will be inspired to continue your learning by picking an HE library and making your own encrypted circuits.
Homomorphic encryption is currently being considered by international groups for standardization. The Government of Canada does not recommend that HE, or any cryptographic technique, be used in practice before standardization by experts. While HE is not yet ready for use on sensitive data, this is a great time to explore its functionality and potential use cases. Expect a future article on the standardization activities related to HE including expected timelines and schemes.
What is homomorphic encryption?
A traditional encryption scheme maps human-readable plaintexts into masked ciphertexts to protect data from prying eyes. Once masked, these ciphertexts are immutable; changing even a single bit in the ciphertext may return an unrecognizable plaintext message upon decryption. This makes traditional encryption quite static. By contrast, a homomorphic encryption scheme is dynamic; given two ciphertexts, you can perform operations on the underlying plaintexts. For example, a homomorphic 'add' operation will return a ciphertext that, upon decryption, returns the sum of the two original plaintext messages. This allows you to delegate computing to another party so that they can manipulate it without accessing the data.
A typical cloud computing protocol involves a client sending its data to the cloud. Since internet connections are inherently insecure, this transfer is facilitated by a form of transport security protocol that involves encryption, such as HTTPS. Upon receipt, the cloud decrypts and begins computation. However, what if you want to keep the data secret from the cloud? If you encrypted with a homomorphic scheme, not only would the data be protected during transport, but it would also be protected during the entire computation process. Upon completion, the cloud would forward the encrypted results back to the client, who could decrypt and view the results at their leisure.
The term "homomorphic" comes from Greek, roughly translating to "similar form." In mathematics, a homomorphism is a map from one mathematical structure to another that preserves the operations of the first structure. To construct a homomorphic encryption scheme, you need an encryption map that scrambles the data enough that no one can figure out what they are, while simultaneously preserving the structure of the data so that operations on ciphertexts result in predictable results in the plaintexts. These paradoxical goals underscore the difficulty in constructing such a scheme.
Figure 1: An illustration of the benefits of HE. On the left is ordinary encryption; to apply the desired analytics, the data need to first be decrypted using the private key. To make the results safe for transport, it must be re-encrypted. In addition, the data are vulnerable for the duration of the computation. On the right is HE; the computing party doesn't require any sensitive information to perform the calculation and the data and results are protected by encryption.
Description - Figure 1
An illustration of the difference between computations with ordinary and homomorphic encryption. In the case of ordinary encryption, the data, a box of lines with a padlock on it, must first be decrypted using some key, resulting in the same box with an unlocked padlock. If the results must be communicated to another party, they must then be encrypted again using another key. In the case of homomorphic encryption, the computation can be performed directly, without any secret information like keys.
What can you do with homomorphic encryption?
There are a number of different computing paradigms that can be enhanced with HE, including delegated computing, data sharing and data release. These different paradigms all revolve around the fact that the data holder, analyst and computing platforms are often different parties entirely and the aim is to reduce or remove the privacy concerns that arise when one of these parties shouldn't have access to the data. It is important to note that HE uses a weaker security model than traditional cryptography and that care will need to be taken to ensure that it is used securely in practice.Footnote 1
Possibly the simplest application involves a data holder delegating their computing to another party, such as the cloud. In this scenario, a client encrypts their data and sends them along with some instructions to the cloud. The cloud can carry out those instructions homomorphically and return the encrypted results, learning nothing about the input, output or intermediate values. These instructions are modeled as circuits, which are sequences of arithmetic operations applied to some input. It should be noted that creating correct and efficient circuits with HE is not always straightforward, but theoretically there is no limit to the computations that can be run. For example, Statistics Canada has completed proof-of-conceptsFootnote 2 applying statistical analysis and neural network training on encrypted data.
As an extension of the delegated computing scenario, consider a case where there are multiple data holders. These data sources want to share their data, but are prevented due to privacy issues. The exact outline depends on the trust model; however, HE may allow these different parties to each encrypt their data and share them with a central authority who has the power to compute homomorphically. These data sharing applications can allow for better analytics in scenarios where data are limited and sheltered. An example is an oncologist who wants to test their hypotheses; patient data are typically restricted to the treating hospitals and combining these sets not only increases the strength of the model, but removes geographic data biases. Therefore, allowing multiple hospitals to share their encrypted data and allowing the oncologist to compute on this joint encrypted dataset allows for better healthcare research and outcomes.
Consider also scenarios with a central data holder and several parties who want to perform analysis on these data. An example of this is Statistics Canada's Research Data Centres, which are hosted across Canada in secure facilities managed by the organization. Accredited researchers can gain special approval to access microdata within these secure sites. While secure, the approval process takes time and the researchers must be able to physically access these sites. With HE, the data centres may be able to host the data encrypted and give access to any party who requests it. This would cut down the administrative costs of adding a new researcher and would broaden access to data in line with Canada's Open Data Initiative.
Figure 2: Illustrations of the three paradigms. First is delegated computing; the data holder encrypts and sends their data to the cloud, who returns the encrypted results after performing homomorphic calculations. Second, multiple parties encrypt and send their share of a distributed dataset which the cloud can use to perform analytics without compromising the privacy of each data holder. Third, a central data holder can give analysts access to an encrypted dataset. The analysts can be subjected to less scrutiny and restrictions because they never have direct access to the data.
Description - Figure 2
An illustration of the three paradigms. In the "delegated computing" paradigm, the data holder sends their encrypted data to the cloud, who sends the encrypted results back. In the "multiple data holder" paradigm, multiple data holders can each send their encrypted data, allowing the cloud server to perform a joint computation on the union of their datasets, resulting in a stronger analytical result. In the "data bank" paradigm, the cloud holds the data and can send encryptions of it to any analyst they choose, without fear of the data being misused.
HE can help with more than numerical calculations. For example, Private Set Intersection (PSI) allows a client in possession of a sensitive dataset to learn its intersection with a server's dataset without the server learning the client's dataset and without the client learning anything about the server's data beyond the intersection. Private String Matching is a similar protocol that allows the client to query a textual database for a matching substring. Using these and other cryptographic primitives, you can envision a broad privacy-preserving suite linking data dispersed across different government departments and public institutions. While such a system is ambitious and the exact implementations are not yet clear, it gives a taste of the types of systems that you can aspire to as more complicated tasks are completed using HE and other PPTs.
Downsides of homomorphic encryption
While there are many benefits to the use of HE, as with any technology, there are potential downsides. The price of cryptographic security is the computational cost; depending on the analysis, encrypted computation can be several orders of magnitude more expensive than unencrypted. There is also a data expansion cost that can be quite significant. This data expansion cost is exacerbated by the fact that most HE protocols involve transferring encrypted data; while cloud storage is relatively inexpensive, data transfer can be costly and complicated.
There are also a restricted set of computations allowed natively by HE. Only addition, subtraction and multiplication are native to most arithmetic schemes and all other computations (such as exponentials, activation functions, etc.) must be approximated by a polynomial. One should note that this is true in general with all computers, but while a modern computer hides this fact from the user, HE libraries currently require the user to specify how to compute these non-trivial functions.Footnote 3 In some schemes, one also has to be wary of the depth of computations attempted. Indeed, these schemes introduce noise into the encrypted data to protect it. This noise is compounded through successive computations and, unless reduced,Footnote 4 would eventually overtake the signal, at which point decryption will no longer return the expected output. One's choice of encryption parameters is important here. Given a circuit, there exists a parameter set large enough to accommodate it, but dealing with larger parameters increases the computational cost of the protocol.
Can the extra costs in terms of computation and circuit creation be justified? Well, HE allows for computations that might not be possible otherwise. This is true with particularly sensitive datasets, such as health data. There is a huge cost inherent in obtaining permissions for an analyst to work on such data, as well as additional complications such as controlled computing environments. And once the data are shared, how do you verify that the analysts are following the rules? Some data holders may be reluctant to allow anyone access to their data at all; without some additional measures such as HE, this analysis might be impossible. The choice between "expensive computation" and "no computation" is much easier to make.
Moreover, the various schemes and their implementations are an active area of research and the library implementations regularly release improvements to their data compression and homomorphic computation algorithms. There has also been a significant amount of investment in hardware acceleration for HE recently. This is similar to the hardware that is installed on most computers, which contains specific electronic circuits designed to perform encryption and decryption operations as fast as possible. This could allow HE-accelerated cloud computers to perform analysis on encrypted data at speeds closer to that of unencrypted data.
In spite of the downsides, there are reasons to believe that HE will become an important tool for preserving privacy. That makes the present a fantastic time to begin to examine what can be done with these techniques.
The mathematics of homomorphic encryption
Now this article will delve into the inner mathematical workings of HE, including cryptographic details; hopefully even non-mathematical readers will be able to grasp the basics of how these schemes work. It should be noted that the rest of this section provides details pertaining to the scheme of Cheon, Kim, Kim and Song, which they named Homomorphic Encryption for Arithmetic of Approximate Numbers but the cryptographic community usually refers to as CKKS. That said, most of what is mentioned here applies to the other schemes with only slight modifications.
At the heart of every public key cryptosystem is a mathematical problem that is believed to be hard to solve unless you have access to a special piece of information called a secret (or private) key. A related public key can be used to encrypt plaintext data producing a ciphertext, but only knowledge of the secret key enables one to recover the original plaintext from this ciphertext. Since the public key cannot be used to decrypt, the public key can be shared with anyone wishing to encrypt data with confidence that only the secret key holder can decrypt the ciphertext to access the plaintext.
Most HE schemes use some variant of the Learning With Errors hardness assumption. This describes the ring variant, called Ring-Learning With Errors (RLWE). Rather than integers, it deals with polynomials with integer coefficients. More precisely, you want the space of polynomials with integer coefficients modulo of degree less than ; this is denoted by . You can think of this space simply as lists of integers, each less than . Typically, you would take these values to be quite large; for example and . This makes large enough to hide secrets in! Figure 3 gives a toy example of the type of space we would work with.
Figure 3: A toy example of a ring of the type that might be used for HE, as well as a few of its elements. Note that the sum or product of these elements is another element in the ring.
Description - Figure 3
An example of a ring that may be of interest when working with homomorphic encryption.
Here, the value of is 17 and the value of is 16. Also listed are some sample polynomials in the ring; one example is the polynomial .
Given two polynomials, you can add them or multiply them. The result of these operations is always another polynomial.Footnote 5 This makes a kind of a sandbox that you can move around freely within. Mathematicians call a set with this property a ring and the way that these operations affect the elements of the ring is what is meant by structure. The special property of homomorphic encryption is that there exist operations in the ciphertext space that correspond homomorphically to the operations on the underlying plaintext space. The use of polynomial rings is preferred because the operations are efficient and the RLWE problem is believed to be difficult.
How does one hide a secret in a mathematical space? Suppose you have four random polynomialsFootnote 6 in , called , and . The RLWE hardness assumption states that it is very hard to distinguish a series of pairs that are either of the form or of the form Here, "very hard to distinguish" means "parameters can be set such that all the best computers in the world working together using the best known algorithms would still not be able to solve the problem. The polynomials and can be sampled uniformly at random from all of , but the others have a special form. In CKKS, we take to have coefficients of or , and sample the coefficients of from a discrete Gaussian distribution over centred around . For the rest of this post, we will just refer to these polynomials as "small", because in both cases their coefficients are close to .
The hardness of the RLWE problem allows you to keep a secret in the following way: notice that the first pair is correlated; there is a factor of in both polynomials, while in the second there is no correlation between the randomly selected and . Now imagine someone handed you many pairs that are either all of the form for many different values of and constant , or all just completely random pairs. According to the hardness of RLWE, not only could you not reliably find when given the pairs, you couldn't even reliably determine which of type ofthe pairs you were given! Figure 4 gives a toy example of this problem for you to try at home.
Figure 4: Four pairs of polynomials in broken into two groups. One group is distributed as form for some fixed "small" and two different random "small" and the other two are of group is of the form . Can you tell which is which? What if is changed to and to ? Now imagine trying to figure out what is. Note that in the RLWE assumption, you would be given just one of these groups, not both.
Description - Figure 4
Four pairs of polynomials. This is supposed to be a toy example of the RLWE problem for you to try at home. The polynomial pairs are separated into two groups. One group is distributed as for a fixed "small" polynomial , and the other is of the form for random and . Can you tell which is which? The point of this figure is to illustrate just how hard the RLWE hardness assumption is. The polynomials in the figure are repeated below:
The security of schemes based on RLWE follows from the fact that given , and it is easy to compute , but it is practically impossible to find given and . You can construct a public key encryption system as follows:
Fix your space by picking a coefficient modulus and a polynomial modulus degree .
Pick a random "small" secret key , a uniformly random , and a random "small" to construct your public key . Note the negative in this pair; this makes the encryption process more straightforward but does not affect the security of RLWE.
Share your public key with the world and no one will be able to find your secret key! Hence, anyone in possession of this public key can encrypt the data and send them to some party to perform computations on it, homomorphically. In the end, the results also can only be decrypted and viewed using the secret key.
To encrypt the data, the data must first be encoded as a vector of real numbers. This is straightforward when you are working with numerical data and is a standard practice when working with textual or other types of data. To encrypt, the data vector is first encoded as a polynomialFootnote 7 in combined with by the public key to get a ciphertext, which will be denoted by . Now, send this off to the computing party who will perform homomorphic additions and multiplications to implement the calculation that is of interest. Figure 5 outlines a simple circuit computing a polynomial function. Once the computations are completed and output ciphertexts are returned, you can use your secret key to decrypt and view the results.
Figure 5: A visualization of a homomorphic circuit. A vector of values can be encrypted into a single ciphertext and computed on at once. Pictured is just one realization of a circuit to compute the polynomial . Values with padlocks are encrypted and are thus unreadable to the computing party.
Description - Figure 5
A homomorphic circuit that evaluates the function on a vector of values. Padlocks represent values that are encrypted and are thus unreadable to the computing party. Arrows and operations represent how one could actually encode the circuit in a homomorphic encryption library.
While this article did not explore all of the details of how these operations are implemented mathematically, the description of HE given so far provides the background needed to further learn about HE.
While all of the different HE schemes will implement most use cases, some schemes will perform better on some problems. The CKKS scheme is designed to work on real numbers; if you are interested in statistics or machine learning, you should probably start here! Brakerski/Fan-Vercauteren and Brakerski-Gentry-Vaikuntanathan are great for integer arithmetic and implementing the computer science primitives such as private set intersection or string matching. TFHE implements logical gates natively and refreshes the ciphertext noise with every operation, allowing improved efficiency with longer circuit depths. Readers who are interested are encouraged to try some simple circuits using each scheme and compare the results and performance!
If you would like more information on the cyber security aspects of homomorphic encryption, including standardization activities, contact the Canadian Centre for Cyber Security at contact@cyber.gc.ca, (613) 949-7048 or 1-833-CYBER-88.
Conclusion
This article took an in-depth look at homomorphic encryption, from its applications to the RLWE problem. Next, this series on privacy preserving techniques will look at some proofs-of-concept that have been completed by applying HE at Statistics Canada! It will also cover some of the more advanced aspects of the CKKS interface, including rotations, choice of parameters, packing, bootstrapping, scale and levels.
Want to keep in the loop about these emerging technologies, or want to share your work in the field of privacy? Check out the Privacy Preserving Technologies Community of Practice page (Government of Canada employees only) to discuss this series of privacy articles, connect with peers interested in privacy and share resources and ideas with the community. You can also give feedback on this topic or leave suggestions for future articles in this series.
Note: We wish to acknowledge the input provided on this article by the Canadian Centre for Cyber Security and the Tutte Institute for Mathematics and Computing, both part of Communications Security Establishment.
On March 11, 2020, the World Health Organization declared the COVID-19 pandemic. To address the consequences of the pandemic on the Canadian economy, the federal government of Canada announced and implemented various support and recovery measures for businesses, households, students, the vulnerable population and organizations helping individuals. The table Federal government expenditures on COVID-19 response measures presents the major federal measures announced and implemented, their treatment in the national accounts (in particular, in the Income and Expenditure Accounts), the table numbers where the pertinent series may be found and the amount of expenditure on a quarterly basis.
Provisional deaths are not based on all deaths that are observed during a specific reference period because of reporting delays. Provisional death counts are based on what is reported to Statistics Canada by provincial and territorial vital statistics registries.
Provisional death estimates have been adjusted to account for incomplete data. As a result, the provisional death counts and estimates released may not match figures from other sources, such as media reports, or counts and estimates from provincial and territorial health authorities and other agencies.
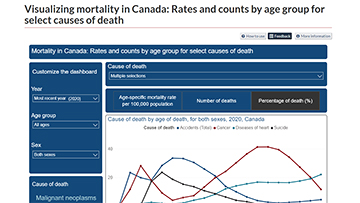
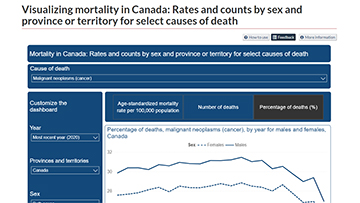
Visualizing mortality in Canada
Explore the cause of death trends in Canada since 2000 with these interactive dashboards. Metrics visualized on the dashboards are: number of deaths, death rate per 100,000 people, and the proportion of deaths represented by each selected cause of death.
The Provisional Deaths in Canada Dashboard allows users to examine recent mortality trends, by comparing the number of deaths being observed with previous years. Comparing provisional death counts and death estimates over time can be useful for understanding trends in mortality. As Canada's population grows and ages, the number of deaths is expected to increase from year to year. The Canadian Vital Statistics Death (CVS-D) database is the authoritative source for cause of death data in Canada. The CVS-D is an administrative survey that collects demographic and medical information from all provincial and territorial vital statistics registries on all deaths in Canada.


 Causes of death
 Infant mortality and fetal deaths (stillbirths)
 Life expectancy
 Mortality and death rates
 Survival rates
 Other content related to Life expectancy and deaths