


In the spring and summer of 2022, we asked Canadians about their health status and use of healthcare services during the previous year. About four in five Canadians (79.9%) reported a need for at least one health care service in the previous 12 months.
Some groups were more likely to have reported needing healthcare services in the 12 months preceding the survey, with 90.3% of those with a chronic health condition, 90.2% of those with a self-reported disability, 85.7% of women, and more than 85% of seniors 65 years of age and older reporting a need.
More than two in five Canadians (43.7%) told us they had difficulties accessing healthcare services to address these needs. Those most likely to report difficulties related to access were Canadians with a self-identified disability (62.5%) and women (46.8%).
Of those reporting difficulties accessing services to meet their health needs in the previous 12 months, nearly one in five (19.8%) said they had an appointment cancelled or delayed due to the COVID-19 pandemic.
The next most common obstacles reported in accessing health care were waiting too long for an appointment (18.8%), office closures due to quarantines (10.3%) and waiting for a referral (10.2%).
For many, virtual consultations provided a safe and convenient alternative to in-person appointments within the context of COVID-19. Survey results show that Canadians increasingly used virtual consultations (by phone or by video) as an alternate means to access the healthcare services they needed.
Nearly three in five Canadians who consulted with a family doctor, a nurse practitioner, a specialist or accessed mental health and addiction services did so virtually
As might be expected, studies show that the use of virtual consultations during the spring and summer of 2022 was higher than before the onset of the pandemic.
How people accessed health services and their use of virtual appointments varied by the type of consultation they were seeking, suggesting that some healthcare consultations lend themselves more easily to a virtual approach, whether by telephone or video meeting.
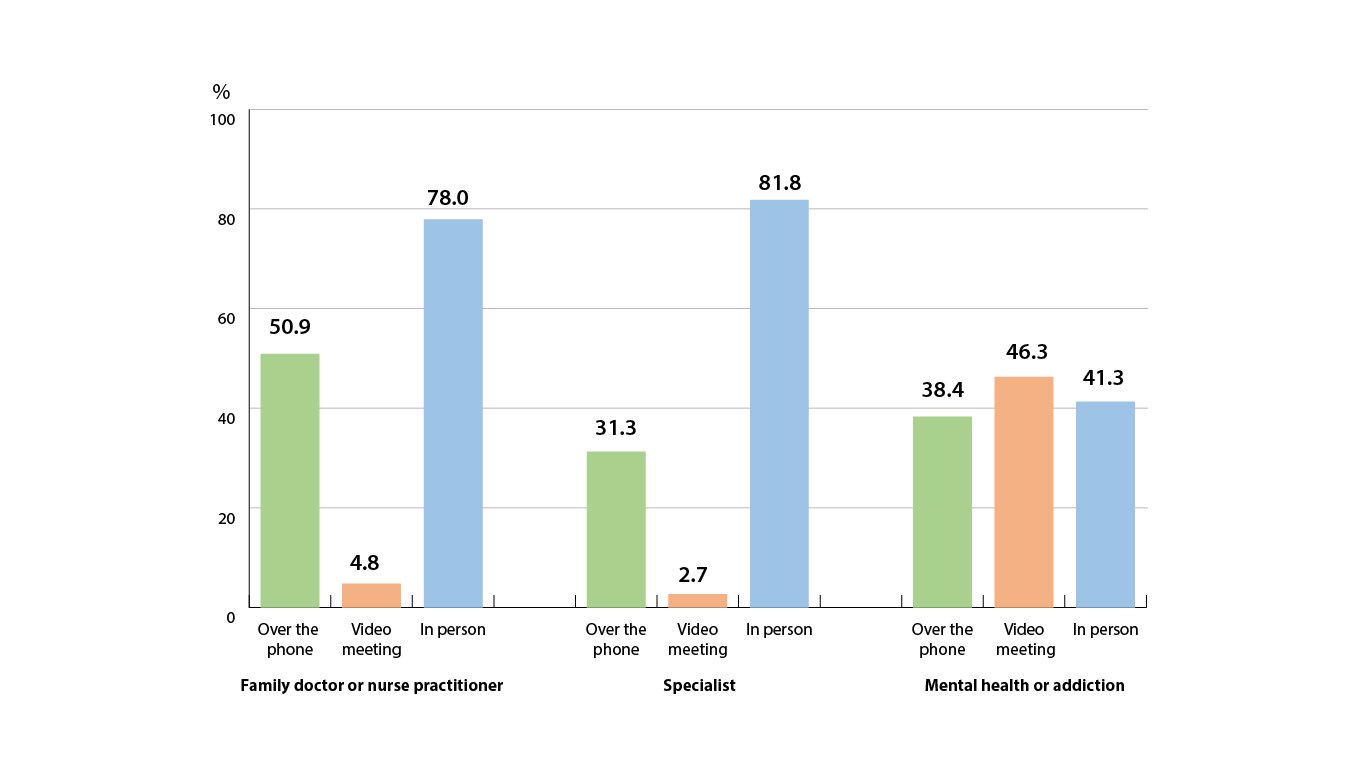
Just over half of Canadians (50.9%) who consulted a family doctor did so by telephone for at least one of their appointments throughout the year, while almost one-third (31.3%) of those who saw a specialist did so by telephone—a difference that may be explained by a more pressing medical need for physical tests and direct observations (and so an in-person appointment) when consulting with a specialist.
Canadians accessing mental health and addiction services were the most likely to consult using a video meeting, with 46.3% connecting with their healthcare provider in this way.
Chart 1: Health care services used by Canadians, by type of consultation, April 2021 to August 2022
Description - Chart 1: Health care services used by Canadians, by type of consultation, April 2021 to August 2022
The title of the chart is “Health care services used by Canadians, by type of consultation, April 2021 to August 2022”
This is a bar chart.
The vertical axis shows the percentage of Canadians using health care by type of consultation from 0% to 100%, in increments of 20%.
The horizontal axis shows nine bars, from left to right, under three category names titled “Family doctor or nurse practitioner”, “Specialist”, and “Mental health or addiction”, with each category also having three bars titled “Over the phone”, “Video meeting” and “In person.”
On the horizontal axis from left to right under “Family doctor or nurse practitioner”, 50.9% accessed health care services over the phone, 4.8% accessed health care services by a video meeting and 78.0% accessed health care in person.
On the horizontal axis from left to right under “Specialist”, 31.3% accessed health care services over the phone, 2.7% accessed health care services by a video meeting and 81.8% accessed health care in person.
On the horizontal axis from left to right under “Mental health or addiction”, 38.4% accessed health care services over the phone, 46.3% accessed health care services by a video meeting and 41.3% accessed health care in person.
Canadians living with chronic health conditions, self-identified disabilities, and mental health conditions are most likely to report using virtual consultations
Those with an existing condition or illness in the spring and summer of 2022 were more likely to have used virtual consultations in the previous 12 months than those in good health. This suggests that virtual consultations offered a more secure and convenient means of accessing health care for those who may have already been at risk because of an ongoing health condition.
Canadians seeking care in the previous 12 months who self-identified with a disability (66.4%) and those who had chronic health conditions (61.6%) were more likely to report using a virtual consultation than those who did not self-identify with a disability (55.0%) and those who did not have chronic health conditions (48.1%).
Those who perceived their general health as moderate or poor in the spring and summer of 2022 were more likely to use virtual consultations in the previous 12 months (68.7%) than those with good, very good, or excellent general health (54.9%). This trend was repeated for those Canadians who reported their mental health as moderate or poor, as they too were more likely to use virtual consultations (72.8%) than those who reported good, very good, or excellent mental health (53.9%).
There were no significant differences in the use of virtual consultations between racialized groups and non-racialized, non-Indigenous groups or between Indigenous and non-Indigenous groups.
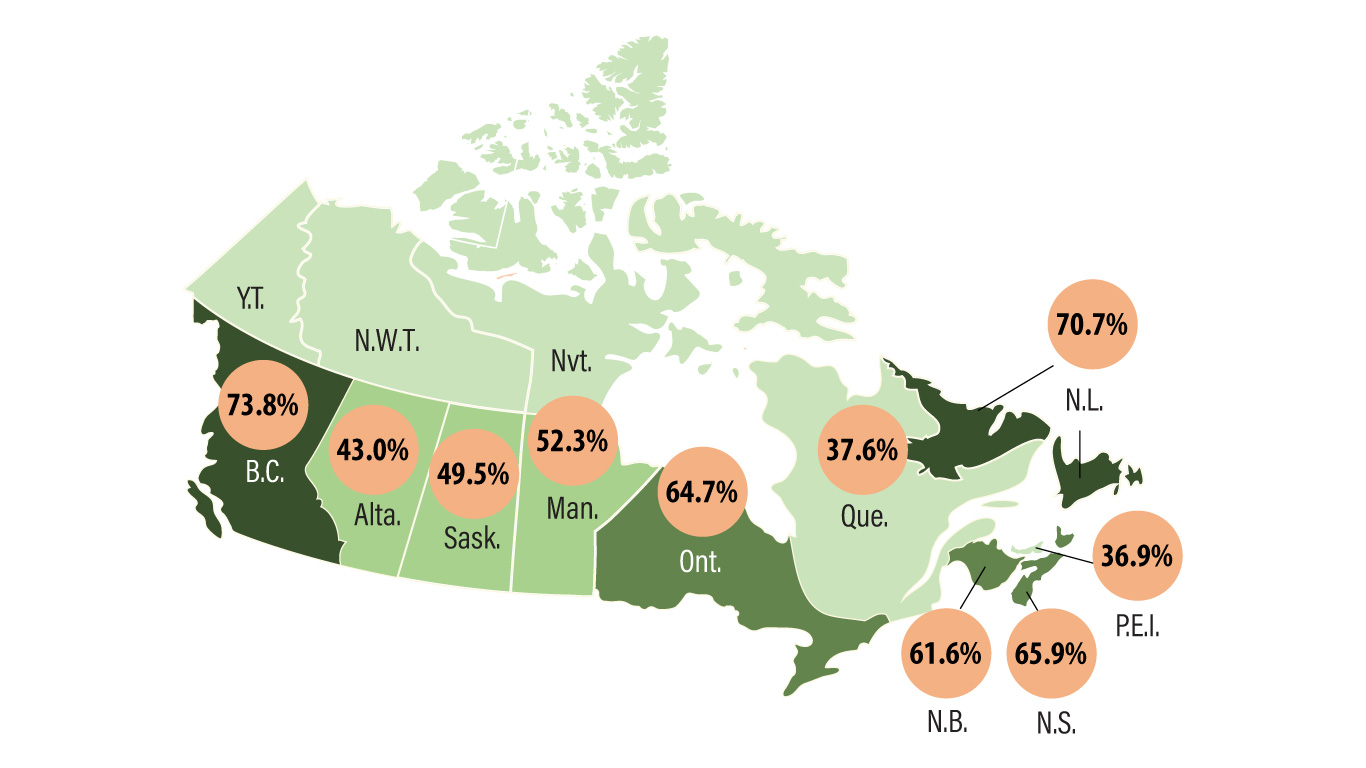
Canadians in British Columbia and Newfoundland and Labrador most likely to use virtual consultations
Canadians living in British Columbia (73.8%) and Newfoundland and Labrador (70.7%) were the most likely to have used a virtual consultation in the 12 months preceding the 2022 survey, while those living in Prince Edward Island (36.9%) and Quebec (37.6%) were the least likely to have done so.
Chart 2: Health care services used by Canadians, by telephone or video meeting, April 2021-August 2022
Description - Chart 2: Health care services used by Canadians, by telephone or video meeting, April 2021-August 2022
The title of the infographic is “Health care services used by Canadians, by telephone or video meeting, April 2021-August 2022”
This is a map of Canada showing the share of Canadians in every province who accessed health care, by telephone or video meeting, April 2021-August 2022”.
In Newfoundland and Labrador, the share of Canadians who accessed health care by telephone or video meeting was 70.7%.
In Prince Edward Island, the share of Canadians who accessed health care by telephone or video meeting was 36.9%.
In Nova Scotia, the share of Canadians who accessed health care by telephone or video meeting was 65.9%.
In New Brunswick, the share of Canadians who accessed health care by telephone or video meeting was 61.6%.
In Quebec, the share of Canadians who accessed health care by telephone or video meeting was 37.6%.
In Ontario, the share of Canadians who accessed health care by telephone or video meeting was 64.7%.
In Manitoba, the share of Canadians who accessed health care by telephone or video meeting was 52.3%.
In Saskatchewan, the share of Canadians who accessed health care by telephone or video meeting was 49.5%.
In Alberta, the share of Canadians who accessed health care by telephone or video meeting was 43.0%.
In British Columbia, the share of Canadians who accessed health care by telephone or video meeting was 73.8%.
StatsCAN app
Download the StatsCAN app today to have these articles at your fingertips! Already using the app? Leave a review in the Apple App Store and Google Play and let us know what you think.
Contact information
For more information, contact the Statistical Information Service (toll-free 1-800-263-1136; 514-283-8300; infostats@statcan.gc.ca) or Media Relations (statcan.mediahotline-ligneinfomedias.statcan@statcan.gc.ca).