


The cost of living in two of Canada’s most northerly cities, Whitehorse and Yellowknife, is well above the national average. However, while prices may be high, wages are also higher than the national average. Let’s take a closer look at household earnings and expenses in these two cities under the northern lights.
Households in Yellowknife have the highest before-tax discretionary income nationally
Whitehorse and Yellowknife had higher average household income before tax and expenditures, compared with the national average in 2021. The ratio of income before tax to expenditures was also positive in both cities, providing households with more discretionary average income (income after paying taxes and living expenses) than average Canadian households.
Chart 1: Average household income and expenditures are high in Whitehorse and Yellowknife, 2021

Description - Chart 1: Average household income and expenditures are high in Whitehorse and Yellowknife, 2021
The title of the chart is “Average household income and expenditures are high in Whitehorse, Yukon and Yellowknife, Northwest Territories, 2021.”
This is a grouped bar chart.
The vertical axis shows the amounts of average household income and expenditures in dollars, from $0 to $200,000 in increments of $50,000.
The horizontal axis shows three groups of two bars. The first bar represents average household income before tax, while the second bar represents average expenditure per household. Each group of bars represents, from left to right, Canada, Whitehorse, Yukon, and Yellowknife, Northwest Territories.
For Canada, the average household income before tax in 2021 was $106,366 and the average expenditure per household was $92,500.
For Whitehorse, Yukon, the average household income before tax in 2021 was $123,461 and the average expenditure per household was $107,066.
For Yellowknife, Northwest Territories, the average household income before tax in 2021 was $191,137 and the average expenditure per household was $140,112.
Sources: Tables 11-10-0222, 11-10-0228, 11-10-0233 and 11-10-0234.
On average, households in Whitehorse and Yellowknife spent more in all top five categories than all provinces in 2021
The top five categories for household spending are shelter, food, transportation, household operations and recreation. The average household expenditures in each of these categories in Whitehorse and Yellowknife surpassed the Canadian average in 2021.
Chart 2: Top five categories for average household consumption expenditures, 2021

Description - Chart 2: Top five categories for average household consumption expenditures, 2021
The title of the chart is “Top five categories for household consumption expenditures, 2021.”
This is a grouped bar chart.
The vertical axis shows three groups of five bars. The five bars, from top to bottom, represent transportation, shelter, recreation, household operations and food expenditures. Each group of bars represents, from top to bottom, Canada, Whitehorse, Yukon, and Yellowknife, Northwest Territories.
The horizontal axis shows the average household expenditures in dollars, from $0 to $35,000 in increments of $5,000.
For Canada, the average household expenditures in 2021 were $10,099 on transportation, $21,106 on shelter, $4,223 on recreation, $5,587 on household operations and $10,305 on food expenditures.
For Whitehorse, Yukon, the average household expenditures in 2021 were $13,144 on transportation, $22,452 on shelter, $7,084 on recreation, $6,887 on household operations and $11,835 on food expenditures.
For Yellowknife, Northwest Territories, the average household expenditures in 2021 were $13,048 on transportation, $30,956 on shelter, $7,128 on recreation, $8,121 on household operations and $13,223 on food expenditures.
Sources: Tables 11-10-0222 and 11-10-0233.
Affordable housing more prevalent in Whitehorse and Yellowknife than in Canada overall
Residents of Whitehorse and Yellowknife were more likely to live in affordable housing in 2021, with 86.9% of residents in Whitehorse and 88.3% in Yellowknife spending less than 30% of their income on housing. By way of comparison, the Canadian average is 83.2%.
Public administration the leading industry in Whitehorse and Yellowknife
Public administration was the largest employment sector in Yellowknife (29%) and Whitehorse (24%) in 2021, well above the national average of 6.2%. As the capital cities of Northwest Territories and Yukon, public administration is at the forefront of economic development within the region. Important roles include policy development, program management, and public service delivery.
Chart 3: Top eight industries, 2021
Description - Chart 3: Top eight industries, 2021
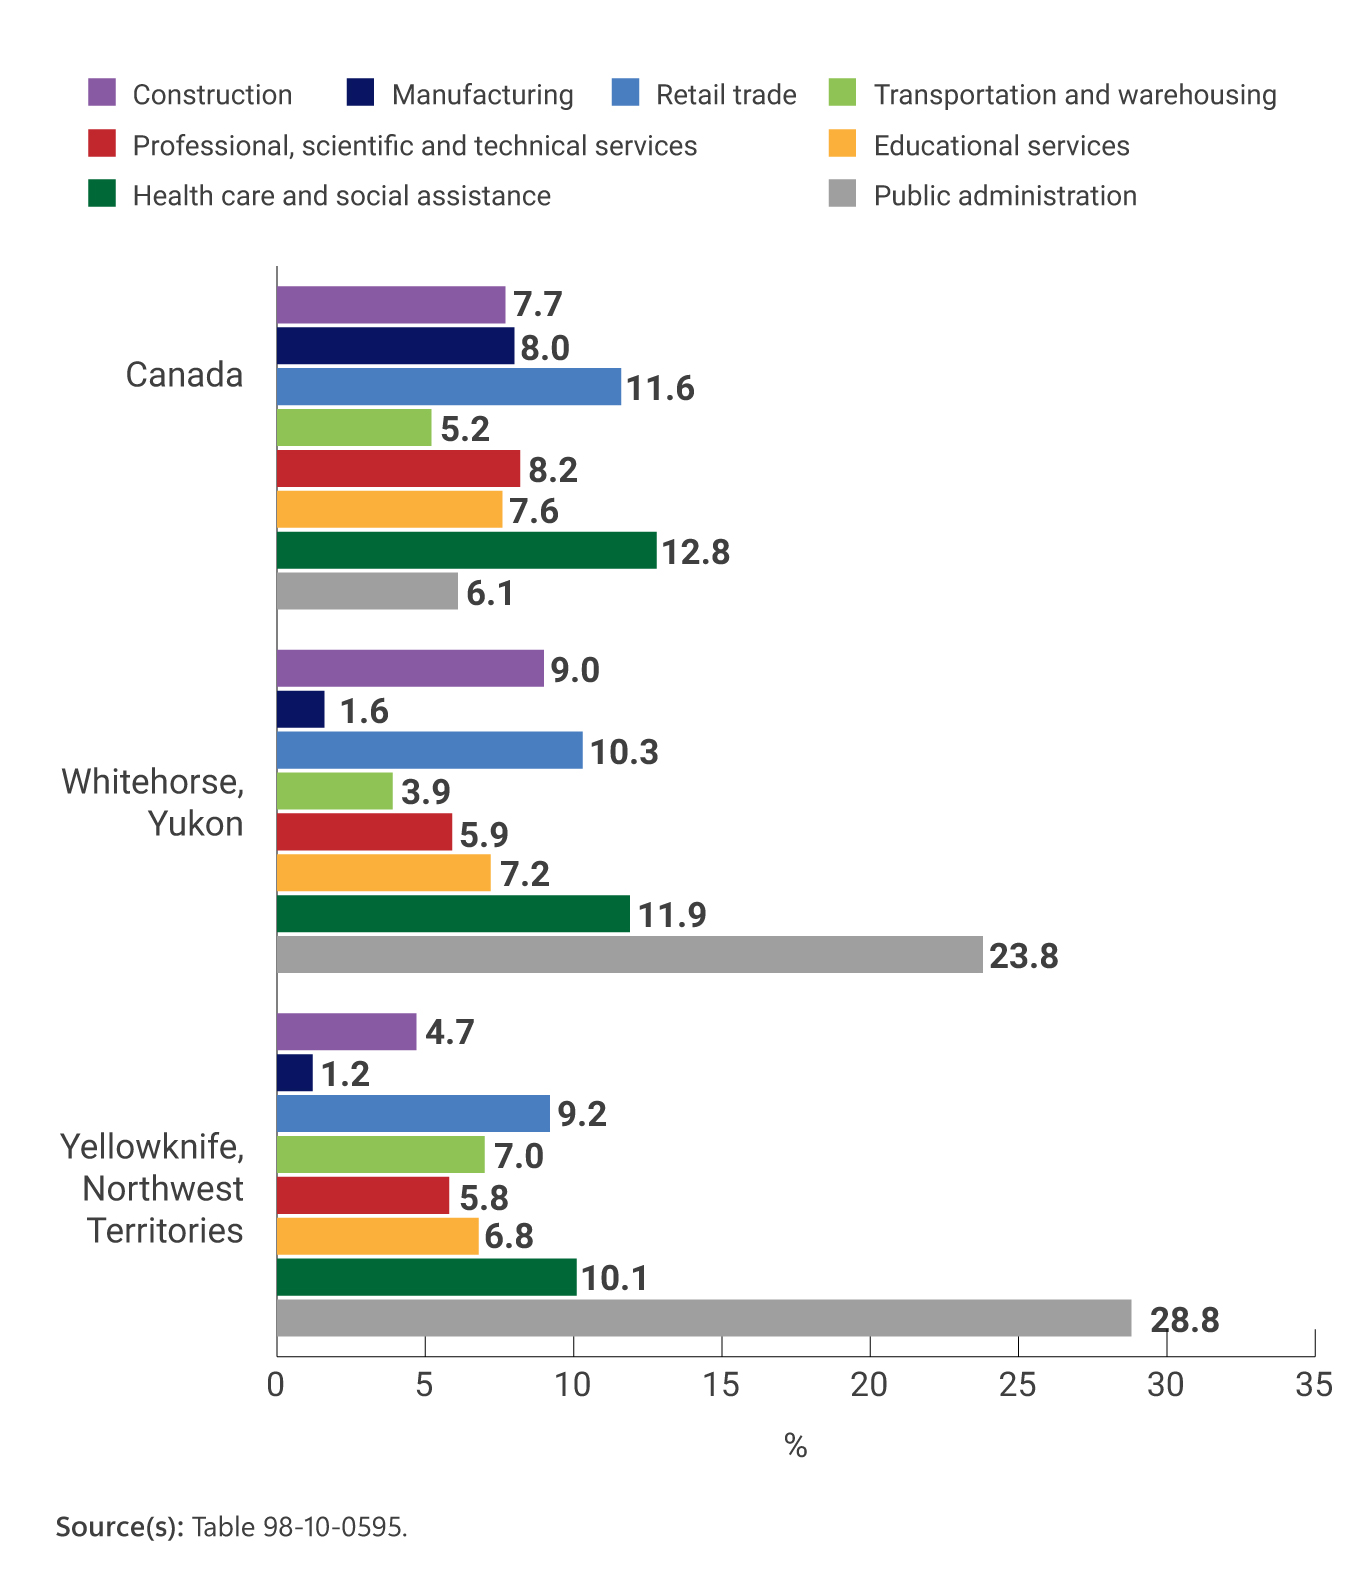
The title of the chart is “Top eight industries, 2021.”
This is a grouped bar chart.
The vertical axis shows three groups of eight bars. The eight bars, from top to bottom, represent construction; manufacturing; retail trade; transportation and warehousing; professional, scientific and technical services; educational services; health care and social assistance; and public administration.
Each group of bars represents, from top to bottom, Canada, Whitehorse, Yukon, and Yellowknife, Northwest Territories.
The horizontal axis shows the number of individuals who belong to different industries as a percent of the total of all industries, from 0% to 35% in increments of 5%.
For Canada, the percentage of individuals who belonged to different industries in 2021 was 7.7% in construction; 8.0% in manufacturing; 11.6% in retail trade; 5.2% in transportation and warehousing; 8.2% in professional, scientific and technical services; 7.6% in educational services; 12.8% in health care and social assistance; and 6.1% in public administration.
For Whitehorse, Yukon, the percentage of individuals who belonged to different industries in 2021 was 9.0% in construction; 1.6% in manufacturing; 10.3% in retail trade; 3.9% in transportation and warehousing; 5.9% in professional, scientific and technical services; 7.2% in educational services; 11.9% in health care and social assistance; and 23.8% in public administration.
For Yellowknife, Northwest Territories, the percentage of individuals who belonged to different industries in 2021 was 4.7% in construction; 1.2% in manufacturing; 9.2% in retail trade; 7.0% in transportation and warehousing; 5.8% in professional, scientific and technical services; 6.8% in educational services; 10.1% in health care and social assistance; and 28.8% in public administration.
Source(s): Table 98-10-0595.
In addition to being a major employer, public administration also offers higher wages than many other industries. In Yellowknife, for example, median wages in 2022 for public administration ($106,690) were more than 40% higher than the overall median wage across all industries ($76,550).
Similarly, in Whitehorse, median public administration wages ($81,790) also exceed overall median wages ($61,910). These stable incomes that circulate within the community attract skilled professionals from other regions to further contribute to the local economies.
In Whitehorse and Yellowknife, diverse communities are also experiencing economic success when combined with a bachelor’s degree or higher. Indeed, Indigenous people with a bachelor’s degree or higher in Whitehorse and Yellowknife have a median income of up to 8.4% higher, compared with their non-Indigenous counterparts.
While women in Whitehorse (-9.6%) and Yellowknife (-9.4%) reported a lower median income than men in 2021, the income gap was lower compared with Canada, where men earn one-fifth (+20.1%) more than women.

StatsCAN app
Download the StatsCAN app today to have these articles at your fingertips! Already using the app? Leave a review in the App Store and Google Play and let us know what you think.
Contact information
For more information, contact the Statistical Information Service (toll-free 1-800-263-1136; 514-283-8300; infostats@statcan.gc.ca) or Media Relations (statcan.mediahotline-ligneinfomedias.statcan@statcan.gc.ca).