
The tax system can be used to achieve public policy objectives through the application of special measures such as low tax rates, exemptions, deductions, deferrals and credits. The Department of Finance Canada publishes cost estimates and projections for these measures each year in the Report on Federal Tax Expenditures. This report also provides detailed background information on tax expenditures, including descriptions, objectives, historical information and references to related federal spending programs as well as evaluations and GBA Plus of tax expenditures.
The following supplementary information tables are available on Statistics Canada's website:
- Reporting on Green Procurement
- Gender-based analysis plus
- Response to Parliamentary Committees
- United Nations 2030 Agenda and the Sustainable Development Goals
Reporting on green procurement
This supplementary information table supports reporting on green procurement activities in accordance with the Policy on Green Procurement.
Context
Although Statistics Canada was not bound by the Federal Sustainable Development Act in 2022–23 and is not required to develop a full 2020-23 Departmental Sustainable Development Strategy (DSDS), Statistics Canada adheres to the principles of the Federal Sustainable Development Strategy (FSDS) by complying with the Policy on Green Procurement.
The Policy on Green Procurement supports the Government of Canada's effort to promote environmental stewardship. In keeping with the objectives of the policy, Statistics Canada supports sustainable development by integrating environmental performance considerations into the procurement decision-making process through the actions described in the 2019 to 2022 FSDS "Greening Government" goal.
Commitments
Greening government: The Government of Canada will transition to low‑carbon, climate-resilient and green operations
| FSDS target | FSDS contributing action(s) | Corresponding departmental action(s) | Starting point(s), performance indicator(s), target(s) | Results achieved | Contribution by each departmental result to the FSDS goal and target |
|---|---|---|---|---|---|
|
Actions supporting the Greening Government goal and the Policy on Green Procurement |
Strengthen green procurement criteria. |
Program: Procurement |
Starting point:
Target:
|
|
Incorporating environmental considerations into purchasing decisions through green procurement is expected to motivate suppliers to reduce the environmental impact of the goods and services they deliver and their supply chains. Relevant targets or ambitions:
|
Report on integrating sustainable development
During the 2022–23 reporting cycle, Statistics Canada had no proposals that required a strategic environmental assessment, and no public statements were produced.
Gender-based analysis plus
Section 1: institutional GBA Plus governance and capacity
Governance
The demand for disaggregated data and analyses that include a Gender-based Analysis Plus (GBA Plus) lens continues to increase. To best meet the increased demand for disaggregated data and better support its data users, Statistics Canada continued to increase its GBA Plus capacity and to implement its Disaggregated Data Action Plan (DDAP). The DDAP prioritizes the collection of diversity data (e.g., data that may be broken down by sex or gender, as well as data about Indigenous peoples, racialized groups and people with disabilities) across Statistics Canada's programs. The DDAP also emphasizes Statistics Canada's responsibility for continually identifying and addressing data and knowledge gaps and supporting representative data collection across the country, across age groups and at various levels of geography. In these ways, the DDAP is a key enabler for GBA Plus and intersectional analysis. Such analyses provide much-needed information on the experiences and outcomes of Canadians. In turn, this information allows for more informed decision making, more equitable delivery of programs and services, and the tracking of progress toward a fairer and more inclusive society.
Capacity
Statistics Canada's Centre for Gender, Diversity and Inclusion Statistics (CGDIS) is responsible for reporting to Canadians, generating new information, and building GBA Plus knowledge and capacity. In 2022–23, the scope of the CGDIS increased to support the DDAP, including reviewing, developing and promoting diversity-related statistical standards; to support several Government of Canada initiatives (e.g., Canada's Anti-Racism Strategy and the Federal 2SLGBTQI+ Action Plan); and to produce a great number of statistical products and insights. Previously, the CGDIS released an updated Gender, Diversity and Inclusion Statistics Hub and last year released a sex, gender and sexual orientation customized taxonomy to organize relevant content in an easily accessible way. The hub allows users to access Statistics Canada data relevant to GBA Plus. The CGDIS supported and engaged with an array of stakeholders to better understand their perspectives and data needs; provide methodological advice and analytic expertise on areas related to gender, diversity and inclusion in Canada; and increase GBA Plus knowledge and capacity, both internally and externally. Additionally, the CGDIS continued to lead the agency-wide GBA Plus Responsibility Network to keep developing effective programs and initiatives, an important step toward increased capacity and further GBA Plus implementation throughout the agency. These will benefit the agency's data, people and internal processes, as well as those who rely on the agency's trusted data, analytical products and insights. The CGDIS also implemented a community of practice to provide a communication channel to share best practices and case studies on how to implement GBA Plus in any strategy or initiative.
Statistics Canada owes its success to its talented, diverse and inclusive workforce. To best support its workforce, the agency continued to follow its Equity, Diversity and Inclusion Leadership Accountability Framework. This framework increases the agency's accountability to employment equity committees and enables it to better serve its employees through clearly identified roles and responsibilities.
Finally, the agency continued to implement the 2021-to-2025 Equity, Diversity and Inclusion Action Plan: Moving Forward Together, as well as the Integrity and Respect Action Plan. Both action plans aim to improve and promote diversity and inclusion within the workplace, eliminate systemic barriers in appointment processes, and increase representation at all levels across the agency.
Section 2: gender and diversity impacts, by program
Core responsibility: Statistical Information
Program name: Economic and Environmental Statistics
Program goals: The Economic and Environmental Statistics program produces a wide range of economic and environmental statistics, on topics such as national and international accounts, manufacturing, wholesale trade, retail trade, research and development, price indexes, finance, tourism, transportation, agriculture, and the environment.
Target population: All Canadians
Distribution of benefits
| Distribution | Group |
|---|---|
| By gender | The program's target population is all Canadians, and the distribution of benefits is equal by gender, income level and age. |
| By income level | The program's target population is all Canadians, and the distribution of benefits is equal by gender, income level and age. |
| By age group | The program's target population is all Canadians, and the distribution of benefits is equal by gender, income level and age. |
Key program impacts on gender and diversity
| Statistic | Observed results | Data source | Comment |
|---|---|---|---|
| Number of GBA Plus-related statistical products (e.g., catalogued products, such as data tables, research articles, studies, fact sheets, infographics, interactive dashboards, reference products, and minor and major releases disseminated through The Daily) made available on Statistics Canada's website | 627 | Administrative data file that tracks GBA Plus outreach within the Economic and Environmental Statistics program | GBA Plus factors considered in the calculation of this performance indicator include one or more of the following intersectional identity characteristics: sex or gender, age, geography, language, income, Indigenous identity, 2SLGBTQ+ identity, education, race, ethnicity, religion, and disability status. |
| Number of GBA Plus outreach activities (e.g., consultations and presentations) for external stakeholders (e.g., other government departments, academia and non-governmental organizations) | 65 | Administrative data file that tracks GBA Plus outreach within the Economic and Environmental Statistics program | |
| Number of training and awareness initiatives related to GBA Plus | 0 | Administrative data file that tracks GBA Plus outreach within the Economic and Environmental Statistics program | |
| Number of surveys or other tools collecting data on the following GBA Plus identity factors: gender and sexual orientationEconomic and Environmental Statistics - Table note 1 | 8 | Administrative data file that tracks GBA Plus outreach within the Economic and Environmental Statistics program | GBA Plus factors considered in the calculation of this performance indicator include one or more of the following intersectional identity characteristics: sex or gender, age, geography, language, income, Indigenous identity, 2SLGBTQ+ identity, education, race, ethnicity, religion and disability status. |
|
|||
GBA Plus data collection plan
In 2022–23, data requirements to measure impacts were completed. Statistics Canada continues to actively review and analyze the set of measures to identify gaps and improvements where possible.
Program name: Socio-economic Statistics
Program goals: The Socio-economic Statistics program provides integrated information and relevant analysis on the demographic and socio-economic characteristics of individuals, families and households, as well as on the major factors that affect their well-being. Many of the statistical products produced allow for GBA Plus analyses for key population groups.
Target population: All Canadians
Distribution of benefits
| Distribution | Group |
|---|---|
| By gender | The program's target population is all Canadians, and the distribution of benefits is equal by gender, income level and age. |
| By income level | The program's target population is all Canadians, and the distribution of benefits is equal by gender, income level and age. |
| By age group | The program's target population is all Canadians, and the distribution of benefits is equal by gender, income level and age. |
Key program impacts on gender and diversity
| Statistic | Observed results | Data source | Comment |
|---|---|---|---|
| Number of GBA Plus-related statistical products (e.g., catalogued products, such as data tables, research articles, studies, fact sheets, infographics, interactive dashboards, reference products, and minor and major releases disseminated through The Daily) made available on Statistics Canada's website | 218 | Administrative data file that tracks GBA Plus products within the Socio-economic Statistics program | GBA Plus factors considered in the calculation of this performance indicator include one or more of the following intersectional identity characteristics: sex or gender, age, geography, language, income, Indigenous identity, 2SLGBTQ+ identity, education, race, ethnicity, religion, and disability status. |
| Number of GBA Plus outreach activities (e.g., consultations and presentations) for external stakeholders (e.g., other government departments, academia and non-governmental organizations) | 10 | Administrative data file that tracks number of GBA Plus outreach within the Socio-economic Statistics program | |
| Number of training and awareness initiatives related to GBA Plus | 6 | Administrative data file that tracks number of GBA Plus training within the Socio-economic Statistics program | |
| Number of visits to the Gender, Diversity and Inclusion Statistics Hub in 2022–23Socio-economic Statistics - Table note 2 | 39,836 | Administrative data file that tracks number of Gender, Diversity and Inclusion Statistics Hub visits | |
| Number of Gender Results Framework indicators released by sex or gender in 2022–23Socio-economic Statistics - Table note 2 | 3 | Administrative data file that tracks the Gender Results Framework | |
| Number of Gender Results Framework indicators released by sex or gender and other identity factors in 2022–23Socio-economic Statistics - Table note 2 | 3 | Administrative data file that tracks the Gender Results Framework | |
| Percentage of programs from the program inventory, excluding internal services, that have data collection plans for reporting on impacts on gender and diversitySocio-economic Statistics - Table note 2 | 100% | Statistics Canada's website | |
| Number of surveys or other tools collecting data on the following GBA Plus identity factors: gender and sexual orientationSocio-economic Statistics - Table note 1 | 71 | Administrative data file that tracks the number of tools collecting GBA Plus identity factors within the Socio-economic Statistics program | GBA Plus factors considered in the calculation of this performance indicator include one or more of the following intersectional identity characteristics: sex or gender, age, geography, language, income, Indigenous identity, 2SLGBTQ+ identity, education, race, ethnicity, religion, and disability status. |
|
|||
GBA Plus data collection plan
In 2022–23, data requirements to measure impacts were completed. Statistics Canada continues to actively review and analyze the set of measures to identify gaps and improvements where possible.
Program name: Censuses
Program goals: The Censuses program provides statistical information and analyses that measure changes in the Canadian population and its demographic characteristics, and in the agricultural sector. The program includes the Census of Population and the Census of Agriculture.
Target population: All Canadians
Distribution of benefits
| Distribution | Group |
|---|---|
|
By gender |
The program's target population is all Canadians, and the distribution of benefits is equal by gender, income level and age. |
|
By income level |
The program's target population is all Canadians, and the distribution of benefits is equal by gender, income level and age. |
|
By age group |
The program's target population is all Canadians, and the distribution of benefits is equal by gender, income level and age. |
Key program impacts on gender and diversity
The Censuses program is cyclical and includes an array of activities (e.g., consultation and engagement, questionnaire development, data collection, data processing, and dissemination) that must be completed to ensure its success. From start to finish, each census cycle spans approximately seven years, with cycles overlapping (i.e., when one cycle is nearing completion, the next cycle begins). For example, the 2021 Census of Population Program will conclude in 2024–25 with an evaluation of the dissemination results, while the 2026 Census of Population Program will begin in 2023–24.
| Statistic | Observed results | Data source | Comment |
|---|---|---|---|
| Number of GBA Plus-related statistical products (e.g., catalogued products, such as data tables, research articles, studies, fact sheets, infographics, interactive dashboards, reference products, and minor and major releases disseminated through The Daily) made available on Statistics Canada's website | 413 | Statistics Canada's website |
This GBA Plus Supplementary Information Table for fiscal year 2022–23 reflects where a census is within the census cycle. Note that census releases tend to be disseminated throughout, and within, one to two fiscal years, meaning that zero observed results will be reported for years that did not include one or more census releases. GBA Plus factors considered in the calculation of this performance indicator include one or more of the following intersectional identity characteristics: sex or gender, age, geography, language, income, Indigenous identity, 2SLGBTQ+ identity, education, race, ethnicity, religion, and disability status. |
| Number of GBA Plus outreach activities (e.g., consultations and presentations) for external stakeholders (e.g., other government departments, academia and non-governmental organizations) | 0 | Statistics Canada's website | |
| Number of training and awareness initiatives related to GBA Plus | 0 | Statistics Canada's website | |
| Number of surveys or other tools collecting data on the following GBA Plus identity factors: gender and sexual orientationCensuses - Table note 1 | 0 | Statistics Canada's website | GBA Plus factors considered in the calculation of this performance indicator include one or more of the following intersectional identity characteristics: sex or gender, age, geography, language, income, Indigenous identity, 2SLGBTQ+ identity, education, race, ethnicity, religion, and disability status. |
|
|||
GBA Plus data collection plan
In 2022–23, data requirements to measure impacts were completed. Statistics Canada continues to actively review and analyze the set of measures to identify gaps and improvements where possible.
Program name: Cost-Recovered Statistical Services
Program goals: Through the Cost-recovered Statistical Services program, Statistics Canada conducts special surveys to gather new data; produces high-quality statistics that are currently not part of the agency's data holdings; and conducts on-demand special analytical projects to meet specific needs of federal, provincial and territorial institutions and other clients.
Target population: All Canadians
Distribution of benefits
| Distribution | Group |
|---|---|
|
By gender |
The program's target population is all Canadians, and the distribution of benefits is equal by gender, income level and age. |
|
By income level |
The program's target population is all Canadians, and the distribution of benefits is equal by gender, income level and age. |
|
By age group |
The program's target population is all Canadians, and the distribution of benefits is equal by gender, income level and age. |
Key program impacts on gender and diversity
Indicators for cost-recovered products are included in their respective program area (i.e., Economic and Environmental Statistics, Socio-economic Statistics, and Centres of Expertise) and not identified separately.
| Statistic | Observed results | Data source | Comment |
|---|---|---|---|
| Number of GBA Plus-related statistical products (e.g., catalogued products, such as data tables, research articles, studies, fact sheets, infographics, interactive dashboards, reference products, and minor and major releases disseminated through The Daily) made available on Statistics Canada's website | 39 | Excel file that tracks the number of GBA-Plus related products available on Statistic's Canada website with the Cost-Recovered Statistical Services | GBA Plus factors considered in the calculation of this performance indicator include one or more of the following intersectional identity characteristics: sex or gender, age, geography, language, income, Indigenous identity, 2SLGBTQ+ identity, education, race, ethnicity, religion, and disability status. |
| Number of GBA Plus outreach activities (e.g., consultations and presentations) for external stakeholders (e.g., other government departments, academia and non-governmental organizations) | 0 | Statistics Canada's website | |
| Number of training and awareness initiatives related to GBA Plus | 0 | Statistics Canada's website | |
| Number of surveys or other tools collecting data on the following GBA Plus identity factors: gender and sexual orientationCost-Recovered Statistical Services - Table note 1 | 0 | Statistics Canada's website | GBA Plus factors considered in the calculation of this performance indicator include one or more of the following intersectional identity characteristics: sex or gender, age, geography, language, income, Indigenous identity, 2SLGBTQ+ identity, education, race, ethnicity, religion, and disability status. |
|
|||
GBA Plus data collection plan
In 2022–23, data requirements to measure impacts were completed. Statistics Canada continues to actively review and analyze the set of measures to identify gaps and improvements where possible.
Program name: Centres of Expertise
Program goals: The Centres of Expertise support all Statistics Canada programs to ensure that Canadian citizens, businesses, governments, universities and other institutions have access to the most detailed, timely and accurate information at the lowest cost possible—both in terms of dollars and response burden—while protecting the privacy of their information. The Centres of Expertise undertake innovative research, analysis and data development activities and continually seek new data sources, leading-edge methods and systems, cost-effective operations, and new statistical products to address the current and future information needs of Canadians.
Target population: All Canadians
Distribution of benefits
| Distribution | Group |
|---|---|
|
By gender |
The program's target population is all Canadians, and the distribution of benefits is equal by gender, income level and age. |
|
By income level |
The program's target population is all Canadians, and the distribution of benefits is equal by gender, income level and age. |
|
By age group |
The program's target population is all Canadians, and the distribution of benefits is equal by gender, income level and age. |
Key program impacts on gender and diversity
| Statistic | Observed results | Data source | Comment |
|---|---|---|---|
| Number of GBA Plus-related statistical products (e.g., catalogued products, such as data tables, research articles, studies, fact sheets, infographics, interactive dashboards, reference products, and minor and major releases disseminated through The Daily) made available on Statistics Canada's website | 48 | Administrative data file that tracks the number of GBA Plus-related products within the Centres of Expertise program. | GBA Plus factors considered in the calculation of this performance indicator include one or more of the following intersectional identity characteristics: sex or gender, age, geography, language, income, Indigenous identity, 2SLGBTQ+ identity, education, race, ethnicity, religion, and disability status. |
| Number of GBA Plus outreach activities (e.g., consultations and presentations) for external stakeholders (e.g., other government departments, academia and non-governmental organizations) | 0 | Statistics Canada's website | |
| Number of training and awareness initiatives related to GBA Plus | 2 | Statistics Canada's website | |
| Number of surveys or other tools collecting data on the following GBA Plus identity factors: gender and sexual orientationCentres of Expertise - Table note 1 | 0 | Statistics Canada's website | GBA Plus factors considered in the calculation of this performance indicator include one or more of the following intersectional identity characteristics: sex or gender, age, geography, language, income, Indigenous identity, 2SLGBTQ+ identity, education, race, ethnicity, religion, and disability status. |
|
|||
GBA Plus data collection plan
In 2022–23, data requirements to measure impacts were completed. Statistics Canada continues to actively review and analyze the set of measures to identify gaps and improvements where possible.
Scales
Gender scale
- First group: predominantly men (80% or more men)
- Second group: 60% to 79% men
- Third group: broadly gender-balanced
- Fourth group: 60% to 79% women
- Fifth group: predominantly women (80% or more women)
Income‑level scale
- First group: strongly benefits low‑income individuals (strongly progressive)
- Second group: somewhat benefits low‑income individuals (somewhat progressive)
- Third group: no significant distributional impacts
- Fourth group: somewhat benefits high‑income individuals (somewhat regressive)
- Fifth group: strongly benefits high‑income individuals (strongly regressive)
Age‑group scale
- First group: primarily benefits youth, children or future generations
- Second group: no significant intergenerational impacts or impacts on generations between youths and seniors
- Third group: primarily benefits seniors or the baby boom generation
Response to parliamentary committees and external audits
Response to parliamentary committees
There were no parliamentary committee reports in 2022–23 requiring a response.
Response to audits conducted by the Office of the Auditor General of Canada (including audits conducted by the Commissioner of the Environment and Sustainable Development)
2022 Report 1 of the Auditor General of Canada
Summary of the chapter with hyperlink from the chapter's title to the department's response: This audit focused on whether the Canada Revenue Agency (CRA) and Employment and Social Development Canada (ESDC) directly, or through leveraging other federal departments and other non‑federal government entities, ensured that hard‑to‑reach populations were made aware of, and could access, the Canada Child Benefit, the Canada Workers Benefit, the Guaranteed Income Supplement and the Canada Learning Bond.
Recommendation 1.31: The CRA, ESDC and Statistics Canada should establish a joint prioritization, planning, monitoring and reporting process to improve how they measure the take-up of benefits. This should include
- assessing available and specific data holdings on hard-to-reach populations
- defining and implementing actions to collect additional data on specific hard-to-reach populations
- improving the use of data in measuring benefit take-up and the sources of gaps in benefit take-up.
Departmental response: Agreed. Statistics Canada emphasizes that there are substantial statistical difficulties with computing take‑up rates as described in some places in this report. The challenges result from problems including missing (or non‑existent) data, imperfect record linkages, and coverage issues (such as surveys that do not collect data on‑reserve or in institutions), which lead to difficulties accurately modelling the size of the population eligible for a benefit. As a result, the use of take‑up rates for monitoring and reporting progress is limited, and other solutions must also be used for monitoring and reporting progress on take‑up. Despite this, estimated take‑up rates can and have been used successfully to help describe differences in take‑up between groups and to help identify population groups to target for interventions.
The recommendation includes assessing available specific data holdings on hard‑to‑reach populations, defining and implementing actions to collect additional data on hard‑to‑reach populations, and improving the use of data in measuring benefit take‑up and the sources of gaps in benefit take‑up. Once a plan has been agreed upon with the CRA and ESDC, Statistics Canada will present funding requirements to federal partners to allow for the work to proceed. Statistics Canada emphasizes that its actions cannot include sharing of confidential microdata with the department or agency. It should be noted that funding has not been identified for these activities, and the majority of Statistics Canada's social statistics programs are cost recovery and funded by federal departments.
Corrective action taken to address the recommendations: Measures put in place by Statistics Canada with its partners, the CRA and ESDC, to address Recommendation 1.31 include the following:
- Improving governance: To ensure that the CRA, ESDC and Statistics Canada work effectively and efficiently together to ensure ongoing prioritization, development and reporting on the take-up of benefits for hard-to-reach populations, the three organizations have formalized governance, leveraging existing working groups and implementing new working groups, committees and senior decision-making tables.
- Improving the use of available data: The CRA and Statistics Canada are completing a second iteration of a study that links T1 tax data for the 2020 tax year to 2021 Census data to better understand participation in the tax and benefits system for different segments of the population.
- Conducting new research: Statistics Canada is examining the tax filing behaviour of recent immigrants (e.g., families with children younger than 18) to determine whether they accessed the benefits for which they were eligible. Statistics Canada also undertook a study that focused on Canadian tax filers deemed eligible for child tax benefits who were observed not receiving them.
- Improving methodologies: Statistics Canada provided population projections to allow ESDC to estimate the eligible base for the Canada Child Benefit to improve calculation of the take-up rate. Statistics Canada also worked with its partners to ensure that consistent definitions of concepts and at-risk groups are used.
- Developing a critical path: Statistics Canada created a critical path for activities through March 2024.
Response to audits conducted by the Public Service Commission of Canada or the Office of the Commissioner of Official Languages
There were no audits in 2022–23 requiring a response.
United Nations 2030 Agenda for Sustainable Development and the Sustainable Development Goals
| UN Sustainable Development Goals (SDGs) | 2022‒23 planned initiatives | Associated domestic targets or "ambitions" and/or global targets | 2022‒23 results |
|---|---|---|---|
|
SDGs 1 to 17 |
In 2022-23, Statistics Canada will update the Global Indicator Framework and Canadian Indicator Framework data hubs to increase data disaggregation and to update data for indicators where new data are available. Over the second half of 2022–23 and into 2023–24, Statistics Canada will develop infographics for the 17 SDGs and undertake a staggered release strategy to disseminate them. Statistics Canada will develop an SDG measure of progress to provide a robust and simple method to communicate progress on the SDG indicators.
|
All goals and targets in both the Canadian Indicator Framework and Global Indicator Framework |
In 2022–23, Statistics Canada continued to report on both the Global Indicator Framework and the Canadian Indicator Framework for SDGs in the SDG portals. In addition, over the course of the 2022–23 fiscal year, Statistics Canada released infographics on SDGs 1 to 11. Those for the last six goals will be released during the 2023–24 fiscal year. Statistics Canada also developed an easy-to-understand statistical measure of progress for SDG indicators that can be used to communicate areas where progress is being made or where there has been little progress. Statistics Canada drafted the statistical annex for the 2023 Voluntary National Review and also validated data in the main report. |
Financial, human resources and performance information for Statistics Canada's program inventory is available in GC InfoBase.
Organizational profile
Appropriate minister: The Honourable François-Philippe Champagne, P.C., M.P.
Institutional head: Anil Arora
Ministerial portfolio: Innovation, Science and Economic Development
Enabling instrument[s]:
Year of incorporation / commencement: The Dominion Bureau of Statistics was established in 1918. In 1971, with the revision of the Statistics Act, the agency became Statistics Canada.
Other: Under the Statistics Act, Statistics Canada is required to collect, compile, analyze, abstract and publish statistical information relating to the commercial, industrial, financial, social, economic and general activities and condition of the people of Canada.
Statistics Canada has two primary objectives:
- to provide statistical information and analysis on the economic and social structure and functioning of Canadian society, as a basis for developing, operating and evaluating public policies and programs; for public and private decision making; and for the general benefit of all Canadians
- to promote the quality, coherence and international comparability of Canada's statistics through collaboration with other federal departments and agencies, with the provinces and territories, and in accordance with sound scientific standards and practices.
Statistics Canada's head office is located in Ottawa. There are regional offices across the country in Halifax, Sherbrooke, Montréal, Toronto, Sturgeon Falls, Winnipeg, Edmonton and Vancouver. There are also 35 research data centres located throughout the country in academic institutions. In addition, there are five secure rooms available for access by employees of federal departments and selected provincial ministries. These centres provide researchers with access to microdata from population and household survey programs in a secure setting. Canadians can follow the agency on X (formerly Twitter), Facebook, Instagram, Reddit, feeds and YouTube.
Raison d'être, mandate and role: who we are and what we do
"Raison d’être, mandate and role: who we are and what we do" is available on Statistics Canada's website.
For more information on the department’s organizational mandate letter commitments, see the Minister Mandate letter.
Operating context
Information on the operating context is available on Statistics Canada's website.
Reporting framework
Statistics Canada's departmental results framework and program inventory of record for 2022–23 are shown below.
Departmental Results Framework
Core Responsibility: Statistical Information
Statistics Canada produces objective high-quality statistical information for the whole of Canada. The statistical information produced relates to the commercial, industrial, financial, social, economic, environmental and general activities and conditions of the people of Canada.
Result 1
High-quality statistical information is available to Canadians.
- Indicator 1: Number of post-release corrections due to accuracy.
- Indicator 2: Percentage of international standards with which Statistics Canada conforms.
- Indicator 3: Number of statistical products available on the website.
- Indicator 4: Number of Statistics Canada data tables available on the Open Data Portal.
Result 2
High-quality statistical information is accessed by Canadians.
- Indicator 1: Number of visits to Statistics Canada website.
- Indicator 2: Number of hits on Statistics Canada's Application Programming Interface (API).
- Indicator 3: Percentage of website visitors that found what they were looking for.
- Indicator 4: Number of interactions on social media.
Result 3
High quality statistical information is relevant to Canadians.
- Indicator 1: Number of media citations on Statistics Canada data.
- Indicator 2: Number of journal citations.
- Indicator 3: Percentage of users satisfied with statistical information.
Internal Services
Program Inventory
- Economic and Environmental Statistics
- Socio-economic Statistics
- Censuses
- Cost-Recovered Statistical Services
- Centres of Expertise
Spending
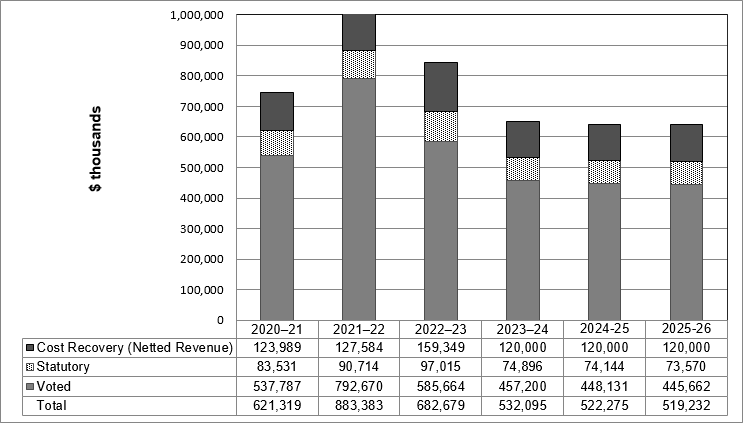
Spending 2020–21 to 2025–26
The following graph presents planned (voted and statutory spending) over time.
Image
Description - Purpose-based engagement
| 2020–21 | 2021–22 | 2022–23 | 2023–24 | 2024-25 | 2025-26 | |
|---|---|---|---|---|---|---|
| Cost Recovery (Netted Revenue) | 123,989 | 127,584 | 159,349 | 120,000 | 120,000 | 120,000 |
| Statutory | 83,531 | 90,714 | 97,015 | 74,896 | 74,144 | 73,570 |
| Voted | 537,787 | 792,670 | 585,664 | 457,200 | 448,131 | 445,662 |
| Total | 621,319 | 883,383 | 682,679 | 532,095 | 522,275 | 519,232 |
Budgetary performance summary for core responsibilities and internal services (dollars)
The "Budgetary performance summary for core responsibilities and internal services" table presents the budgetary financial resources allocated for Statistics Canada's core responsibilities and for internal services.
| Core responsibilities and internal services | 2022–23 Main Estimates | 2022–23 planned spending | 2023–24 planned spending | 2024–25 planned spending | 2022–23 total authorities available for use | 2020–21 actual spending (authorities used) | 2021–22 actual spending (authorities used) | 2022–23 actual spending (authorities used) |
|---|---|---|---|---|---|---|---|---|
| Statistical information | 616,663,357 | 616,663,357 | 579,311,471 | 571,978,435 | 754,356,616 | 666,463,788 | 920,977,524 | 731,447,169 |
| Internal services | 80,030,892 | 80,030,892 | 72,783,788 | 70,296,376 | 111,048,632 | 78,844,148 | 89,989,424 | 110,581,024 |
| Total gross expenditures | 696,694,249 | 696,694,249 | 652,095,259 | 642,274,811 | 865,405,248 | 745,307,936 | 1,010,966,948 | 842,028,193 |
| Respendable revenue | -120,000,000 | -120,000,000 | -120,000,000 | -120,000,000 | -159,349,013 | -123,989,068 | -127,583,773 | -159,349,013 |
| Total net expenditures | 576,694,249 | 576,694,249 | 532,095,259 | 522,274,811 | 706,056,235 | 621,318,868 | 883,383,175 | 682,679,180 |
Statistics Canada is funded by two sources: direct parliamentary appropriations and cost-recovery activities. It has the authority to generate $120 million annually in respendable revenue related to two streams: statistical surveys and related services, and custom requests and workshops. If exceeded, a request can be made to increase the authority, as was the case in the last few years.
In recent years, respendable cost-recovery revenue has contributed $120 million to $159 million annually to the agency's total resources. A large portion of this respendable revenue comes from federal departments to fund specific statistical projects. Respendable revenue increased in 2022–23 because of additional work associated with extra demands following the slowdown during the pandemic and the 2021 Census.
Spending fluctuations between the years shown in the graph and table above were mainly caused by the Census Program. Activity for this program peaked in 2021–22 when the 2021 Census of Population and the 2021 Census of Agriculture were conducted and drops in 2022–23 and 2023–24 as these activities wind down. This pattern is typical for the agency because of the cyclical nature of the Census Program. Funding for the 2026 Census of Population and the 2026 Census of Agriculture is not reflected, amplifying the decrease in the overall statistical information funding.
In addition, funding received for new initiatives from Budget 2021 is decreasing from 2022–23 to 2023–24 and will remain relatively the same in 2024–25.
The difference between 2022–23 actual spending and 2022–23 total authorities available for use is largely attributable to how the agency strategically manages its investments. The agency leverages the operating budget carry-forward mechanism to manage the cyclical nature of program operations and investments in the agency's strategic priorities.
Internal services spending from 2020–21 to 2022–23 includes resources from temporary funding related to an initiative approved in 2018–19 to migrate the agency's infrastructure to the cloud. The decrease in funding for outer years is largely attributable to ongoing funding related to cloud expenditures not yet secured and the agency's investment planning cycle. Investment funding from past years will come to an end in future years, while new investment decisions will be finalized only later in the year.
2022–23 Budgetary actual gross spending summary (dollars)
The following table reconciles gross planned spending with net spending for 2022–23.
| Core responsibilities and internal services | 2022–23 actual gross spending | 2022–23 actual revenues netted against expenditures | 2022–23 actual net spending (authorities used) |
|---|---|---|---|
| Statistical information | 731,447,169 | -159,349,013 | 572,098,156 |
| Internal services | 110,581,024 | 0 | 110,581,024 |
| Total gross expenditures | 842,028,193 | -159,349,013 | 682,679,180 |
Statistics Canada generated $159 million in respendable revenue from the sale of statistical products and services.
Human resources
The "Human resources summary for core responsibilities and internal services" table presents the full-time equivalents (FTEs) allocated to each of Statistics Canada's core responsibilities and to internal services.
Human resources summary for core responsibilities and internal services
| Core responsibilities and internal services | 2020–21 actual full-time equivalents | 2021–22 actual full-time equivalents | 2022–23 planned full-time equivalents | 2022–23 actual full-time equivalents | 2023–24 planned full-time equivalents | 2024–25 planned full-time equivalents |
|---|---|---|---|---|---|---|
| Statistical information | 6,099 | 7,186 | 5,889 | 7,005 | 5,415 | 5,389 |
| Internal services | 684 | 713 | 659 | 833 | 610 | 584 |
| Total gross expenditures | 6,783 | 7,899 | 6,548 | 7,838 | 6,025 | 5,973 |
| Respendable revenue | -1,340 | -1,542 | -1,181 | -1,795 | -1,189 | -1,189 |
| Total net expenditures | 5,443 | 6,357 | 5,367 | 6,043 | 4,836 | 4,784 |
Similar to trends seen in planned spending, changes in full-time equivalents from year to year are largely explained by the cyclical nature of the Census Program. Activity peaked in 2021–22, when the 2021 Census of Population and 2021 Census of Agriculture were conducted, and decreases thereafter as these activities wind down. Funding for the 2026 Census of Population, the 2026 Census of Agriculture and the cloud is not reflected, amplifying the decrease in overall full-time equivalents in future years.
Expenditures by vote
For information on Statistics Canada's organizational voted and statutory expenditures, consult the Public Accounts of Canada.
Government of Canada spending and activities
Information on the alignment of Statistics Canada's spending with Government of Canada's spending and activities is available in GC InfoBase.
Financial statements and financial statements highlights
Financial statements
Statistics Canada's financial statements (unaudited) for the year ended March 31, 2023, are available on the department's website.
The agency uses the full accrual accounting method to prepare and present its annual financial statements, which are part of the departmental result reporting process. However, spending authorities presented in the previous sections of this report remain on an expenditure basis. A reconciliation between the bases of reporting is available in Note 3 of the financial statements.
Financial statement highlights
| Financial information | 2022–23 planned results | 2022–23 actual results | 2021–22 actual results | Difference (2022–23 actual results minus 2022–23 planned results) | Difference (2022– 23 actual results minus 2021–22 actual results) |
|---|---|---|---|---|---|
| Total expenses | 830,619,454 | 950,829,557 | 1,098,855,896 | 120,210,103 | -148,026,339 |
| Total revenues | 120,000,000 | 159,106,926 | 127,990,099 | 39,106,926 | 31,116,827 |
| Net cost of operations before government funding and transfers | 710,619,454 | 791,722,631 | 970,865,797 | 81,103,177 | -179,143,166 |
The 2022–23 planned results information is provided in Statistics Canada's Future-Oriented Statement of Operations and notes for 2022–23. The assumptions underlying the forecasts were made before the completion of the 2021–22 fiscal year.
The net cost of operations before government funding and transfers was $791.7 million, a decrease of $179.1 million (22.6%) from $970.9 million in 2021–22, mainly because of the decrease in expenses related to the cyclical nature of the 2021 Census Program, for which activities peaked in 2021–22.
Actual versus planned
The difference between actual and planned net costs for 2022–23 is $81.1 million (11.4%). Expenses were $120 million higher than anticipated. A large portion of the increase is attributable to additional cost-recovery work associated with extra demands following the slowdown during the pandemic and the 2021 Census. It is also attributable to funding that was carried forward or reprofiled from 2021–22, allowing the agency to meet the needs of its cyclical programs and to invest in its integrated strategic plans, technology, new data sources, cutting-edge statistical methods and frameworks. In addition, funding received from the fiscal framework for the ratification of certain collective agreements contributed. These elements contributed to additional employee benefit plan spending. The increases were partially offset by budget carried forward to 2023–24.
Revenues were $31.1 million higher than anticipated, mainly because of an increase in additional cost-recovery work associated with extra demands following the slowdown during the pandemic and the 2021 Census.
For more information on the distribution of expenses by program and type, see the two charts below.
Gross expenditures by core responsibility
Image
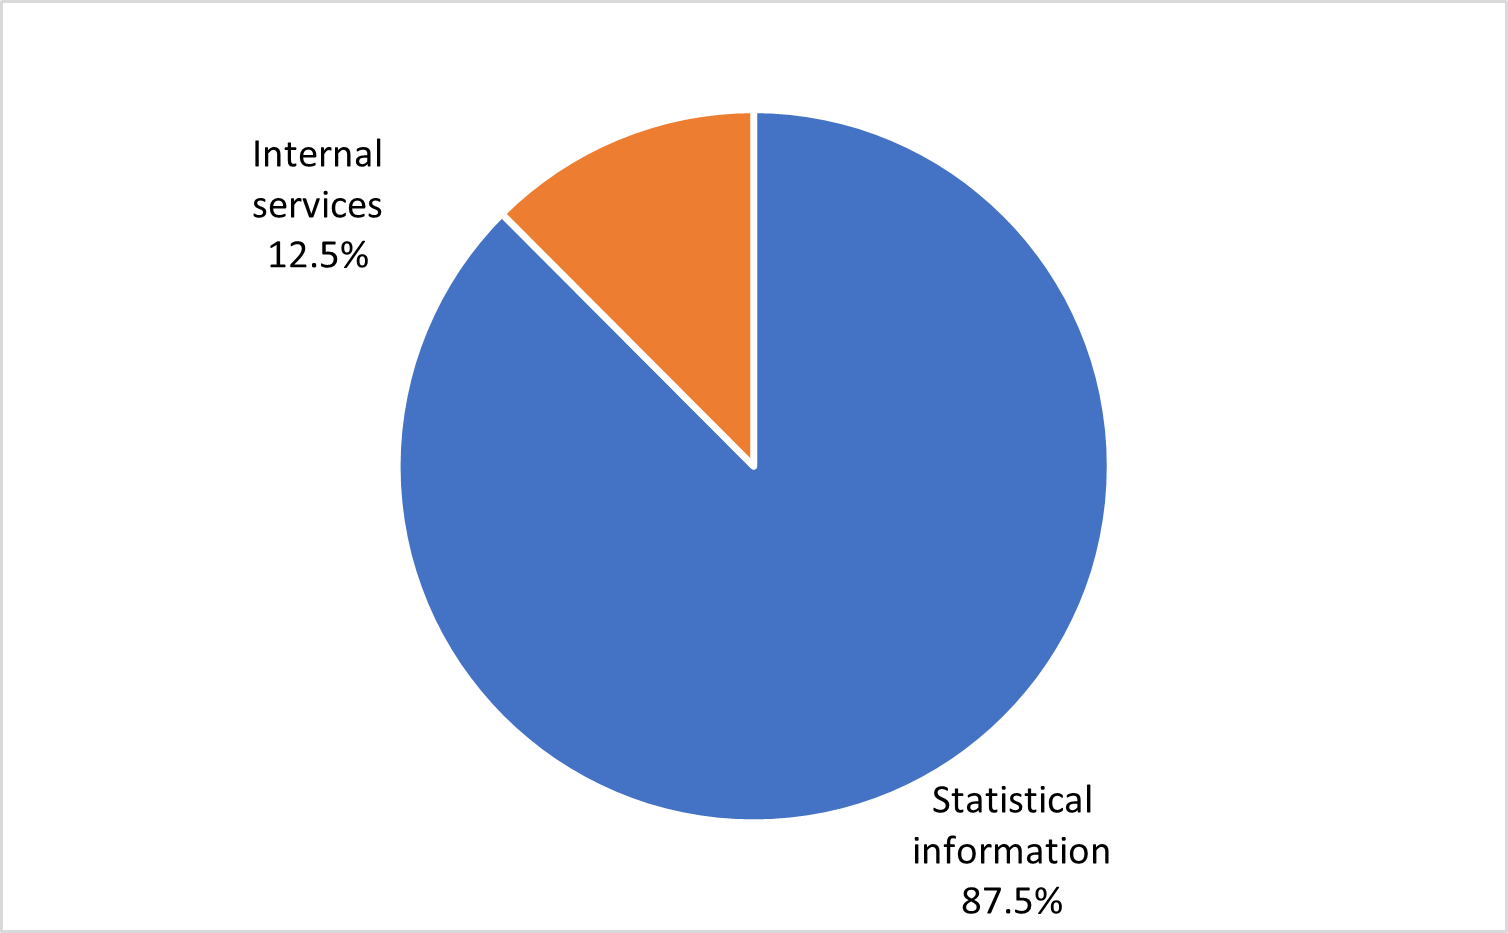
Total expenses, including services provided without charge by federal government departments, were $950.8 million in 2022–23. These expenses comprised $832.2 million (87.5%) for statistical information and $118.6 million (12.5%) for internal services.
Gross expenditures by type
Image
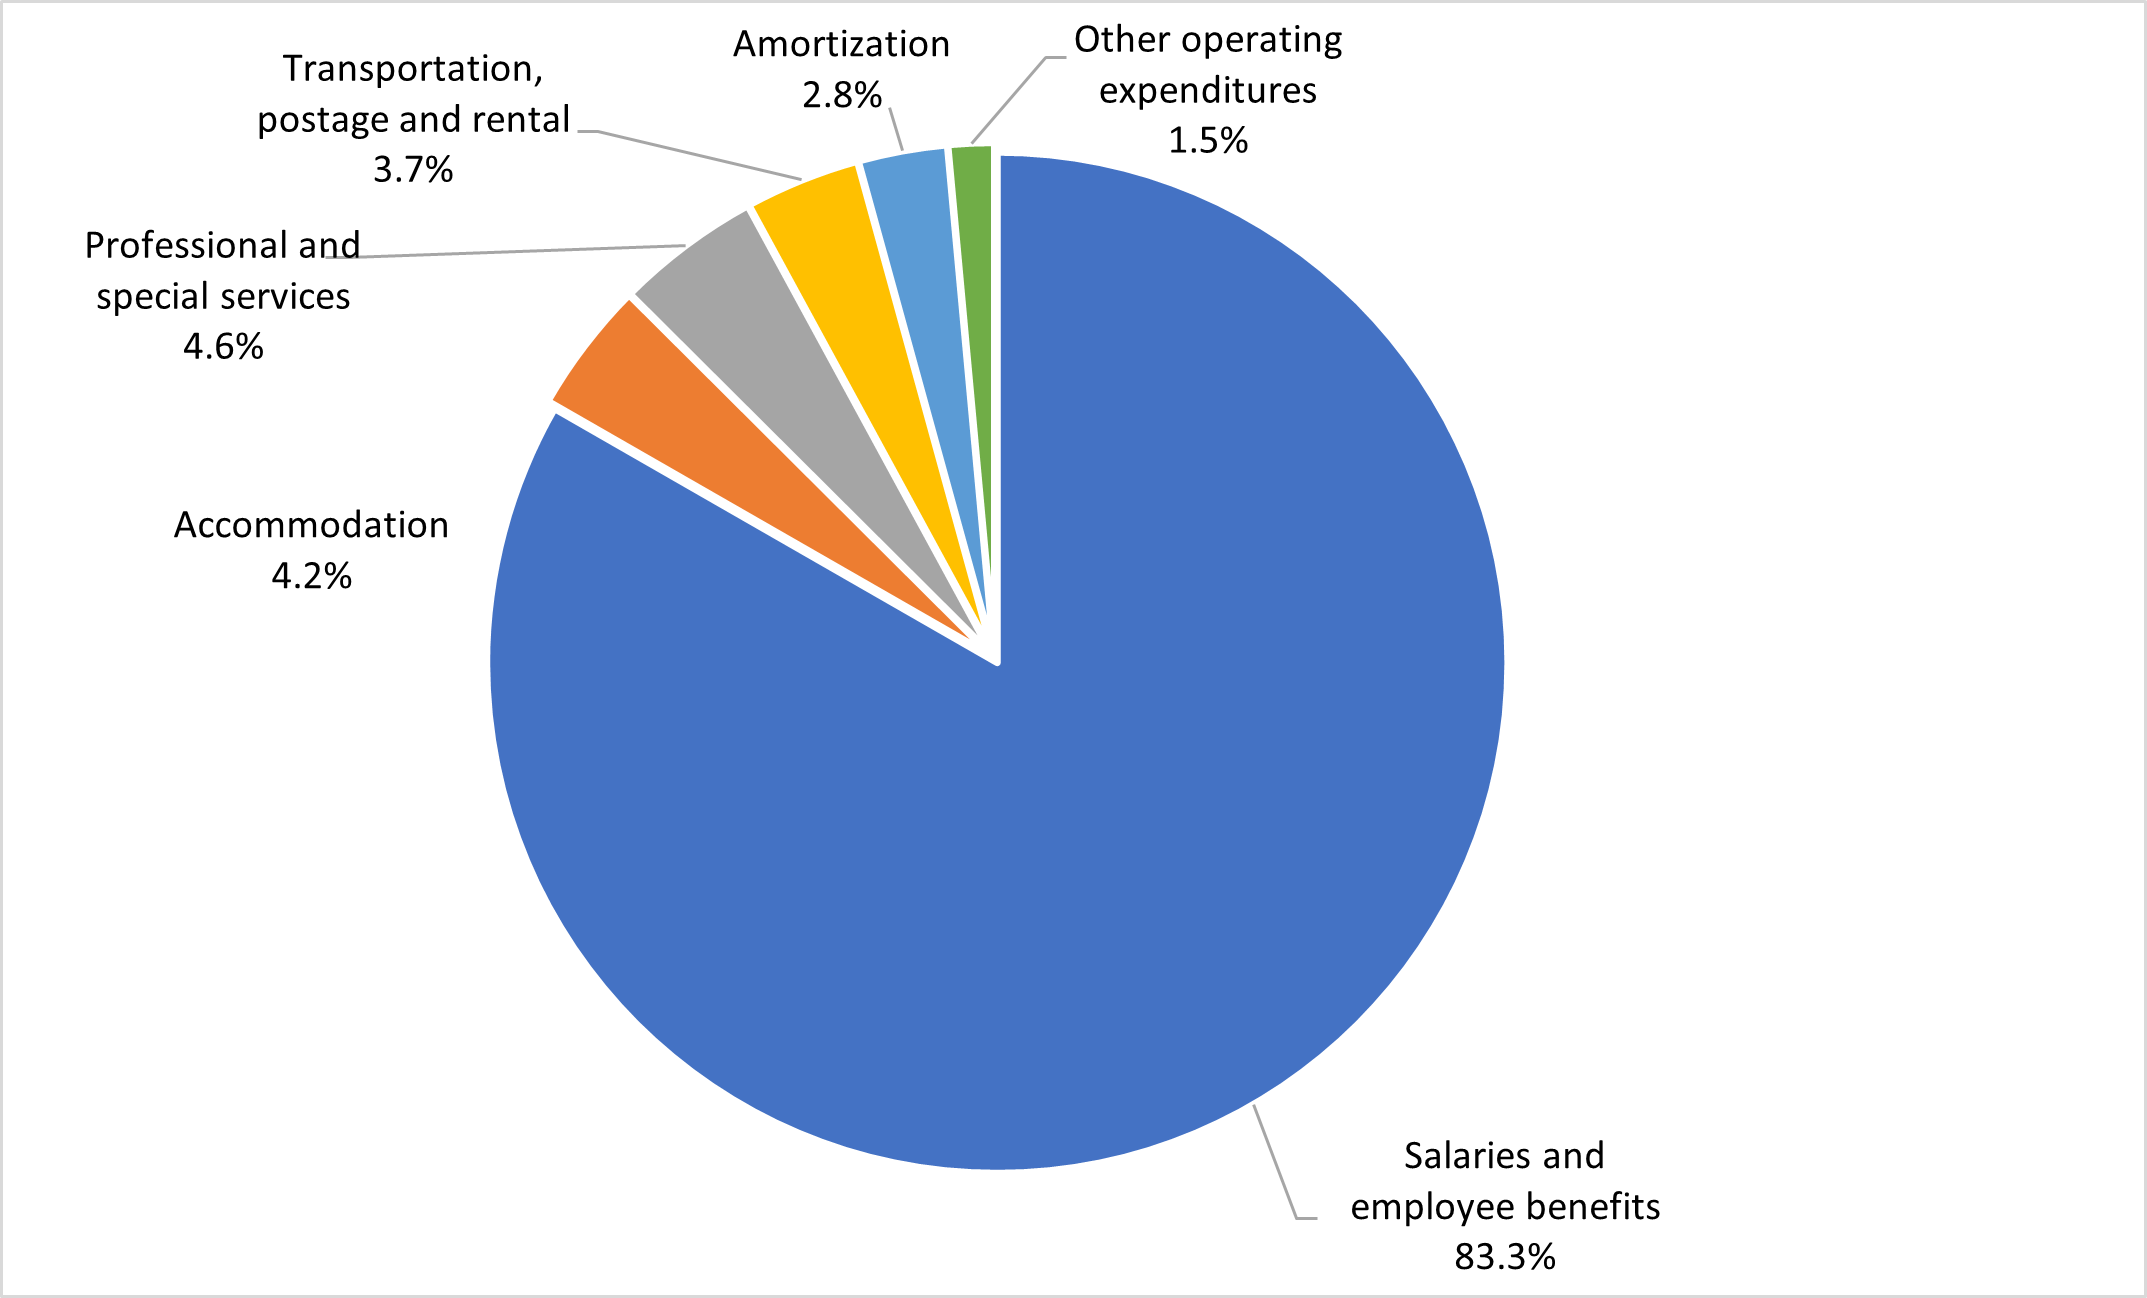
Statistics Canada spent $950.8 million in 2022–23. These expenses mainly comprised $792 million (83.3%) for salaries and employee benefits; $43.7 million (4.6%) for professional and special services; $39.7 million (4.2%) for accommodation; $34.8 million (3.7%) for transportation, postage and rental; and $26.8 million (2.8%) for amortization. Other operating expenditures comprised $13.8 million (1.5%) for communication and printing, repairs and maintenance, materials and supplies, etc.
| Financial information | 2022–23 | 2021–22 | Difference (2022–23 minus 2021–22) |
|---|---|---|---|
| Total net liabilities | 143,659,490 | 142,525,338 | 1,134,152 |
| Total net financial assets | 68,883,213 | 67,079,045 | 1,804,168 |
| Departmental net debt | 74,776,277 | 75,446,293 | -670,016 |
| Total non‑financial assets | 155,767,323 | 170,908,816 | -15,141,493 |
| Departmental net financial position | 80,991,046 | 95,462,523 | -14,471,477 |
The 2022–23 planned results information is provided in Statistics Canada's Future-Oriented Statement of Operations and notes for 2022–23. The departmental net financial position was $81 million at the end of 2022–23, a decrease of $14.5 million from $95.5 million in 2021–22.
Total net liabilities
The increase in total liabilities of $1.1 million is mainly attributable to an increase in accounts payable and accrued liabilities related to employer contributions to employee benefit plans and accrued salaries and wages, offset by a decrease in accounts payable to external parties, as well as a decrease in employee future benefits related to severance benefits.
Total net financial assets
The increase in total net financial assets of $1.8 million is mainly attributable to an increase in the amount due from the Consolidated Revenue Fund to discharge accounts payable and accrued liabilities. This is offset by a decrease in accounts receivable and advances.
Total non-financial assets
The decrease in total non-financial assets of $15.1 million is mainly attributable to a reduction in software acquisitions, an increase in write-offs and adjustments for internally developed software.
For more information on the distribution of the balances in the statement of financial position, see the two charts below.
Assets by type
Image
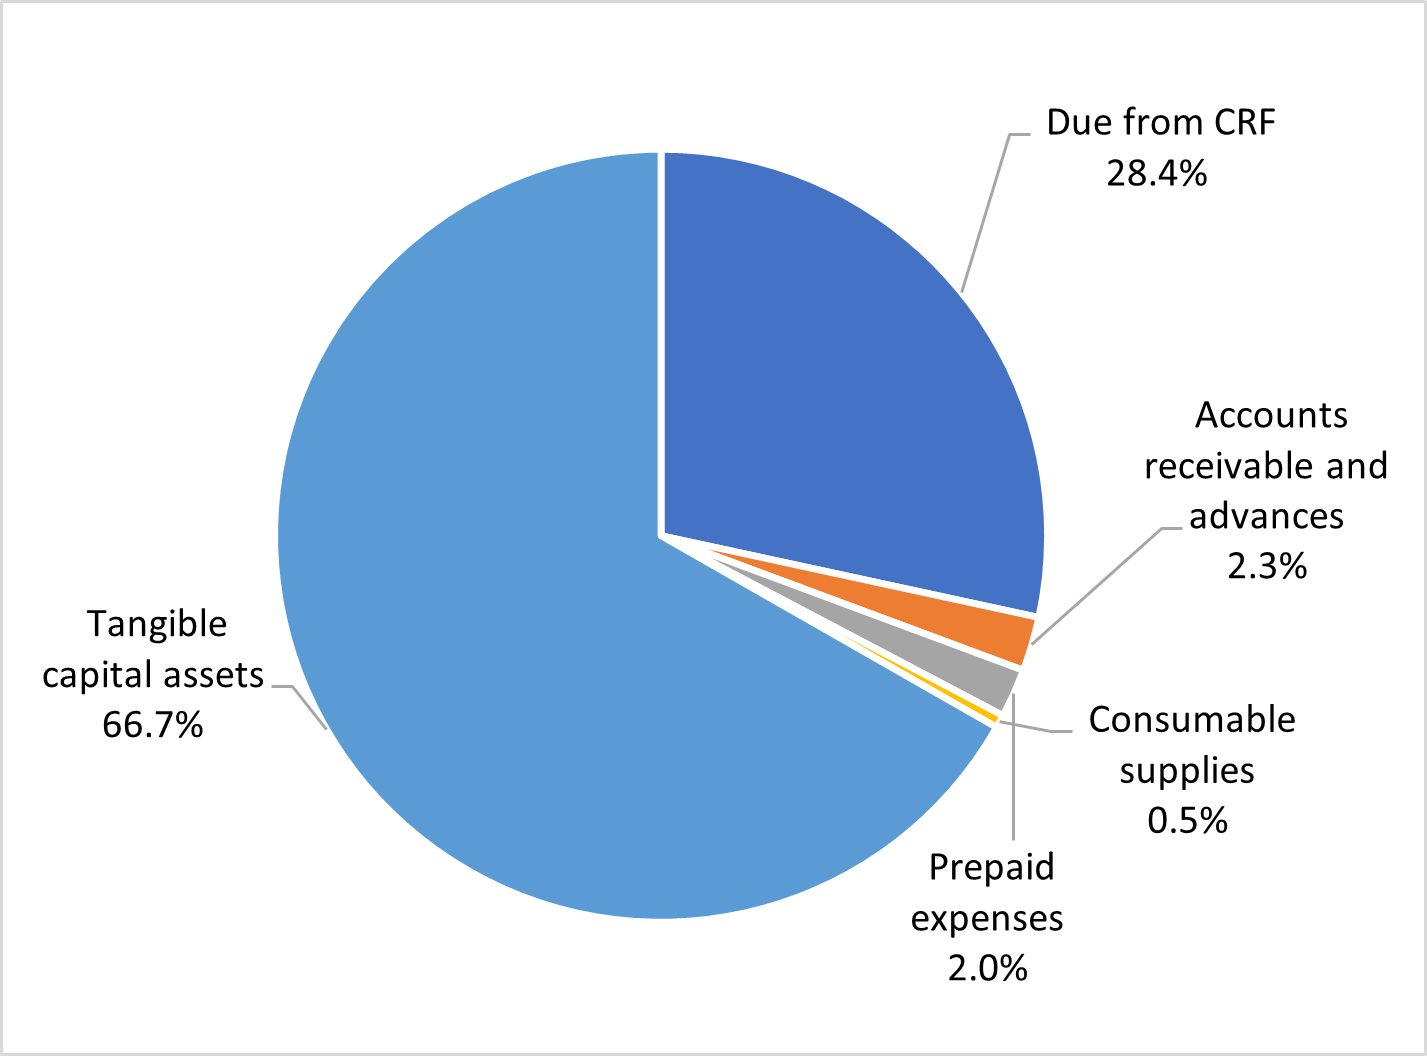
Total assets, including financial and non-financial assets, were $224.7 million at the end of 2022–23. Tangible capital assets represented the largest portion of assets, at $150 million (66.7%). They consisted of informatics software ($111 million), software under development ($24.4 million), leasehold improvements ($13.3 million) and other assets ($1.3 million). The remaining portion comprised $63.8 million (28.4%) for amounts due from the Consolidated Revenue Fund, $4.6 million (2.0%) for prepaid expenses, $5.1 million (2.3%) for accounts receivable and advances, and $1.2 million (0.5%) for consumable supplies.
Liabilities by type
Image
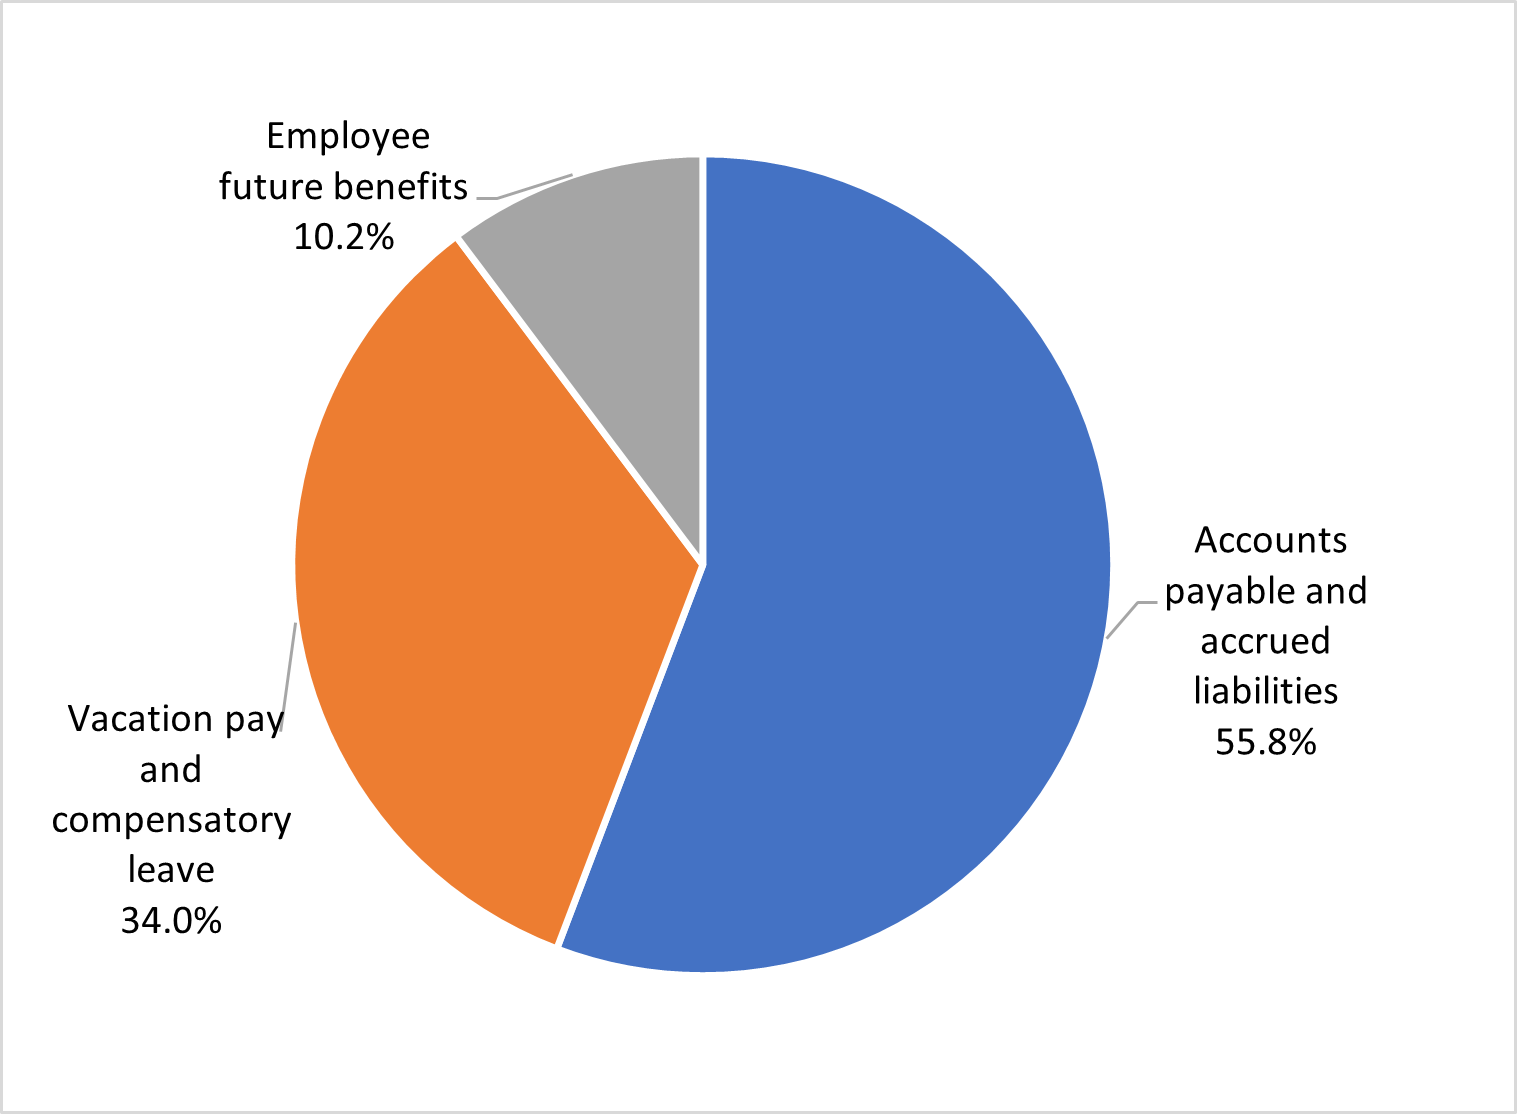
Total liabilities were $143.7 million at the end of 2022–23. Accounts payable and accrued liabilities made up the largest portion of liabilities, at $80.1 million (55.8%). They consisted of accounts payable to external parties ($24.1 million), accounts payable to other federal government departments and agencies ($18.5 million), and accrued salaries and wages ($37.5 million). The next-largest portion was vacation pay and compensatory leave, at $48.8 million (34.0%), while employee future benefits made up $14.8 million (10.2%).
Core responsibilities
Statistical Information
Description
Statistics Canada produces objective, high-quality statistical data for the whole of Canada. The statistical information produced relates to the commercial, industrial, financial, social, economic, environmental and general activities and conditions of the people of Canada.
Results
Canadians still count on trusted data and reliable insights, delivered in an accessible and modern way. Statistics Canada continued to provide relevant, timely and high-quality data that informed sound research, analysis and policies to benefit Canadians.
To keep meeting the need for high-quality data, the agency's multi-year modernization journey and its results are built on five guiding principles:
- providing user-centric services
- using leading-edge methods of data collection and integration
- building statistical capacity and fostering data literacy
- collaborating and engaging with partners
- building an agile workforce and workplace.
Image

Canadians value high-quality, efficient and responsive user-centric services, especially since the beginning of the COVID-19 pandemic. With increasing economic uncertainty, they seek data at the community and business levels. To ensure that Canadians have information when and how they need it, Statistics Canada has developed innovative ways to make data more inclusive and easier to access, share and use by
- disseminating results from the 2021 Census—a rich source of population data
- releasing data from the Census of Agriculture
- producing more disaggregated data for a fairer, more inclusive Canada
- developing better data for better outcomes
- producing business data to address lingering economic uncertainties
- further integrating social and business data
- meeting the evolving data needs of official language minority populations
- connecting with Canadians in a digital world
- building and maintaining public trust and understanding
- accelerating research through increased microdata access.
Disseminating results from the 2021 Census: A rich source of population data
- The 2021 Census provided the Government of Canada and all Canadians with a wealth of high-quality information, new and more granular data, products, and new metadata content. Over the past year, Statistics Canada proudly published seven themed major releases of 2021 Census data, with over 350 data tables and 30 analytical products, as well as visualization tools and infographics covering 18 major topics. This gave Canadians access to 31 billion data points—an unparalleled level of detail and insight.
- The agency provided federal briefings, media technical briefings, webinars and press conferences for each release and coordinated more than 150 media interviews. Five releases were covered live on national networks, social media campaigns reached 12.4 million impressions and 311,000 engagements, and more than 50,000 organizations and stakeholders were contacted through email campaigns for the various releases.
- The seven major census releases in 2022 were
- population and dwelling counts (February)
- age, sex at birth and gender; and type of dwelling (April)
- families, households and marital status; Canadian military experience; and income (July)
- language (August)
- Indigenous peoples, and housing (September)
- immigration, place of birth and citizenship; ethnocultural and religious diversity; and mobility and migration (October)
- education, labour, language of work, commuting, and instruction in the minority official language (November).
-
As of March 31, 2023, 1,801 custom census tables had been produced, a significantly higher number than the previous census cycle in 2017–18, in which 1,221 tables were produced. It is projected that 57,471,749,909 data cells will be released from the 2021 Census, compared with 27,596,576,636 for the 2016 Census. This means the agency released more data than ever before, allowing more details to be made available to Canadians and organizations for their future planning needs.
In April 2022, Statistics Canada's Census Communications team was recognized at the Government of Canada Communications Awards of Excellence for its outstanding work on the 2021 Census. The team received the Diamond Award of Communications Excellence.
- The range of topics and granularity of the 2021 Census of Population also went further than ever before. For the first time, the census collected data on gender, making Canada the first country in the world to disseminate census data on transgender and non-binary people. The 2021 Census also provided the first census profile of Canada's military in half a century and new data on children eligible for instruction in the minority official language at the primary and secondary levels.
Releasing data from the Census of Agriculture
Image
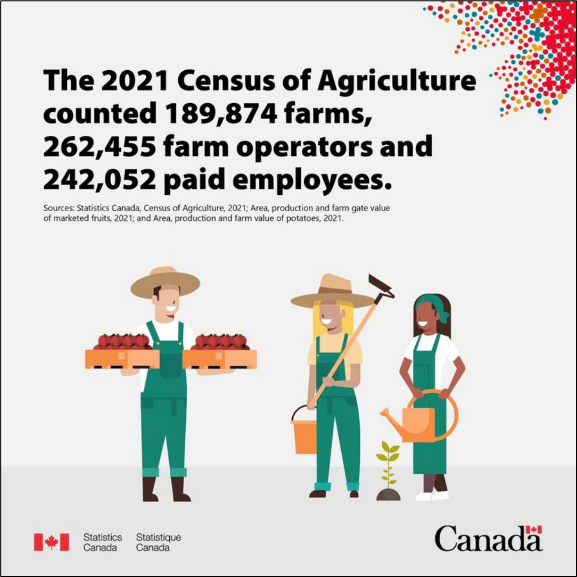
Description - 2021 Census of Agriculture data
The 2021 Census of Agriculture counted 189,874 farms, 262,455 farm operators and 242,052 paid employees.
Source: Statistics Canada, Census of Agriculture 2021; Area, production and farm gate valye of marketed fruits, 2021; and Area, production and farm values of potatoes, 2021.
- The 2021 Census of Agriculture included new ways to access and visualize data, such as a new mapping tool. It also included new community profiles and a variety of data tables, analytical products and reference materials on the characteristics of Canada's agriculture industry. In 2022, Statistics Canada released multiple products associated with the 2021 Census of Agriculture that were well received by Canadians, including
- Common Output Data Repository tables
- special tabulations
- new dissemination tools
- multiple analytical reports in Canadian Agriculture at a Glance.
- The Census of Agriculture also resulted in a new partnership with the Canadian Agri-Food Policy Institute related to how the results align with major trends in the agriculture industry, to gain a better understanding of the industry.
- For the first time, the 2021 and 2016 microdata were also made available in the Statistics Canada research data centres; this was beneficial to key researchers and partners.
Producing more disaggregated data for a fairer, more inclusive Canada
"Statistics Canada will continue implementing its Disaggregated Data Action Plan and integrating the richness of 2021 Census data into more of its programs."
Anil Arora
Chief Statistician of Canada
- Statistics Canada continued to develop rigorous disaggregated research and analysis to enable Canadians to deepen their understanding of equity, diversity and the inclusion of various groups. The agency used a variety of dissemination products, including flagship publications, infographics and the Research to Insights series, to communicate findings to Canadians.
- Statistics Canada's work on the DDAP continued to help critically examine the experiences of various population groups, with a focus on the four employment equity groups: Indigenous people, women, racialized populations and people with disabilities. As a driver of change, the agency's work on the DDAP helped Canada develop policies and promote evidence-based decision making, accounting for the experiences of diverse population groups in Canada.
-
The Gender, Diversity and Inclusion Statistics Hub released several high-quality research and analytical products, to increase knowledge and report to Canadians on the state and progress of gender equality and the experiences and outcomes of various groups of people in Canada. It also facilitated access to disaggregated data, intersectional analysis and insights on diverse population groups. The updated hub includes features such as a data visualization tool. It also makes new releases easier to access for all Canadians, increases engagement and allows users to see data in a more dynamic way.Image

- As part of Canada's Anti-Racism Strategy, Statistics Canada created a new Social Inclusion portal to bring together key statistical information on the inclusion (or exclusion) of ethnocultural groups and immigrants in Canada. The agency also launched a new series of data visualization tools, and over 120 social inclusion indicators were presented for racialized groups in Canada, disaggregated by key sociodemographic characteristics and level of geography.
- The agency created the DDAP Administrative Data Fund to give external partners the opportunity to make changes that, in turn, will provide the agency with enhanced administrative data. This will help optimize the implementation of the DDAP and leverage existing data by making them available in a clearer and more accessible way to Canadians.
- Statistics Canada published an analysis of disaggregated data in Insights on Canadian Society. Its goal was to build understanding and awareness of persistent socioeconomic inequalities in various vulnerable groups and to examine how outcomes vary by racialized population, gender, disability status and Indigenous identity, including intersections of these identities.
-
Statistics Canada also successfully completed data collection for the Indigenous Peoples Survey. Data scheduled for release in August 2024 will provide rich information and fill data gaps for First Nations people living off reserve, Métis and Inuit. The survey will provide detailed information on several topics, including education, employment, health, access to services, language, housing and mobility.Image

Description - 2022 Indigenous Peoples Survey
2022 Indigenous Peoples Survey
If you have been selected, please participate.
Themes covered in this survey
- Child care and services
- Indigenous languages and cultural activities
- Mental and physical health
- Education
- Skills, training and relevant experience
- Interest in government employment
- The agency also successfully delivered on nine cost-recovery Indigenous research projects with federal partners and released statistics on Indigenous peoples from the 2021 Census.
- With the completion of the 2022 Canadian Survey on Disability, Statistics Canada met its commitment to collect information from youth and adults in Canada whose everyday activities are limited because of a long-term condition or health-related problem. The data will be used to plan and evaluate services, programs and policies for Canadians living with disabilities to help enable their full participation in society.
Developing better data for better outcomes
Image

Description - COVID-19 antibodies
From April to August 2022, 98.1% of Canadian adults were shown to have COVID-19 antibodies acquired through vaccination, a previous infection or both.
Source: Statistics Canada, Canadian COVID-19 Antibody and Health Survey, Cycle 2.
- Statistics Canada, in partnership with the Public Health Agency of Canada and the COVID-19 Immunity Task Force, conducted the second cycle of its Canadian COVID-19 Antibody and Health Survey. This survey is designed to help evaluate the health status of Canadians associated with the COVID-19 pandemic. Data were collected from April to October 2022 and provided Canadians with important information about testing practices, rates of past and current infections, awareness of infections, and the prevalence of long-term symptoms among the Canadian population.
- To support the Government of Canada's zero plastic waste agenda, Statistics Canada developed a pilot physical flow account for plastic material. The first release of these data was in March 2022, and updates were made available in March 2023. This project represents one of the first environmental accounts that estimates the flow of plastics through the Canadian economy and will help to inform policy development by providing increasingly accurate statistics. It has already resulted in the development of new approaches for collecting physical flow accounts. It is a key input for partners such as Environment and Climate Change Canada to develop and implement plastics indicators and to contribute to assessing and reporting on the state of plastics and plastic pollution in Canada.
-
After implementing the Quality of Life Framework for Canada in 2021, Statistics Canada developed indicator definitions and products in 2022–23. This work, done in collaboration with several federal partners, including the Treasury Board of Canada Secretariat, the Department of Finance, Environment and Climate Change Canada, and many others, will facilitate more holistic and horizontal evaluations of the well-being of Canadians. Launched in March 2022, the Quality of Life Hub is a one-stop shop for data on the quality of life of people living in Canada, designed to assist policy makers involved in supporting budgeting and decision making. The hub presents the most recent quality of life data and metadata in a non-technical way that is easily accessible for a wide range of users across the data literacy spectrum.Image
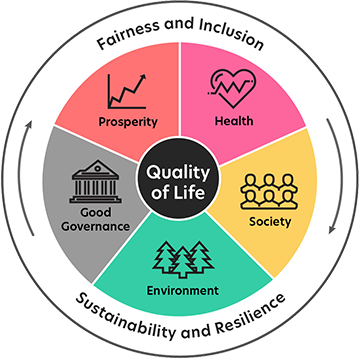
Description - Quality of life identifier
This image illustrates the Quality of Life Framework for Canada. It is represented as a circular graphic with the term "Quality of Life" in a circle at its centre. The circular graphic is divided into five segments which represent each of the five domains of the framework: Prosperity, Health, Society, Environment, and Good Governance. The two lenses of the framework, Fairness and Inclusion and Sustainability and Resilience, encircle the image, represented by curved arrows.
- The infographic Hopefulness in Canada illustrated the insights made possible by the Quality of Life Framework (and the new Canadian Social Survey, which collects quarterly data for many quality of life indicators). It examined how hopeful different segments of the Canadian population—including people with disabilities and the LGBTQ2+ population—generally felt about the future.
Producing business data to address lingering economic uncertainties
- To ensure that Canadians have a full and accurate portrait of labour market conditions, the agency launched the Quality of Employment in Canada publication, through the Labour Force Survey (LFS) supplements program. It aims to fill data gaps on quality of employment and other emerging labour market topics to provide Canadians and organizations with a better understanding of employment characteristics in Canada.
-
The agency increased the sample size of the LFS by 25%. As a result, Canadians have a fuller portrait of labour market conditions, including more detailed information on the labour market experiences of diverse groups, including Indigenous people and racialized people. To better quantify impacts on quality of life, the agency developed and integrated new questions to measure Black and Indigenous business ownership.Image
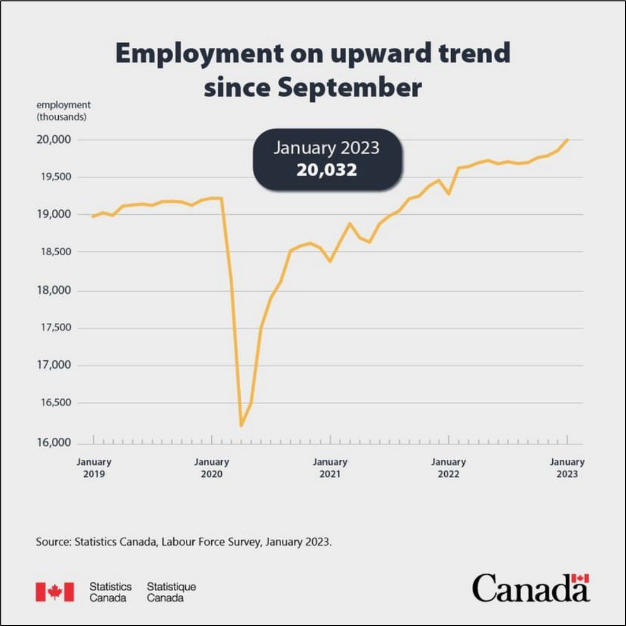
Description - Employment in Canada, January 2019 - January 2023
Employment on upward trend since September
January 2023, 20,032
For employment data for January 2019 to January 2023, please see Chart 1 Employment on upward trend since September of Labour Force Survey, January 2023.
- The LFS was also leveraged to provide insights on ongoing adjustments and structural changes following the COVID-19 pandemic, including labour market churn and wage adjustments in the context of a tight labour market and record-high inflationary pressures. In addition, Statistics Canada updated the Canadian Patent Research Database and made new linkages, such as the Intergenerational Income Database and census linkage, available in research data centres. Statistics Canada consulted and engaged with internal and external partners to identify themes and topics for forthcoming data collection, including the LFS supplements program.
- The agency recognized the increasing need of Canadians for timely information as the business community faced several challenges during the COVID-19 pandemic, including with global supply chains, inflation and labour shortages. As a result, Statistics Canada developed the Canadian Survey on Business Conditions. Not only are indicators about these challenges from this survey disseminated on a quarterly basis, but significant portions of the survey content are modified to meet the evolving needs of key stakeholders.
Further integrating social and business data
- In a time of rapid social and economic changes, Canadians saw value in having access to more integrated social and business data.
-
The Longitudinal Business Database was launched, improving the way the agency tracks the lifecycle of businesses. It provides a foundation to produce better and more coherent information about how businesses are doing, what makes them succeed and the extent to which business ownership is diversifying.Image
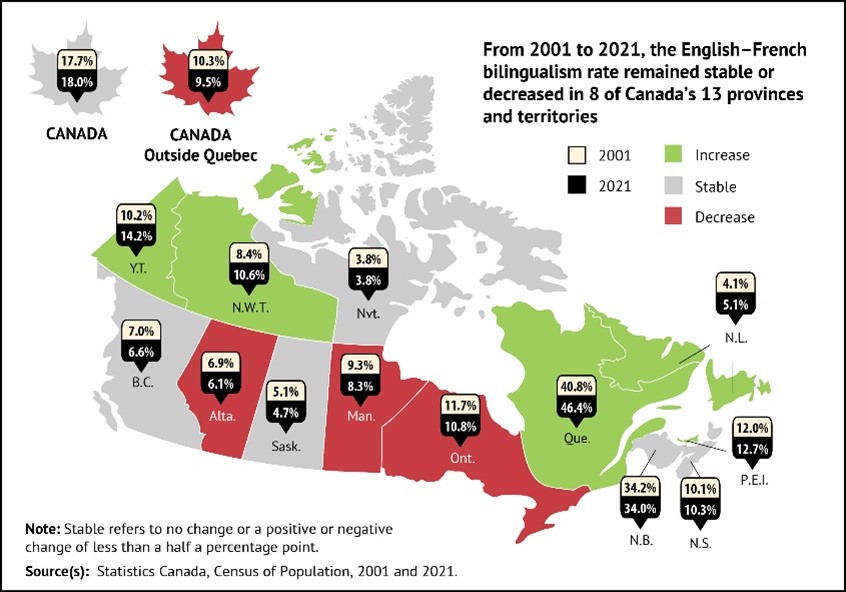
Description - English-French bilingualism rate
From 2001 to 2021, the English–French bilingualism rate remained stable or decreased in 8 of Canada's 13 provinces and territories.
English–French bilingualism rate Rate of bilingualism in both official languages 2001 2021 Change from 2001 to 2021 Canada 17.7 18.0 Stable Canada outside Quebec 10.3 9.5 Decrease Newfoundland and Labrador 4.1 5.1 Increase Prince Edward Island 12.0 12.7 Increase Nova Scotia 10.1 10.3 Stable New Brunswick 34.2 34.0 Stable Quebec 40.8 46.4 Increase Ontario 11.7 10.8 Decrease Manitoba 9.3 8.3 Decrease Saskatchewan 5.1 4.7 Stable Alberta 6.9 6.1 Decrease British Columbia 7.0 6.6 Stable Yukon 10.2 14.2 Increase Northwest Territories 8.4 10.6 Increase Nunavut 3.8 3.8 Stable Note: Stable refers to no change or a positive or negative change of less than a half a percentage point.
Sources: Statistics Canada, Census of Population, 2001 and 2021. - Statistics Canada developed a statistical geomatics vision to give Canadians additional geolocated insights on the environment, society and the economy. Integrating data by geography provides communities with the information they need to make better decisions and allows statistical and geospatial data to be used efficiently. It also enables key internal and external partnerships to be developed in geomatics, ensuring that Statistics Canada continues to be a trusted leader for Canadians in the field of statistical geomatics and geoanalytics.
Meeting the evolving data needs of official language minority populations
- To provide Canadians with evidence-based data on themes affecting official language minority populations, Statistics Canada developed the Survey on the Official Language Minority Population. It was conducted from May to December 2022 in close collaboration with Canadian Heritage. The survey fills data gaps and measures changes in the circumstances of official language minority populations since 2006, when the last similar survey was conducted. The results are scheduled for release in 2024.
- Statistics Canada redesigned the Language Statistics portal in 2022–23 to serve as a one-stop shop for key users of the agency's language data. It provides members of official language minority communities across the country with easy access to a range of data at various geographic levels and on multiple language-related themes. Researchers, academics, government officials and other Canadians can also find a variety of products on languages in Canada.
- In addition, Statistics Canada carried out external outreach and training activities through webinars and other capacity-building activities. For example, as part of its 2021 Census webinar series, Statistics Canada organized two language-specific events open to the public. These provided important information on concepts and definitions; national, provincial and territorial highlights; and guidance on how to access data products and online resources. The Language Statistics Program also actively promoted all analytical products to partners and data users so they could benefit from these data.
Connecting with Canadians in a digital world
Introduced in January 2022, the StatsCAN app is another way the agency has modernized the way data are published. This free mobile application provides trusted, unbiased facts, visuals and key information on demand. It reached over 11,000 downloads within the first year of its launch, enabling users to stay on top of the country's latest statistical news any time they want.
- As Canada's national statistical agency, Statistics Canada needs to remain relevant and reach Canadians with the valuable data they need, in ways that are interesting, informative and easily digestible. To ensure that statistical information reaches more Canadians in more ways, the agency disseminated its products in various media.
-
The agency's Eh Sayers podcast continued into its second year and remained dedicated to meeting the people behind the data and exploring the stories behind the numbers. Eh Sayers reached the top spot in Canada on the Apple Podcasts Government chart, beating out the BBC, The Financial Times, CBS News and the Lincoln Project in 2022. Eh Sayers was highlighted in the 29th Annual Report to the Prime Minister on the Public Service of Canada as an example of innovation and the power of using new storytelling tools to reach Canadians.Image

- StatsCAN Plus, the agency's second official release vehicle, alongside The Daily, continued to ensure that Canadians were on top of the country's statistical news throughout the day. Its short stories cover a wide range of topics of interest to Canadians. In 2022, more than 250 stories were published, which received over 100,000 visits.
- Statistics Canada advanced the Connecting with Canadians: Publishing Strategy to evolve and modernize the way in which it communicates with Canadians. Under the strategy, the agency continued to adapt its publishing model to meet the changing needs and behaviours of Canadians and ensure they are getting the data they need, in a timely and flexible manner that suits them.
- An innovative communications campaign was launched to promote the 2021 Census of Population and Census of Agriculture data releases not only to regular users, but also to the public, schools, universities, libraries, non-profit organizations, businesses and municipalities. The campaign's reach was further extended through collaborations with federal partners, statistical organizations and social media influencers. Various tools, such as an interactive census game, school and community supporter toolkits, lifestyle articles, webinars, and events, were used to present informative and engaging data insights.
Building and maintaining public trust and understanding
Image
- Statistics Canada's Trust Centre remained an important focus. It aims to increase the transparency of the agency and maintain and consolidate the relationship of trust it has with Canadians, and it is continuously maintained and kept up to date. By providing information on data collection and use, privacy, and more, the Trust Centre is a useful tool for survey respondents, data providers and the media, who can find answers to their questions or concerns on the platform.
Accelerating research through increased microdata access
- Statistics Canada and the Canadian Chamber of Commerce established the Business Data Lab (BDL) to put data to work for Canadian businesses and help them tap into the agency's wealth of economic data. The BDL hosts multiple sources of data on a secure platform to generate important information and provide access to it for businesses and policy makers. Additional tools will be developed for the BDL to closely monitor economic activity as the business community continues to recover from the impacts of the pandemic and new economic uncertainties.
- Leveraging the BDL and its partnership with the Canadian Chamber of Commerce, Statistics Canada recognized the importance of increasing access to microdata. Thanks to this unique partnership, the chamber recently released a new suite of dashboards, called the Business Conditions Terminal, where users can find detailed insights on business activity taking place in major Canadian cities since the beginning of the COVID-19 pandemic.
Image

To respond to the increasing need for integrated analysis and insights in a fast-changing world, Statistics Canada continued to leverage its expertise in these areas to ensure that it remained a world-leading agency producing data that Canadians can trust. Statistics Canada integrated data from multiple sources on society, the economy and the environment to develop a better understanding of the complexity of modern-day Canada. The agency worked toward this goal through these initiatives:
- modernizing survey collection methods
- streamlining business processes
- preparing for the 2026 Census
- maintaining world-class frameworks and practices for privacy, data ethics and data stewardship
- increasing capabilities to turn data into insights
- using data to support the recovery of the tourism sector
- monitoring a highly fluid economy with real-time estimates
- leading the development of the world's first Census of Environment
- monitoring sudden shifts in business conditions.
Modernizing survey collection methods
- As part of the ongoing AgZero initiative, Statistics Canada minimized response burden on farmers by replacing survey data typically collected by the Agriculture Statistics Program with data obtained using alternative methods. The initiative also leveraged data and advanced technologies such as Earth observation and machine learning. In 2022–23, the agency successfully replaced a field crop survey that traditionally involved 11,500 farmers. This new approach uses alternative sources and modelling techniques to deliver the same high-quality information while reducing the number of surveys crop farmers need to complete. Additionally, through a partnership with the Canadian Pork Council, AgZero used PigTRACE data to generate reports on interprovincial hog movements without directly contacting farmers.
Streamlining business processes
- The agency continued to optimize and harmonize the process flows, concepts and classifications used to produce the Canadian System of Macroeconomic Accounts (CSMA), while strengthening and modernizing the information technology (IT) infrastructure required for current and future efforts. This will improve data sharing through harmonization and data system interoperability with international statistical organizations.
- In 2022‒23, the agency worked to enhance the catalogue of data available under the Statistical Data and Metadata Exchange (SDMX), an international initiative that aims to improve the exchange of data between organizational units, other government departments and international partners. The initiative introduced a preliminary Canadian System of National Accounts Data Structure Definition under the SDMX framework, with standardized classifications to be used as building blocks for future development. Also, through this initiative, the initial IT platform was deployed, and two CSMA program components were recreated as prototypes in the new environment.
Preparing for the 2026 Census
- As planning begins for the 2026 Census of Population, Statistics Canada identified responsible and innovative ways to reuse information that Canadians have already provided. This will help increase efficiency and time savings for both the agency and Canadians.
- To meet ever-increasing needs for varied and detailed data while enabling the efficient use of cloud services and the robust protection of Canadians' private information, a new internal service—the Statistical Building Register—was implemented. It replaces the existing Address Register, which successfully supported census collection for 30 years. The updated register will be a central data infrastructure tool for the 2026 Census.
- Statistics Canada engages in a formal consultation process at the start of each census cycle, when it invites data users, stakeholders and the public to provide feedback on what information they use, for what purpose they use it, and whether there are emerging data needs that the agency should consider addressing in the next census cycle. This allows Canadians to have a hand in how the agency supports them.
- The agency held hybrid consultation sessions with partners from all levels of government, as well as key census data users, who also received an electronic questionnaire.
- Over a three-month period, Statistics Canada engaged 24 federal departments and stakeholders in consultations. This led to almost 3,000 responses, an improvement from the previous cycle.
Maintaining world-class frameworks and practices for privacy, data ethics and data stewardship
- In keeping with principles outlined in Canada's Digital Charter, Statistics Canada fully implemented its data ethics frameworks and continued to look for ways to strengthen them in light of international developments in an ever-changing digital world. The agency is a world-class leader with state-of-the-art approaches, and it partnered with other countries. For instance, it worked with the United Kingdom to produce an in-depth review on data ethics for the United Nations Economic Commission for Europe (UNECE).
- Statistics Canada was a key partner in renewing the Data Strategy for the Federal Public Service, along with the Privy Council Office and the Treasury Board of Canada Secretariat. Launched in spring 2023, this strategy keeps pace with evolving digital and data environments by improving data management across the federal government to better deliver programs and services to Canadians. Statistics Canada's data stewardship practices were key to establishing government-wide priorities within the strategy, including tangible actions such as the adoption of data standards for federal organizations to implement over the next three years.
Increasing capabilities to turn data into insights
Image

Description - Inflation in Canada
What sector is causing the most inflation in Canada?
Three components of the CPI are contributing the most to consumer inflation:
- Shelter
- Food
- Transportation
- Statistics Canada expanded its data science and data modelling capabilities to better position itself for the high-value work of producing not only data, but also data-driven insights.
- Statistics Canada integrated high-frequency data into the development of models for producing leading economic indicators. For example, the Consumer Price Index (CPI) began annual basket updates in 2022. As Canada faced its highest inflationary period in nearly four decades, having the highest-quality inflation measures was paramount. The updates to the basket items and weights allowed the CPI to more accurately reflect the latest relative importance of the goods and services purchased by Canadians. Frequent basket updates—an internationally recognized best practice—are important to ensure the CPI can respond quickly to changes in consumer behaviours and preferences.
- Statistics Canada developed a microsimulation and modelling program that enables an analysis of the impacts of potential socioeconomic changes and provides enhanced insights on trends. For example, the program gives experts and decision makers information about the impacts of health prevention strategies on chronic conditions, as well as about the economic implications of different policies on retirement and pensions.
- The agency is proud of the successful delivery of the Data Analytics as a Service platform, after five years of dedicated efforts. This cloud-based platform has 864 current users and is revolutionizing the way data scientists and researchers use and share statistical information securely. The agency also continued to expand partnerships across the federal government to enhance and support secure, data-enabled policies to deliver services for Canadians.
- The platform supported key projects at the agency, such as the BDL, as well as the Canadian COVID-19 Antibody and Health Survey, developed in collaboration with the Public Health Agency of Canada, to analyze survey data and prepare releases.
Using data to support the recovery of the tourism sector
- To help the tourism sector recover from the effects of the pandemic, Statistics Canada relied less on survey-based data and focused more on broadening the use of administrative data. This produced more timely snapshots of the industry, resulting in better, real-time data to improve evidence-based decision making. An example is the Canadian Tourism Activity Tracker, which is continually being refined to provide a detailed, up-to-date picture of how the sector is evolving beyond the pandemic, allowing Canadians to adapt and adjust.
- The agency also developed the Frontier Counts: Interactive Dashboard through the International Travel Survey to provide counts of entries by international travellers at Canadian ports of entry. The dashboard was launched in March 2023 and displays current and historical data on the number of border crossings in an interactive and customizable format that includes only those travelling for tourism-related purposes. Updated twice per month, it includes four visualizations: a leading indicator of air arrivals, a leading indicator of land arrivals, returning Canadians and visitors to Canada. This dashboard allows more data about the travel and tourism sector to reach Canadians more quickly, for better planning.
Monitoring a highly fluid economy with real-time estimates
- To monitor the impact of government pandemic-relief benefits on low-income families, the agency produced experimental weekly income estimates, providing timely updates on the evolution of family income.
- The Canadian Social Environment Typology, an example of these releases, is a new tool to help measure health and social inequalities in Canada. It provides neighbourhood classifications based on combinations of 30 socioeconomic, demographic and ethnocultural variables, and each neighbourhood type is a group of census dissemination areas with similar social characteristics. This information can be used to measure health and social inequalities by comparing outcomes with those in other types of neighbourhoods within the same city or in other cities in Canada.
- Another example of the benefit of real-time estimates is the release of information through the DDAP on how different population groups—notably, racialized and low-income populations—have been impacted by the pandemic in significantly different ways. The analytical article COVID-19 mortality among racialized populations in Canada and its association with income looks at COVID-19 mortality among racialized populations, and then further disaggregates it by income within these populations.
Leading the development of the world's first Census of Environment
Image

- Statistics Canada is responding to Canadians' increasing concerns about the economic, social and health risks to communities because of climate change.
- The agency is leading the development of the world's first Census of Environment, which aims to improve Canadians' knowledge about the country's ecosystems, monitor related trends in ecosystems and promote better decision making as a means of improving how Canada responds to global environmental challenges.
- Results began to be released in January 2022. Statistics Canada published several in-depth reviews, including on ecosystem changes, ocean and coastal ecosystem extent, and protected and conserved ocean and coastal ecosystems. New data on salt marshes were also released, along with a framework to track their presence, health and services over time.
- Biodiversity degradation is a key priority for government action. Meeting this complex challenge requires measuring and integrating environmental, social and economic data to inform a range of important investment and policy decisions across the country.
- This ongoing program will deliver a full picture of the complex relationship between ecosystems and the economy, society and human well-being through mapping, tracking and analyzing these areas.
- The agency also released updated time-series data on urban greenness for over 1,000 populated places in Canada. Several other releases are planned for coming years.
- In addition to releasing new data products, the agency engaged with the Canadian public on ecosystem priorities for the Census of Environment. The data collected were used to determine the 2023–24 priorities. The agency also organized engagement activities with experts on specific environmental topics, such as wetlands and salt marshes, which will help guide and improve future work in the Census of Environment program.
Monitoring sudden shifts in business conditions
- The pandemic has highlighted the need to improve the timeliness of statistics to monitor sudden shifts in economic activity. The Real-time Local Business Conditions Index was launched to provide experimental statistics on a weekly basis and track local economic recovery throughout the pandemic. Currently, it serves more than 860 users.
- Through an established partnership with the Canadian Chamber of Commerce, and by using the BDL, Statistics Canada was able to expand the index. It now serves as a signal on the economic conditions of 30 metropolitan areas across Canada by integrating Statistics Canada data with real-time data from alternative sources on business openings and closures and road traffic flows in the commercial areas of each population centre. Consultations with users indicated that the index is tracking major shocks (natural disasters, protests, public health restrictions, etc.) that affect business conditions at the local level in near real time.
Image

In 2022–23, Statistics Canada worked on new ways to present data that are more compelling and accessible to Canadians, supporting evidence-based decision making at every level in a rapidly changing world. Activities included
- strengthening the statistical system
- adapting to the digital world
- measuring sustainable development
- harnessing data to support Indigenous self-determination
- leveraging new approaches and technologies
- fostering data literacy to encourage evidence-based decision making.
Strengthening the statistical system
- The agency continued to evolve, grow and innovate the national statistical system, with the support of advisory groups such as the Canadian Statistics Advisory Council. The council's recommendations—including the ones contained in its latest annual report, Trust, Governance and Data Flows in the National Statistical System help Statistics Canada achieve its primary goal of ensuring that Canadians and governments continue to have access to a trusted source of statistics, while preserving privacy and confidentiality. As a result, Canadians have better access to data, provided in a modern, ethical and responsible way.
Adapting to the digital world
- In alignment with its modernization vision, Statistics Canada leveraged the opportunity to work with the workload migration program at Shared Services Canada to
- enable a new generation of digital service delivery offerings for Canadians
- ensure that existing government applications are migrated off aging and vulnerable IT infrastructure
- deliver on the government's vision of a modern, digitally enabled public service, as well as its drive to prioritize cloud-based computing.
- Statistics Canada moved close to 100% of applications and services from its aging Tunney's Pasture data centre to a cloud environment. This was the first time a cloud migration of this scale has been completed in the public service.
- The benefit to Canadians is clear: the agency's secure cloud environment is foundational for transforming Statistics Canada's services to Canadians. These are shifting away from simple data tables and toward enhanced data analytics capabilities, greater access to data through user-friendly tools, and an increased value proposition through improvements to data quality and timeliness.
- For the agency, keeping pace with change and innovation has improved
- its risk posture
- its organizational agility
- the user experience
- data access, collaboration and sharing
- the security of its sensitive statistical information.
Measuring sustainable development
Image
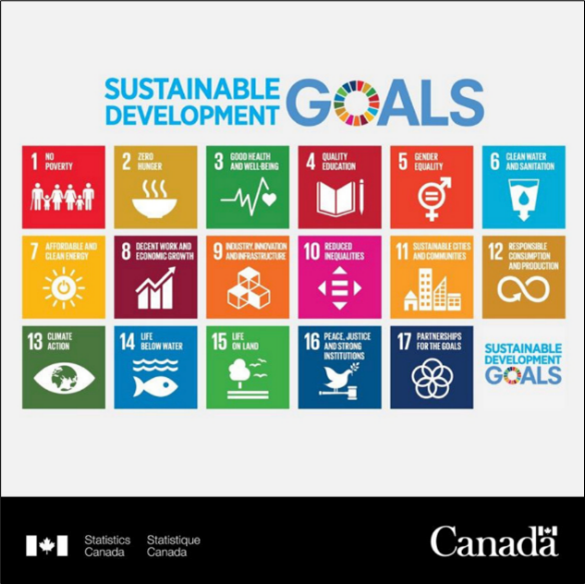
Description - Sustainable Development Goals
Sustainable Development Goals
- No poverty
- Zero hunger
- Good health and well-being
- Quality education
- Gender equality
- Clean water and sanitation
- Affordable and clean energy
- Decent work and economic growth
- Industry, innovation and infrastructure
- Reduced inequalities
- Sustainable cities and communities
- Responsible consumption and production
- Climate action
- Life beyond water
- Life on land
- Peace, justice and strong institutions
- Partnerships for the goals
- The agency has been significantly involved in work to meet the Sustainable Development Goals, part of the global 2030 Agenda for Sustainable Development. Statistics Canada also co-chaired the United Nations (UN) Inter-agency and Expert Group on Sustainable Development Goal Indicators.
- Statistics Canada chairs the United Nations Network of Economic Statisticians, the UN Committee of Experts on Environmental-Economic Accounting, the Organization for Economic Co-operation and Development Committee on Statistics and Statistical Policy and co-chairs the United Nations Inter-Agency Expert Group on Sustainable Development Goals Indicators. Statistics Canada's involvement in these committees is essential, as it shows that Canada, through the agency, is exerting leadership and influence, while sharing Canadian values internationally.
- Statistics Canada developed a large number of indicators that help track Canada's progress toward meeting the Sustainable Development Goals. To better inform Canadians, the agency created infographics; in 2022–23, goals 1 to 11 were covered. Infographics on the remaining six goals will be released during the second quarter of 2023–24.
- The agency meaningfully contributed to meeting the Sustainable Development Goals and supported capacity building in other countries through initiatives such as the Project for the Regional Advancement of Statistics in the Caribbean. Through this project, Statistics Canada helped Caribbean countries
- conduct their censuses while considering the challenges raised by pandemic restrictions
- improve the coverage of business populations with the use of administrative data
- increase the visibility of national statistical offices by modernizing their websites, making data more easily findable, highlighting the most recent releases and providing more data visualization
- complete their statistical business registers and finalize their communication and dissemination development.
Harnessing data to support Indigenous self-determination
Image
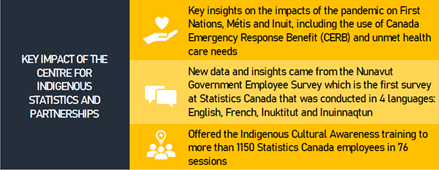
Description - Key impact of the Centre for Indigenous Statistics and Partnerships
- Key insights on the impacts of the pandemic on First Nations, Métis and Inuit, including the use of Canada Emergency Response Benefit (CERB) and unmet healt care needs.
- New data and insights came from the Nunavut Government Employee Survey which is the first survey at Statistics Canada that was conducted in 4 languages: English, French, Inuktitut and Inuinnaqtun.
- Offered the Indigenous Cultural Awarenesss training to more than 1150 Statistics Canada employees in 76 sessions.
- In 2022–23, Statistics Canada, through its Centre for Indigenous Statistics and Partnerships, accelerated its efforts to strengthen data capacity among First Nations people, Métis and Inuit. The Transformational Approach to Indigenous Data helps communities advance self-determination and respond to distinct and evolving service delivery needs. This approach includes new data investments and the co-development of data and research projects that help First Nations people, Métis and Inuit achieve the capacity needed to collect, manage and use their own data, for their benefit. The agency is also improving the visibility of Indigenous peoples through the availability of national statistics.
- The Indigenous Statistical Capacity Development Initiative, led by the Centre for Indigenous Statistics and Partnerships, supported Indigenous organizations and communities looking to develop and sustain their own statistical capacity by providing training on various topics related to statistics.
- In November 2022, Statistics Canada released poverty estimates for Yukon and the Northwest Territories for the first time. These estimates were the culmination of a collaboration between Statistics Canada, Employment and Social Development Canada, and the territorial governments.
Leveraging new approaches and technologies
Image

- This past year, the agency invested in machine learning to enhance alternative data collection and use. This included identifying foods in images for health surveys, extracting product information from receipts, and finding location-relevant content in unstructured financial documents. Statistics Canada also developed a flash estimation method for electricity generation with significantly lower error rates, contributing to a reduction of manual work.
- Furthermore, the agency led monthly events for the public to share and engage with data and to bring data and insights into decision making for the benefit of all Canadians. The agency led monthly hackathons on a variety of topics, including climate change, workplace health, and grants and contributions. These collaborative events helped tackle real challenges by inviting partners with diverse experiences, skills and perspectives from across the public, private and non-profit sectors to co-create innovative solutions with agency experts.
Fostering data literacy to encourage evidence-based decision making
Image
- Statistics Canada expanded training resources and shared them freely with users through its Data Literacy Training Initiative. Since its release in 2020, this initiative has received over 150,000 visits and over 300,000 page views. The agency also worked with partners across the federal government to build capacity among public servants. New training products have been incorporated into the data literacy training of several federal departments.
Image

To better respond to the information needs of Canadians, Statistics Canada strengthened partnerships and collaborated with all levels of government, international partners and other organizations. The agency continued to improve local data and track changes in trends to optimize new and existing initiatives that benefit Canadians. To meet these objectives, the agency has been
- collaborating with provinces and territories to improve health outcomes
- partnering to improve knowledge about Northern Canada
- improving local data for better decision making
- pursuing partnerships to develop data about zero emissions
- collaborating to improve education and labour-market outcomes
- making a difference on the world stage.
Collaborating with provinces and territories to improve health outcomes
- Throughout 2022–23, the agency explored trends in provisional causes of death, including drug overdose, and their effect on excess mortality. It also continued to publish monthly releases on deaths and excess mortality using the Canadian Vital Statistics - Death database, which collects information from all provincial and territorial vital statistics registries through a partnership with the Vital Statistics Council for Canada. The data were accompanied by analyses that considered how they were affected by factors such as COVID-19 variants, heat waves and alcohol, and they were disaggregated in various ways, including by age and sex. These insights are a key input in creating public health policies. They were featured in statements by chief public health officers, as well as in media coverage.
- In spring 2022, the agency launched the Community Fire Risk Reduction Dashboard, a geospatial pilot project co-developed by Statistics Canada and the British Columbia Office of the Fire Commissioner. It uses census data and data from the National Fire Information Database on fire deaths and fire-related crimes. This tool visually highlights the fire risk at the neighbourhood level to help British Columbia fire services prevent fires, reduce injuries and save lives. With the collaboration of fire safety partners and emergency managers, the agency plans to turn this pilot project into a national tool that could assist with other disaster risk reduction efforts, such as wildfires and floods.
- In addition, in 2022–23, the agency worked with fire safety partners across Canada to increase analysis and improve insights on fire deaths and fire-related crimes.
Partnering to improve knowledge about Northern Canada
- Under the Northern Data Strategy, the agency continued to promote innovative solutions to fill data gaps in the North through partnerships with the Yukon and Northwest Territories bureaus of statistics.
- The Northern Data Strategy was used to develop the Northern Canada Social Survey (NCSS) as the primary survey collection vehicle in the North, to help manage the agency's survey footprint in the region. Managing this footprint is integral to the agency's long-term ability to collect survey data. When launched, the NCSS will streamline household collection and address issues of survey burden and fatigue. The agency engaged with federal, territorial and Indigenous partners to ensure that the NCSS will meet key data needs. This work is supported by a strong governance framework to make sure that survey scheduling, collection strategies and content follow best practices to respond to Northern realities.
Improving local data for better decision making
- Statistics Canada continued to strengthen its partnership with the Federation of Canadian Municipalities to better understand the data needs of communities of all sizes and support evidence-based decision making.
- The agency aims to provide detailed statistics to municipalities and their residents via improved access to municipal-level and disaggregated data and greater data sharing and collaboration.
- The agency fulfilled this commitment over the past year by launching the beta version of the Municipal Data Portal, the Centre for Municipal and Local Data, and the experimental Municipal Financial and Socioeconomic Data Dashboard.
- In addition, the agency established a detailed communications and engagement plan that focuses on improving data literacy through webinars, data sessions and data bootcamps.
- This partnership with municipalities allows academic groups to make municipal data more accessible, thereby improving the availability of municipal-level statistical information and services to communities. It also ensures that municipalities have the necessary knowledge and staff to assess data for their own needs, ultimately building trust with local communities.
Pursuing partnerships to develop data about zero emissions
Image

Description - New motor vehicles
Canadians registered 431,861 new motor vehicles in the second quarter.
Source: Statistics Canada, Table 20-10-0024-01 New motor vehicle registrations, quarterly.
- In December 2022, the transportation statistics program resumed the national vehicle registration counts for Canada and the provinces. The series now includes enhanced vehicle type categories and key information about fuel type, including zero-emission vehicles, which can be viewed using the New Motor Vehicle Registrations Data Visualization Tool. These enhancements represent an important step along Canada's path toward reducing greenhouse gas emissions, and they provide the transportation industry and energy policy research community with key benchmark indicators on how the Canadian motor vehicle fleet is evolving.
- Transport Canada has mandated a zero-emission vehicle sales target of 100% by 2035, including interim targets of at least 20% by 2026 and at least 60% by 2030. The interactive visualization tool makes it easier to access and use these data, with a brand-new cloud-based method to derive vehicle counts and data visualizations to help determine the infrastructure required to support the fleet, such as the location of charging stations.
Collaborating to improve education and labour-market outcomes
Image

Description - Racialized graduates with a Canadian bachelor's degree
From 2014 to 2017, 30% of graduates who completed a bachelors's degree at a Canadian educational institution were from a racialized group.
Source: Galarneau, Diane, Liliana Corak and Sylvie Brunet. 2023. "Early career job quality of racialized Canadian graduates with a bachelor's degree, 2014 to 2017 cohorts". Insights on Canadian Society. January. Statistics Canada Catalogue no. 75-006-X.
- The Education and Labour Market Longitudinal Platform (ELMLP)—the result of partnerships between Statistics Canada, Employment and Social Development Canada, and the provinces and territories—fills data gaps and enables a greater understanding of student and apprentice pathways, transitions to the labour market, and outcomes over time. In 2022–23, the ELMLP enabled the development and release of new and meaningful insights on the labour market and economic trajectories of postsecondary students. For instance, two new studies on the relationship between educational attainment and occupation for racialized populations were released.
- In addition, the agency created the Elementary to Postsecondary Student Education Dashboard: Enrolments, Graduations and Tuition Fees. This dashboard amalgamates three education surveys to provide insights throughout student pathways.
- In partnership with Natural Resources Canada, the Canada Energy Regulator, and Environment and Climate Change Canada, Statistics Canada continued to expand access to energy information through the Canadian Centre for Energy Information (CCEI). More than 850 data products from 120 different sources are currently available on the CCEI portal.
- In 2022–23, new content on topics such as uranium and nuclear power was added, and data on household spending on energy were enhanced. In addition, a new section on energy and the environment was launched in June 2022. It features 11 new data visualizations and 17 indicators on energy-related environmental topics, and it provides better access to data on greenhouse gas emissions from both Statistics Canada and Environment and Climate Change Canada.
- Work is also ongoing this year to improve energy data quality and reduce data gaps. This includes launching a pilot project to publish a dashboard of publicly available high-frequency electricity data from utilities and expanding the Monthly Renewable Fuel Survey.
Making a difference on the world stage
- Statistics Canada exercised significant leadership in the international statistical system, including
- in leading roles in the Conference of European Statisticians and the UNECE, on topics such as quality of life and statistics on children
- as chair of the Committee on Statistics and Statistical Policy of the Organisation for Economic Co-operation and Development
- as chair of the UN Network of Economic Statisticians
- as chair of the UN Committee of Experts on Environmental-Economic Accounting
- as chair of the High-Level Group for the Modernisation of Official Statistics.
- The agency is also examining the organizations and groups it is involved with to ensure that engagement in the international statistical system is done thoughtfully and strategically and that there is no duplication. Statistics Canada's involvement in these committees shows that Canada, through the agency, is exerting leadership and influence, while sharing Canadian values internationally.
Image

In 2022–23, Statistics Canada renewed its human resource planning framework, which enables leaders to establish individualized strategies for recruitment and development, as well as to track progress toward their people-management goals. This allows the agency to continue to support the information needs of Canadians. Activities included
- taking the pulse of employees to respond to their evolving needs
- building a diverse and inclusive workforce
- promoting official languages in the workplace
- making progress on public service renewal.
Taking the pulse of employees to respond to their evolving needs
- In January 2023, the Human Resources Business Intelligence Portal was launched for all executives and assistant directors in the agency. The portal incorporates new cloud technology and respects accessibility best practices to provide a simple user interface that encompasses all human resources data in a centralized location. It is scheduled to be made available to all Statistics Canada employees by mid-2023. It will enable employees to access important resources, view their employment information securely and respond to internal surveys. The portal will make it easier for leaders and employees to use, analyze, contribute to and share the data they need to make more efficient and evidence-based decisions that support organizational health and efficiency.
- Leveraging its expertise in organizational health, the agency partnered with academics and organizations across the federal public service to produce and share research about organizational psychology and employee wellness. This includes detailed research and measurement guidance on engagement and hybrid work, with a committee chaired by the Office of the Chief Human Resources Officer.
- The 2022–23 Public Service Employee Survey was launched in November 2022 in partnership with the Treasury Board of Canada Secretariat. It represents an important opportunity for public servants to share their experiences and improve the quality of their workplace. The data collected allow for informed decisions on people management in the public service.
Building a diverse and inclusive workforce
Image

- In 2022–23, Statistics Canada continued to prioritize equity, diversity and inclusion. It made great progress on the commitments and actions in the multi-year Equity, Diversity and Inclusion Action Plan: Moving Forward Together by completing or beginning 47 of the 50 commitments identified for the first year.
- In this action plan, Statistics Canada committed to data transparency and the provision of disaggregated data to all employees and managers. To this end, the agency released quarterly equity, diversity and inclusion progress reports in 2022–23. These reports shared information on promotion rates for equity-seeking employees across the four designated groups, as well as key insights for a range of indicators, such as the participation of equity-seeking employees in official language programs, workforce representation rates, regional representation and the retention of diverse talent. The reports also served to raise awareness on how the agency is progressing in meeting the collective equity, diversity and inclusion goals, and they helped drive evidence-based decision making. Additional reports specific to Black and Indigenous employees were released, with a focus on representation rates, official language training programs, and recruitment and hiring processes and practices (including for promotions).
- Since 2021, the representation of all designated groups among executives has not only increased but surpassed workforce availability (WFA) rates.
- As of March 31, 2023, women's representation among executives reached 50.0%, surpassing the WFA rate of 44.5%, while the representation of racialized people at the executive level was 16.7%, exceeding the WFA rate of 13.9%. Indigenous representation among executives reached 4.6%, surpassing the WFA rate of 4.2%, while the representation of people with disabilities at the executive level was 15.7%, more than double the WFA rate of 5.4%.
- Representation also increased in feeder groups, supporting the continued diversity of tomorrow's executive cadre. This representation on the leadership team has had and continues to have a profound impact on the agency's culture.
- In addition, Indigenous employees and Black and other racialized employees reached their highest representation to date. Turnover rates of equity groups were at their lowest in comparison with the last five fiscal years.
- To ensure that equity-deserving representation is better reflected on hiring boards, there is an internal inventory where people who have self-identified can be selected to sit on a board. As part of Statistics Canada's employment equity recruitment efforts, it was established that, going forward, the areas of selection for job postings will prioritize employment equity group members. As priority is given to employment equity group members when it comes to appointments, this is also being reflected in language training.
-
Statistics Canada launched self-identification campaigns over the course of the fiscal year and shared various awareness communications. Representation rates for all designated groups exceeded WFA rates at the agency level, as a result of targeted staffing processes; commitments in the Equity, Diversity and Inclusion Action Plan: Moving Forward Together; and self-identification awareness campaigns. Specifically, at the end of fiscal year 2022–23, representation across the designated equity groups was as follows:Image
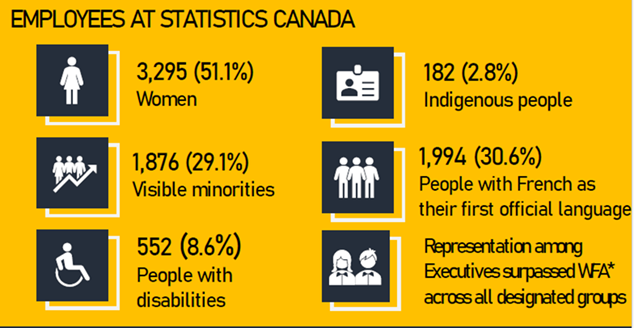
Description - Employees at Statistics Canada
Employees at Statistics Canada
- 3,295 (51.1%) Women
- 1,876 (29.1%) Visible minorities
- 552 (8.6%) People with disabilities
- 182 (8.2%) Indigenous people
- 1,994 (30.6%) People with French as their first official language
- Representation among Executives surpassed WFA across all designated groups
- Indigenous people (Statistics Canada: 2.8%; WFA: 1.7%)
- racialized people (Statistics Canada: 29.2%; WFA: 27.2%)
- people with disabilities (Statistics Canada: 8.7%; WFA: 8.5%)
- women (Statistics Canada: 51.0%; WFA: 44.2%).
- Statistics Canada's accessibility action plan serves as a framework to ensure accessibility in services, products and facilities for both employees and the public. The plan articulates the agency's commitment to ensuring that all employees have fair, equitable and barrier-free access to employment opportunities throughout their career—from recruitment to onboarding to development and career advancement.
Promoting official languages in the workplace
- Statistics Canada has continued to implement an agency-wide strategy to ensure that employees have access to language training to fulfill the operational requirements of their jobs.
- The agency has been prioritizing members of employment equity groups for non-imperative appointments and language training. This approach has helped close employment equity gaps and represents an achievement in access to key positions. To ensure that all employees have access to this training, the agency has implemented alternative solutions, while promoting a common approach that strengthens compliance with the Policy on Official Languages. Such solutions include a hybrid training format for distance learning to include employees nationwide, as well as discussion groups to foster second language maintenance. This approach also ensures that resources can be distributed accordingly, while maintaining sufficient bilingual capacity within the agency.
Making progress on public service renewal
By launching the multi-year Statistics Canada: Road to Accessibility, 2023-2025 action plan in December 2022, Statistics Canada committed to preventing, identifying and removing accessibility barriers. This accessibility action plan serves as a framework to ensure accessibility in services, products and facilities for both employees and the public.
- As part of the public service renewal plan, known as Beyond2020, Statistics Canada is dedicated to equipping employees with tools, training and experience to build inclusion and resilience, and to deliver greater value to Canadians.
- The agency continued to build on its leadership strategy, which aligns with current and future initiatives (culture, values, onboarding, talent management, recognition, diversity, official languages and future of work). The strategy focuses on employee ownership and empowerment, where everyone is provided opportunities to develop as leaders. To this end, and as part of a phased approach to the leadership strategy, the agency launched a series of key leadership development activities, refreshed external targeted leadership programs, and increased participation in learning offerings and Canada School of Public Service course attendance. A leadership culture engagement calendar was also launched, sharing over 30 tools and resources (including events, guides, networking opportunities and best practices) with senior leaders across the agency.
Innovation
Statistics Canada's mandate, for more than a century, has been to build the data flows necessary to reveal Canada's realities and challenges. To achieve this means continuing to strengthen the innovation ecosystem with investments, but also building governance, infrastructure and skills development to promote innovation and experimentation. In many ways, the pandemic taught—and continues to teach—the agency lessons in purpose-driven innovation. The agency is now using the lessons learned from its pandemic response to assist in other areas. The following are notable examples for 2022–23:
- Hackathons are a core piece of the agency's infrastructure to drive innovation. The agency continued to host monthly hackathons on a variety of topics—their whole-of-government approach enables knowledge and best practices in data science to be shared among all federal public servants.
- To help policy makers better understand inflation and inform decisions, Statistics Canada applied innovative methods to key economic indicators such as the CPI, the Industrial Product Price Index, the Wholesale Services Price Index and the Retail Services Price Index. The following are examples of how the agency improved timeliness for key economic indicators:
- The Industrial Product Price Index and the New Housing Price Index are now providing results two to three weeks after the end of the reference month, compared with five to six weeks in the past, helping businesses and policy makers make better-informed decisions.
- The wholesale and retail services price indexes are now producing monthly estimates, compared with quarterly in the past, by using advanced machine learning techniques. These have resulted in more efficient and transparent programs, through automation.
- The Producer Prices Division invested heavily in training and revised and updated its methodological practices and overall production processes. As a result, it is producing economic indicators faster and more cheaply (10% lower costs compared with 2020).
- The agency continued to leverage administrative data and experiment with replacing specific variables in surveys with administrative data to see how this could be used to reduce response burden. Initiatives that used these innovative methods include AgZero, the ELMLP and the DDAP Administrative Data Fund.
- Through the DDAP, Statistics Canada successfully mapped out population trajectories and released information on how different population groups, notably racialized populations and low-income populations, have been impacted by the pandemic.
- As part of Canada's Anti-Racism Strategy, a new Social Inclusion portal was created to bring together key statistical information on the inclusion (or exclusion) of ethnocultural groups and immigrants to Canada.
- Statistics Canada committed to a comprehensive accessibility system review and launched the Engaging DisAbility Innovation Study. This employee-led initiative aims to identify barriers for clients and employees with disabilities by introducing design practices that will allow the agency to develop accessible policies, practices, services and programs.
Key risks
Statistics Canada continuously monitors its environment to develop risk mitigation strategies associated with its core responsibility. The agency will continue to adapt its governing instruments and oversight frameworks and engage with Canadians using clear, transparent and proactive communications. It will also keep investing in robust infrastructure—technological and methodological—to ensure the reliability, timeliness, scalability and security of its statistics. The agency identified five corporate risks and corresponding mitigation strategies.
1. Resources
In a competitive labour market, with a need for new skills and a focus on accessibility, equity, diversity and inclusion in the workplace, Statistics Canada faces risks related to the sufficiency of its human resources and its capacity and expertise to deliver on its vast mandate and broad set of priorities.
To mitigate this risk, the agency continued to implement and prioritize actions from its Equity, Diversity and Inclusion Action Plan: Moving Forward Together. This helped strengthen the diversity and inclusiveness of its workforce. Training for using newer, more modern tools was also provided, ensuring a skilled workforce for the future. In addition, the Investment Review Board was launched, with the goal of ensuring an integrated strategic view of the agency while considering affordability, resource availability and long-term funding strategies.
2. Accuracy and integrity
Maintaining the accuracy of data and information holdings—including avoiding major errors—often competes with the need to produce information faster, increasingly complex production environments, the expanding use of multiple data sources and new techniques, and rising information demands.
As part of its risk mitigation, Statistics Canada was active on the international stage, following and participating in leading-edge developments, such as alternative data sources, web scraping, data integration and data sharing. These allow for adjustments to operations that strengthen data privacy and quality, which Canadians expect. In parallel, new methodologies and approaches were developed to improve statistical programs. For instance, the agency continued to work on implementing an integrated approach to data management through the Enterprise Information and Data Management Project.
3. Confidentiality
Without strict controls and safeguards, the agency's vast amount of confidential and sensitive information is susceptible to potential data breaches, wrongful disclosure and cyber security threats.
In addition to a strong culture and value system, Statistics Canada has sound oversight, governance instruments and processes in place to mitigate this risk. The agency continued to be vigilant by proactively reviewing related confidentiality processes and procedures (e.g., the Policy on Official Release) and providing training and raising awareness for all employees and relevant partners on matters related to values and ethics and the overall security of protected information.
4. Public trust
Wrongful disclosures of information, disinformation campaigns and other factors may impact the public's trust in the agency, resulting in Canadians turning to other, less credible sources of information.
Statistics Canada continued to balance the protection of Canadians' privacy and societal needs for data insights by applying the Necessity and Proportionality Framework. It also kept developing and adding to the Trust Centre on its website. In the context of the 2021 Census dissemination activities, the agency also pursued its "Fighting misinformation" campaign to proactively protect Canadians against false information and scamming attempts.
5. Relevance
Growing external demands stemming from a continuously evolving environment may require changes to ensure programs remain relevant.
To mitigate this risk, Statistics Canada embarked on its second phase of modernization and developed a strategic plan to be implemented starting in 2023–24. The outlined priorities will allow the agency to remain committed to increasing relevance by targeting initiatives that will ensure Canadians keep receiving high-quality statistical information that matters. Statistics Canada also continued to improve the quality and availability of disaggregated data in support of the Government of Canada's commitment to evidence-based decision making.
Results achieved
Across the agency, targets were affected by the release of 2021 Census data and were no longer significantly influenced by releases related to the COVID-19 pandemic. The agency continually strives to improve results and ensure targets remain relevant while also aiming to innovate. Overall, for 2022–23, Statistics Canada reached 8 of 11 performance indicator targets, highly exceeding 4 of them.
Heading into fiscal year 2023–24, Statistics Canada will continue to integrate performance indicator results into its decision-making processes to ensure that valuable data are produced and accessed by the Canadian population.
The following table shows, for statistical information, the results achieved, the performance indicators, the targets and the target dates for 2022–23, and the actual results for the three most recent fiscal years for which actual results are available.
| Performance indicators | Target | Date to achieve target | 2020–21 actual results | 2021–22 actual results | 2022–23 actual results |
|---|---|---|---|---|---|
| High-quality statistical information is available to Canadians | |||||
| Number of post-release corrections due to accuracy | 0 | March 31, 2023 | 6 | 7Table note 1 | 11Table note 2 |
| Percentage of international standards with which Statistics Canada conforms | 90%Table note 3 | March 31, 2023 | 88% | 88% | 98%Table note 4 |
| Number of statistical products available on the website | 47,680 | March 31, 2023 | 40,738 | 43,184 | 46,318 |
| Number of Statistics Canada data tables available on the Open Data Portal | 8,450 | March 31, 2023 | 7,755 | 8,088 | 8,884 |
| High-quality statistical information is accessed by Canadians | |||||
| Number of visits to Statistics Canada's website | 24,500,000 | March 31, 2023 | 28,193,955Table note 5 | 45,972,326Table note 6Table note 7 | 31,283,576Table note 8 |
| Number of hits on Statistics Canada's application programming interface (API) | 4,055,000 | March 31, 2023 | 3,899,779 | 5,950,252 | 10,073,000Table note 9 |
| Percentage of website visitors who found what they were looking for | 78% | March 31, 2023 | 77% | 74%Table note 10 | 78%Table note 11 |
| Number of interactions on social media | 1,200,000 | March 31, 2023 | 1,211,316Table note 5 | 13,174,481Table note 6Table note 7 | 1,012,981Table note 12 |
| High-quality statistical information is relevant to Canadians | |||||
| Number of media citations of Statistics Canada data | 78,000 | March 31, 2023 | 253,171Table note 5 | 139,078Table note 7 | 213,229Table note 13 |
| Number of journal citations | 38,000 | March 31, 2023 | 33,596Table note 5 | 40,248Table note 14 | 44,271Table note 15 |
| Percentage of users satisfied with statistical information | 80% | March 31, 2023 | 80% | 80% | 80% |
|
Table notes
|
|||||
Financial, human resources and performance information for Statistics Canada's program inventory is available in GC InfoBase.
Budgetary financial resources (dollars)
The following table shows, for statistical information, budgetary spending for 2022–23, as well as actual spending for that year.
| 2022–23 Main Estimates | 2022–23 planned spending | 2022–23 total authorities available for use | 2022–23 actual spending (authorities used) | 2022–23 difference (actual spending minus planned spending) | |
|---|---|---|---|---|---|
| Gross expenditures | 616,663,357 | 616,663,357 | 754,356,616 | 731,447,169 | 114,783,812 |
| Respendable revenue | -120,000,000 | -120,000,000 | -159,349,013 | -159,349,013 | -39,349,013 |
| Net expenditures | 496,663,357 | 496,663,357 | 595,007,603 | 572,098,156 | 75,434,799 |
Financial, human resources and performance information for Statistics Canada's program inventory is available in GC InfoBase.
Human resources (full-time equivalents)
The following table shows, in full‑time equivalents, the human resources the department needed to fulfill this core responsibility for 2022–23.
| 2022–23 planned full-time equivalents | 2022–23 actual full-time equivalents | 2022–23 difference (actual full-time equivalents minus planned full-time equivalents) | |
|---|---|---|---|
| Gross expenditures | 5,889 | 7,005 | 1,116 |
| Respendable revenue | -1,181 | -1,795 | -614 |
| Net expenditures | 4,708 | 5,210 | 502 |
The difference between planned spending and actual spending in the statistical information program is the result of an operating budget carried forward from 2021–22 to 2022–23 to enable the agency to meet the needs of its cyclical programs and a reprofile of funds to successfully close out the final years of the 2021 Census cycle.
Additionally, new initiatives from Budget 2021 and Budget 2022, as well as other departmental organizations, increased Statistics Canada's resources. These initiatives include the Clean Technology Data Strategy, the Survey of Intellectual Property Commercialization in the Higher Education Sector, the oral health component of the upcoming Canadian Health Measures Survey, the initiative for advancing a circular economy for plastics in Canada and the Federal Action Plan to Strengthen Internal Trade. Compensation was also received for the ratification of collective agreements.
Respendable revenue increased because of additional work associated with extra demands following the slowdown during the pandemic and the 2021 Census.
The increases were partially offset by budget carried forward to 2023–24.
Furthermore, full-time equivalents vary slightly as a result of differences between the actual salary rates paid and the estimated average salary rates used to forecast planned spending.
Financial, human resources and performance information for Statistics Canada's program inventory is available in GC InfoBase.
Internal services
Description
Internal services are those groups of related activities and resources that the federal government considers to be services in support of programs and/or required to meet corporate obligations of an organization. Internal services refers to the activities and resources of the 10 distinct service categories that support program delivery in the organization, regardless of the internal services delivery model in a department. The 10 service categories are:
- acquisition management services
- communication services
- financial management services
- human resources management services
- information management services
- information technology services
- legal services
- material management services
- management and oversight services
- real property management services
Results
Statistics Canada's internal services have been dedicated to continuing to modernize and innovate the agency's workforce, by providing a representative, flexible and accessible work environment and workforce, during a dynamic period.
Through internal planning and the implementation of workforce strategies, the agency continued to focus on creating a diverse and inclusive workforce, more than ever before, while ensuring that all employees and leaders are equipped to make accessibility part of everyday planning. Statistics Canada created inclusive and flexible policies, programs and services, alongside objective internal consultations and audits, to ensure its plans are aligned with workforce needs and foster a positive work environment. The agency's internal services touched on the following areas:
- skillsets and talent management
- accessibility
- internal audit and evaluation
- awards and recognition.
Skillsets and talent management
- The agency made significant advances in implementing the leadership strategy, which aligns current and future initiatives and focuses on digital enablement, diversity and inclusion, and the future of work. The strategy also promotes language training and better positions people to obtain higher-level roles. As a result, representation has increased and the retention of diverse talent has improved. These core elements are critical to ensuring a workforce that best represents today's diverse Canada.
- With an increase in the representation of Black people, people from other racialized groups, Indigenous people, people with disabilities, members of LGBTQ2+ communities and women among employees, and improvements in the retention of this diverse talent, the leadership strategy reinforces the need to prioritize a diverse workforce and support employee career progression. This, in turn, enhances and expands the agency's overall talent pool, making Statistics Canada stronger.
- To this end, the leadership strategy promotes language training for aspiring leaders, to better position them to obtain higher-level positions. As a result, the agency has seen and continues to see a significant impact in diversifying its talent, which better represents the public it serves.
Accessibility
- From March to October 2022, the agency conducted an in-depth independent assessment of accessibility and employment systems to ensure a bias-free view of accessibility barriers. The assessment was centred on data analysis, a document review, employee consultations and focus groups. Its findings served to inform actions committed to in Statistics Canada: Road to Accessibility, 2023-2025. To ensure a "nothing without us" approach, as well as an intersectional perspective, the review included engagement and consultations with participants from various equity seeking groups and sociocultural backgrounds.
- The agency launched the Statistics Canada: Road to Accessibility, 2023-2025 action plan in December 2022. The plan aims to ensure that the agency meets all employees' accessibility needs across the country and supports the implementation of a barrier-free environment. The plan is anchored in areas of focus articulated in the Accessible Canada Act. Through the addition of workplace accommodation and culture pillars, it is bolstered by two additional areas of focus that emphasize the importance of accommodation and an accessibility-confident and disability-inclusive culture.
- To develop this plan, Statistics Canada followed through on several internal commitments to better understand, support and create an inclusive workplace. The agency undertook a comprehensive accessibility and employment systems review, reviewed responses to the Engaging DisAbility Innovation Study (an employee-led initiative launched in partnership with Canadian Heritage and supported by the Office of Public Service Accessibility at the Treasury Board of Canada Secretariat), and participated in engagement consultations with the Persons with Disabilities Committee to articulate actions and commitments across all priority areas.
- In addition to the release of the plan, the agency created the Accessibility Secretariat and the Statistics Canada Accessibility Leadership Taskforce, so that the agency can continue to prioritize accessibility and ensure that its commitments are measurable and attainable and result in a barrier-free agency.
Internal audit and evaluation
- The Audit and Evaluation Branch provides management with trusted, neutral and objective information for decision making. In 2022–23, the branch provided feedback through its audit and evaluation projects using an increasingly agile and focused approach. It also shared timely insight and advice to support the agency's top priorities. This information was provided at critical times in the early stages of planning and implementing new program strategies and initiatives, including the modernization of the IT environment and solutions.
Awards and recognition
-

-

- The agency has adopted an innovative and supportive mindset to continuously improve its workplace. It aims to build a caring, inclusive and resilient workforce that prioritizes diversity, accessibility, learning, career development, modernization, and overall health and well-being among employees.
-
A number of Statistics Canada employees and executives were recognized with external awards and commendations throughout 2022–23, including a Top 25 Canadian Immigrant Awards accolade for the Chief Statistician, the Institute of Public Administration of Canada's Award for Emerging Leaders, the APEX Innovation Award, the Diamond Award of Communications Excellence, the Statistical Society of Canada's Distinguished Service Award, the International Association for Official Statistics' Young Statisticians Prize and several Digital Government Community awards.
Statistics Canada was named one of Canada's Best Diversity Employers, as published in The Globe and Mail. The agency is committed to prioritizing equity, diversity and inclusion. It has made great progress on these commitments and has seen a profound and immediate impact on its culture.
- Statistics Canada is proud to have been recognized by these organizations for its professionalism; expertise; and desire to continuously improve and modernize its workplace, its programs and the products it develops for its clients. These achievements are a testament to the agency's dedicated employees, their statistical work and their overall commitment to serving Canadians who rely on Statistics Canada data.
Contracts awarded to Indigenous businesses
Statistics Canada is a Phase 2 organization and is aiming to achieve the minimum 5% target by the end of 2023–24.
Statistics Canada has developed a strategy to create more opportunities for Indigenous businesses by analyzing its future procurement needs and identifying when a set-aside or conditional set-aside strategy would be adopted. Also, the agency updated its internal documentation to ensure that Indigenous businesses would be considered.
100% of procurement specialists completed the mandatory Indigenous Considerations in Procurement (COR409) course from the Canada School of Public Service. They also attended other training events offered by Public Services and Procurement Canada and Indigenous Services Canada.
Budgetary financial resources (dollars)
The following table shows, for internal services, budgetary spending for 2022–23, as well as spending for that year.
| 2022–23 Main Estimates | 2022–23 planned spending | 2022–23 total authorities available for use | 2022–23 actual spending (authorities used) | 2022–23 difference (actual spending minus planned spending) |
|---|---|---|---|---|
| 80,030,892 | 80,030,892 | 111,048,632 | 110,581,024 | 30,550,132 |
Human resources (full-time equivalents)
The following table shows, in full‑time equivalents, the human resources the department needed to carry out its internal services for 2022–23.
| 2022–23 planned full-time equivalents | 2022–23 actual full-time equivalents | 2022–23 difference (actual full-time equivalents minus planned full-time equivalents) |
|---|---|---|
| 659 | 833 | 174 |
The difference between planned spending and actual spending in internal services is mainly related to an increase in resources for an initiative, approved in 2018–19, to migrate the agency's infrastructure to the cloud and additional spending related to IT support.
Internal investments approved through the agency's Integrated Strategic Planning Process also contributed to the increase.
| Total actual spending for 2022–23 (dollars) | Total actual full-time equivalents for 2022–23 | |
|---|---|---|
| Total gross expenditures | 842,028,193 | 7,838 |
| Respendable revenues | - 159,349,013 | - 1,795 |
| Total net expenditures | 682,679,180 | 6,043 |
"The agency has stepped up its stewardship role in Canada's data ecosystem. It has the expertise to access and integrate data responsibly and to produce timely, relevant insights, while providing frameworks around its use of data to ensure their quality and safety. Its modernization efforts have enabled Canadians to access much richer information on the country's economy and society than in years past."
Anil Arora
Chief Statistician of Canada
In 2022‒23, Statistics Canada, in response to the increasing need for high-quality, reliable information, expanded and innovated its data collection, methods, standards and products to provide Canadians with data-driven insights. The agency continued its modernization journey built around five guiding principles, demonstrating its leadership in data stewardship. It broadened its reach with new and diverse products offering Canadians real-time information and in-depth analyses—how and when they want them—in an era of rapid social and economic changes.
Statistics Canada made significant progress with its Disaggregated Data Action Plan (DDAP), allowing the agency to be more responsive to the data needs of diverse groups. For instance, key indicators on racialized populations, Indigenous peoples and people with disabilities can now be broken down to provide insights into the quality-of-life outcomes of these groups.
Another pivotal achievement during the past year was the publication of the 2021 Census results using state-of-the-art systems to better inform research, analysis and policy making for years to come. The Communications Community Office recognized Statistics Canada's census communications campaign with the 2022 Diamond Award of Communications Excellence. Furthermore, the agency played a leading role in the Government of Canada's transition to cloud infrastructure, becoming the first organization to fully operate in the cloud environment and enabling a new generation of digital service delivery offerings for Canadians. In December 2022, the agency released its Road to Accessibility, a comprehensive action plan to ensure accessibility in services, products and facilities for employees.
In addition, the agency engaged more than ever with First Nations people, Métis and Inuit to increase their involvement and collaboration, especially for the census data release of September 2022, as well as during census data collection. Engaging them in important roles represents a significant step toward meaningful reconciliation and collaborative policy development to strengthen the agency's various initiatives.
Collectively, the projects featured in this report reveal the agency's ability to adapt to the increased need for high-quality data to pave the way for a more informed and inclusive Canada. The strides made in terms of data collection, technological upgrades, accessibility and inclusivity have set new standards to enhance the quality of the agency's services and the overall client experience.
Image
In line with its commitment to the user experience, Statistics Canada developed new ways to meet the increased need for high-quality data, with insights that are easier to find, share and use. Over the past year, the agency
- published seven themed major releases of 2021 Census data, some of which were covered in national news, including 30 analytical products, visualization tools and infographics covering 18 topics, with a social media campaign that reached 12.4 million impressions and 311,000 engagements
- launched new publications on emerging labour market topics and expanded questionnaires to measure diverse business ownership
- expanded the use of administrative data, increased data collection, launched new analyses and updated data hubs to increase knowledge and report to Canadians on the state and progress of gender equality and the experiences and outcomes of diverse groups, all while increasing transparency and strengthening privacy protection
- deployed innovative products such as the Eh Sayers podcast; StatsCAN Plus, one of the agency's release vehicles; the StatsCAN app to modernize data publishing; and the Virtual Data Lab, which provides remote access to detailed, anonymized social and business microdata for research
- developed the pilot physical flow account for plastic material, which estimates the flow of plastic through the Canadian economy to support the Government of Canada's zero plastic waste agenda.
Image
This past year, Statistics Canada focused on building knowledge, skills and data literacy across the Government of Canada. It implemented new digital initiatives with leading-edge approaches to collection, research and analysis to increase service speed and flexibility. The agency also
- modernized survey collection methods by using more administrative data and machine learning techniques with enhanced transparency and privacy protection
- improved surveys to link and integrate them with existing data holdings
- expanded data science and data modelling capabilities to position Statistics Canada for producing not only data, but also data-driven insights
- continued to lead internationally in best practices for privacy, data ethics and data governance
- strengthened capabilities in response to the evolving threat landscape, with a growing focus on cyber security
- continued to protect Statistics Canada's data and digital ecosystem and to ensure preparedness for the 2026 Census.
Image
In 2022–23, Statistics Canada continued to share knowledge with Canadians to further enable access to and understanding of data. The agency made progress with the indicators measuring the Sustainable Development Goals and quality of life, all while using modern tools and working in a cloud environment. The agency also
- continued to strengthen, evolve and innovate the national statistical system to better serve Canadians through ongoing collaboration and partnerships
- supported capacity building and data literacy projects, contributing to meeting the global Sustainable Development Goals
- developed definitions for 77 quality of life indicators and released the majority, along with their metadata, on the Quality of Life Hub, which provides one-stop access to quality of life measures across five domains
- expanded training resources and shared them freely with users through the Data Literacy Training Initiative, which provides videos and workshops for the various steps of the data journey, divided by data competency, level and type.
Image
To better respond to evolving information needs and leverage and optimize statistical programs, initiatives and activities for the benefit of Canadians, Statistics Canada collaborated with federal departments; provincial and territorial governments; international partners; and other organizations, such as businesses and non-governmental organizations. The agency also
- strengthened partnerships with the Federation of Canadian Municipalities to enhance understanding of local environments and enable decisions at the municipal level
- collaborated with provinces and territories to combine databases and develop and publish tools such as releases and dashboards for the well-being of smaller regional groups
- collaborated with organizations to enhance data availability and quality in the environment and energy fields
- remained a leader in the international statistical system.
Image
Statistics Canada strengthened its workforce by attracting and retaining diverse talent that better represents Canada's geographical and cultural diversity, while building a culture of inclusion. The agency focused on ensuring that employees are agile and equipped to deliver greater value to Canadians and continued to support wellness and mental health. The agency also
- launched a portal to make it easier for leaders and employees to use, analyze, contribute and share the data they need to support organizational health and efficiency
- continued to prioritize equity, diversity and inclusion by completing or starting 47 of the 50 commitments in the first year of the multi-year Equity, Diversity and Inclusion Action Plan: Moving Forward Together
- developed strategies to increase the representation and advancement of women, Indigenous people, racialized people and people living with disabilities
- equipped employees with tools, training and experience to deliver greater value to Canadians.
For more information on Statistics Canada's plans, priorities and results achieved, see the "Results: what we achieved" section of this report.
Image

It is my sincere pleasure to present Statistics Canada's accomplishments over the 2022–23 fiscal year in this Departmental Results Report.
As the country faced both economic and social challenges throughout the year, Statistics Canada worked diligently to provide Canadians with high-quality data-driven insights to inform their decision making. The agency has delivered results for Canadians on the following priorities for 2022–23:
- Published the results of the 2021 Census of Population and Census of Agriculture: Using state-of-the-art systems, Statistics Canada proudly published seven themed major releases of 2021 Census data, with over 350 data tables and 30 analytical products, as well as visualization tools and infographics covering 18 major topics. This gave Canadians access to 31 billion data points—an unparalleled level of detail and insight. The agency also released multiple products associated with the 2021 Census of Agriculture that were well received by Canadians, including multiple analytical reports in Canadian Agriculture at a Glance. These data will serve Canadians for generations to come.
- Enhanced coverage of emerging issues: Statistics Canada made significant progress with its Disaggregated Data Action Plan, which allowed the agency to be more responsive to the data needs of diverse groups. For instance, key indicators on racialized populations, Indigenous peoples and people with disabilities can now be broken down to provide insights into the quality-of-life outcomes of these groups. The agency is also leading the development of the world's first Census of Environment. This initiative aims to improve Canadians' knowledge about the country's ecosystems and promote better decision making as a means of improving how Canada responds to global environmental challenges.
- Expanded leading-edge methods of data collection and integration: In 2022–23, Statistics Canada expanded its data science and data modelling capabilities to better position itself for the high-value work of producing not only data, but also data-driven insights. Work began on the Consumer Price Index (CPI) annual basket updates to allow the CPI to better reflect the latest consumption patterns for the goods and services purchased by Canadians. Frequent basket updates are important to monitor changes in consumer behaviours and preferences. Statistics Canada also developed a microsimulation and modelling program to support health prevention. The program gives experts and decision makers information about the impacts of health prevention strategies on chronic conditions, as well as about the economic implications of different policies on retirement and pensions.
- Collaborated and engaged with partners: Statistics Canada engaged with key partners to ensure that the data collected from and with them serve their needs while also enriching the country's data ecosystem. Collaborations included launching new data labs; partnering with research groups and universities; and sharing information and building statistical capacity with Indigenous groups, municipalities and chambers of commerce. Moreover, the agency continued to be a data steward in the federal public service, ensuring that departments can effectively govern and manage their data assets to better serve all Canadians.
- Provided user-centric services: Over the past year, the agency introduced and promoted innovative products such as the Eh Sayers podcast, StatsCAN Plus (one of the agency's release vehicles) and the StatsCAN app to modernize data publishing. It also promoted the Virtual Data Lab, which provides remote access to detailed, anonymized social and business microdata for research and analysis. These advances give Canadians access to the unbiased facts and data-driven insights they expect from Statistics Canada.
- Built statistical capacity and fostered data literacy: Statistics Canada made important strides on its commitment to sharing knowledge and expertise to help people in Canada use data to make informed decisions. The agency expanded training resources and shared them freely with users through its Data Literacy Training Initiative, which provides videos and workshops for the various steps of the data journey.
- Built a flexible, diverse and agile workforce: Statistics Canada's employees are its strength and the foundation of its success. In 2022–23, the agency strengthened its workforce by attracting and retaining diverse talent that better represents Canada's geographical and cultural diversity, while building a culture of inclusion. The agency focused on ensuring that employees are agile and equipped to deliver greater value to Canadians and continued to support wellness and mental health. It also made great progress on the commitments and actions in the multi-year Equity, Diversity and Inclusion Action Plan: Moving Forward Together by completing or beginning 47 of the 50 commitments identified for the first year.
As Canadians continue to face complex changes—record population growth, the impacts of the COVID-19 pandemic, climate change, economic challenges and calls for social change—the agency will continue to seek new ways to respond to the needs for high-quality, reliable data and data-driven insights.
Many groups and partnerships contributed to another successful year. I would like to thank the Canadian Statistics Advisory Council, the Advisory Council on Ethics and Modernization of Microdata Access, the Departmental Audit Committee and the many subject-matter committees that helped drive the agency's work forward.
In an ever-changing and complex world, data-driven decisions are more critical than ever, and so is Statistics Canada's commitment to safeguarding privacy and confidentiality. I invite Canadians to learn more about how the agency protects their data and how it is helping shape Canada by visiting Statistics Canada's Trust Centre.
As we continue to strive to build a resilient, sustainable and inclusive future in Canada, data will always be our compass.
Anil Arora
Chief Statistician of Canada
Image

It is my pleasure to present the 2022–23 Departmental Results Report for Statistics Canada.
Over the past year, the Innovation, Science and Economic Development (ISED) portfolio worked closely with other government departments and agencies following the COVID-19 pandemic to build a more resilient, sustainable and inclusive economy that benefits all Canadians.
As the country keeps working through challenges brought on by the pandemic, Canadians continue to rely on high-quality data for public policy development.
In 2022–23, Statistics Canada, the country's most comprehensive and reliable source of trustworthy data, continued its modernization journey. It expanded, innovated and adapted data collection, methods, standards and products to provide high-quality data-driven insights about the economy, society and the environment.
The agency gathered more data about this diverse nation and the many complex intersections of identity than ever before. It kept pace with the demand for in-depth information on the labour market, health, demography and agriculture, as well as for the critical data it gathers through the census. Because of these efforts, Canadians had access to richer, more timely and relevant information, which in turn improved insights on the areas that matter most for Canadians and their quality of life.
From data management to partnerships, from innovation to protecting privacy and confidentiality, Statistics Canada continued to move ahead, showcasing its leadership role as a trusted data steward in Canada and internationally.
I invite you to read this report to learn more about how the ISED portfolio is working together with Canadians of all backgrounds and in all regions—urban and rural—to position Canada as a leader in the global economy.
The Honourable François-Philippe Champagne
Minister of Innovation, Science and Industry
Wholesale Trade Survey (monthly): CVs for total sales by geography - July 2023
| Geography | Month | ||||||||||||
|---|---|---|---|---|---|---|---|---|---|---|---|---|---|
| 202207 | 202208 | 202209 | 202210 | 202211 | 202212 | 202301 | 202302 | 202303 | 202304 | 202305 | 202306 | 202307 | |
| percentage | |||||||||||||
| Canada | 0.7 | 0.6 | 0.6 | 0.6 | 0.6 | 0.7 | 0.7 | 0.8 | 0.6 | 0.4 | 0.6 | 0.4 | 0.4 |
| Newfoundland and Labrador | 0.3 | 0.6 | 0.5 | 0.5 | 0.6 | 0.5 | 0.6 | 0.4 | 0.3 | 1.2 | 0.6 | 0.3 | 0.4 |
| Prince Edward Island | 0.0 | 0.0 | 0.0 | 0.0 | 0.0 | 0.0 | 0.0 | 0.0 | 0.0 | 0.0 | 0.0 | 0.0 | 0.0 |
| Nova Scotia | 4.7 | 2.5 | 1.9 | 2.9 | 1.8 | 4.9 | 4.5 | 2.0 | 3.4 | 2.2 | 4.4 | 2.3 | 2.0 |
| New Brunswick | 2.1 | 3.0 | 1.7 | 1.3 | 2.6 | 2.4 | 1.9 | 2.0 | 1.5 | 1.7 | 1.1 | 0.6 | 1.2 |
| Quebec | 1.5 | 1.4 | 1.7 | 1.4 | 1.5 | 2.1 | 1.6 | 1.4 | 1.3 | 2.0 | 1.4 | 1.7 | 1.4 |
| Ontario | 1.1 | 0.9 | 1.0 | 0.9 | 0.9 | 1.1 | 1.3 | 1.4 | 1.4 | 1.0 | 1.4 | 0.8 | 0.8 |
| Manitoba | 1.2 | 1.0 | 1.5 | 2.1 | 1.4 | 1.8 | 0.7 | 0.5 | 0.4 | 1.1 | 0.9 | 0.6 | 0.4 |
| Saskatchewan | 0.6 | 1.1 | 1.2 | 0.5 | 0.7 | 0.4 | 0.5 | 0.5 | 0.7 | 0.6 | 0.7 | 0.5 | 0.4 |
| Alberta | 1.4 | 1.4 | 0.8 | 1.4 | 1.3 | 1.1 | 1.4 | 0.9 | 0.4 | 0.3 | 0.5 | 0.3 | 0.4 |
| British Columbia | 1.9 | 1.6 | 1.8 | 2.6 | 1.5 | 1.4 | 1.5 | 1.8 | 1.8 | 1.3 | 1.0 | 1.2 | 0.9 |
| Yukon Territory | 0.0 | 0.0 | 0.0 | 0.0 | 0.0 | 0.0 | 0.0 | 0.0 | 0.0 | 0.0 | 0.0 | 0.0 | 0.0 |
| Northwest Territories | 0.0 | 0.0 | 0.0 | 0.0 | 0.0 | 0.0 | 0.0 | 0.0 | 0.0 | 0.0 | 0.0 | 0.0 | 0.0 |
| Nunavut | 0.0 | 0.0 | 0.0 | 0.0 | 0.0 | 0.0 | 0.0 | 0.0 | 0.0 | 0.0 | 0.0 | 0.0 | 0.0 |