Evaluation of Communications and Dissemination
Evaluation Report
September 2023
How the report is structured
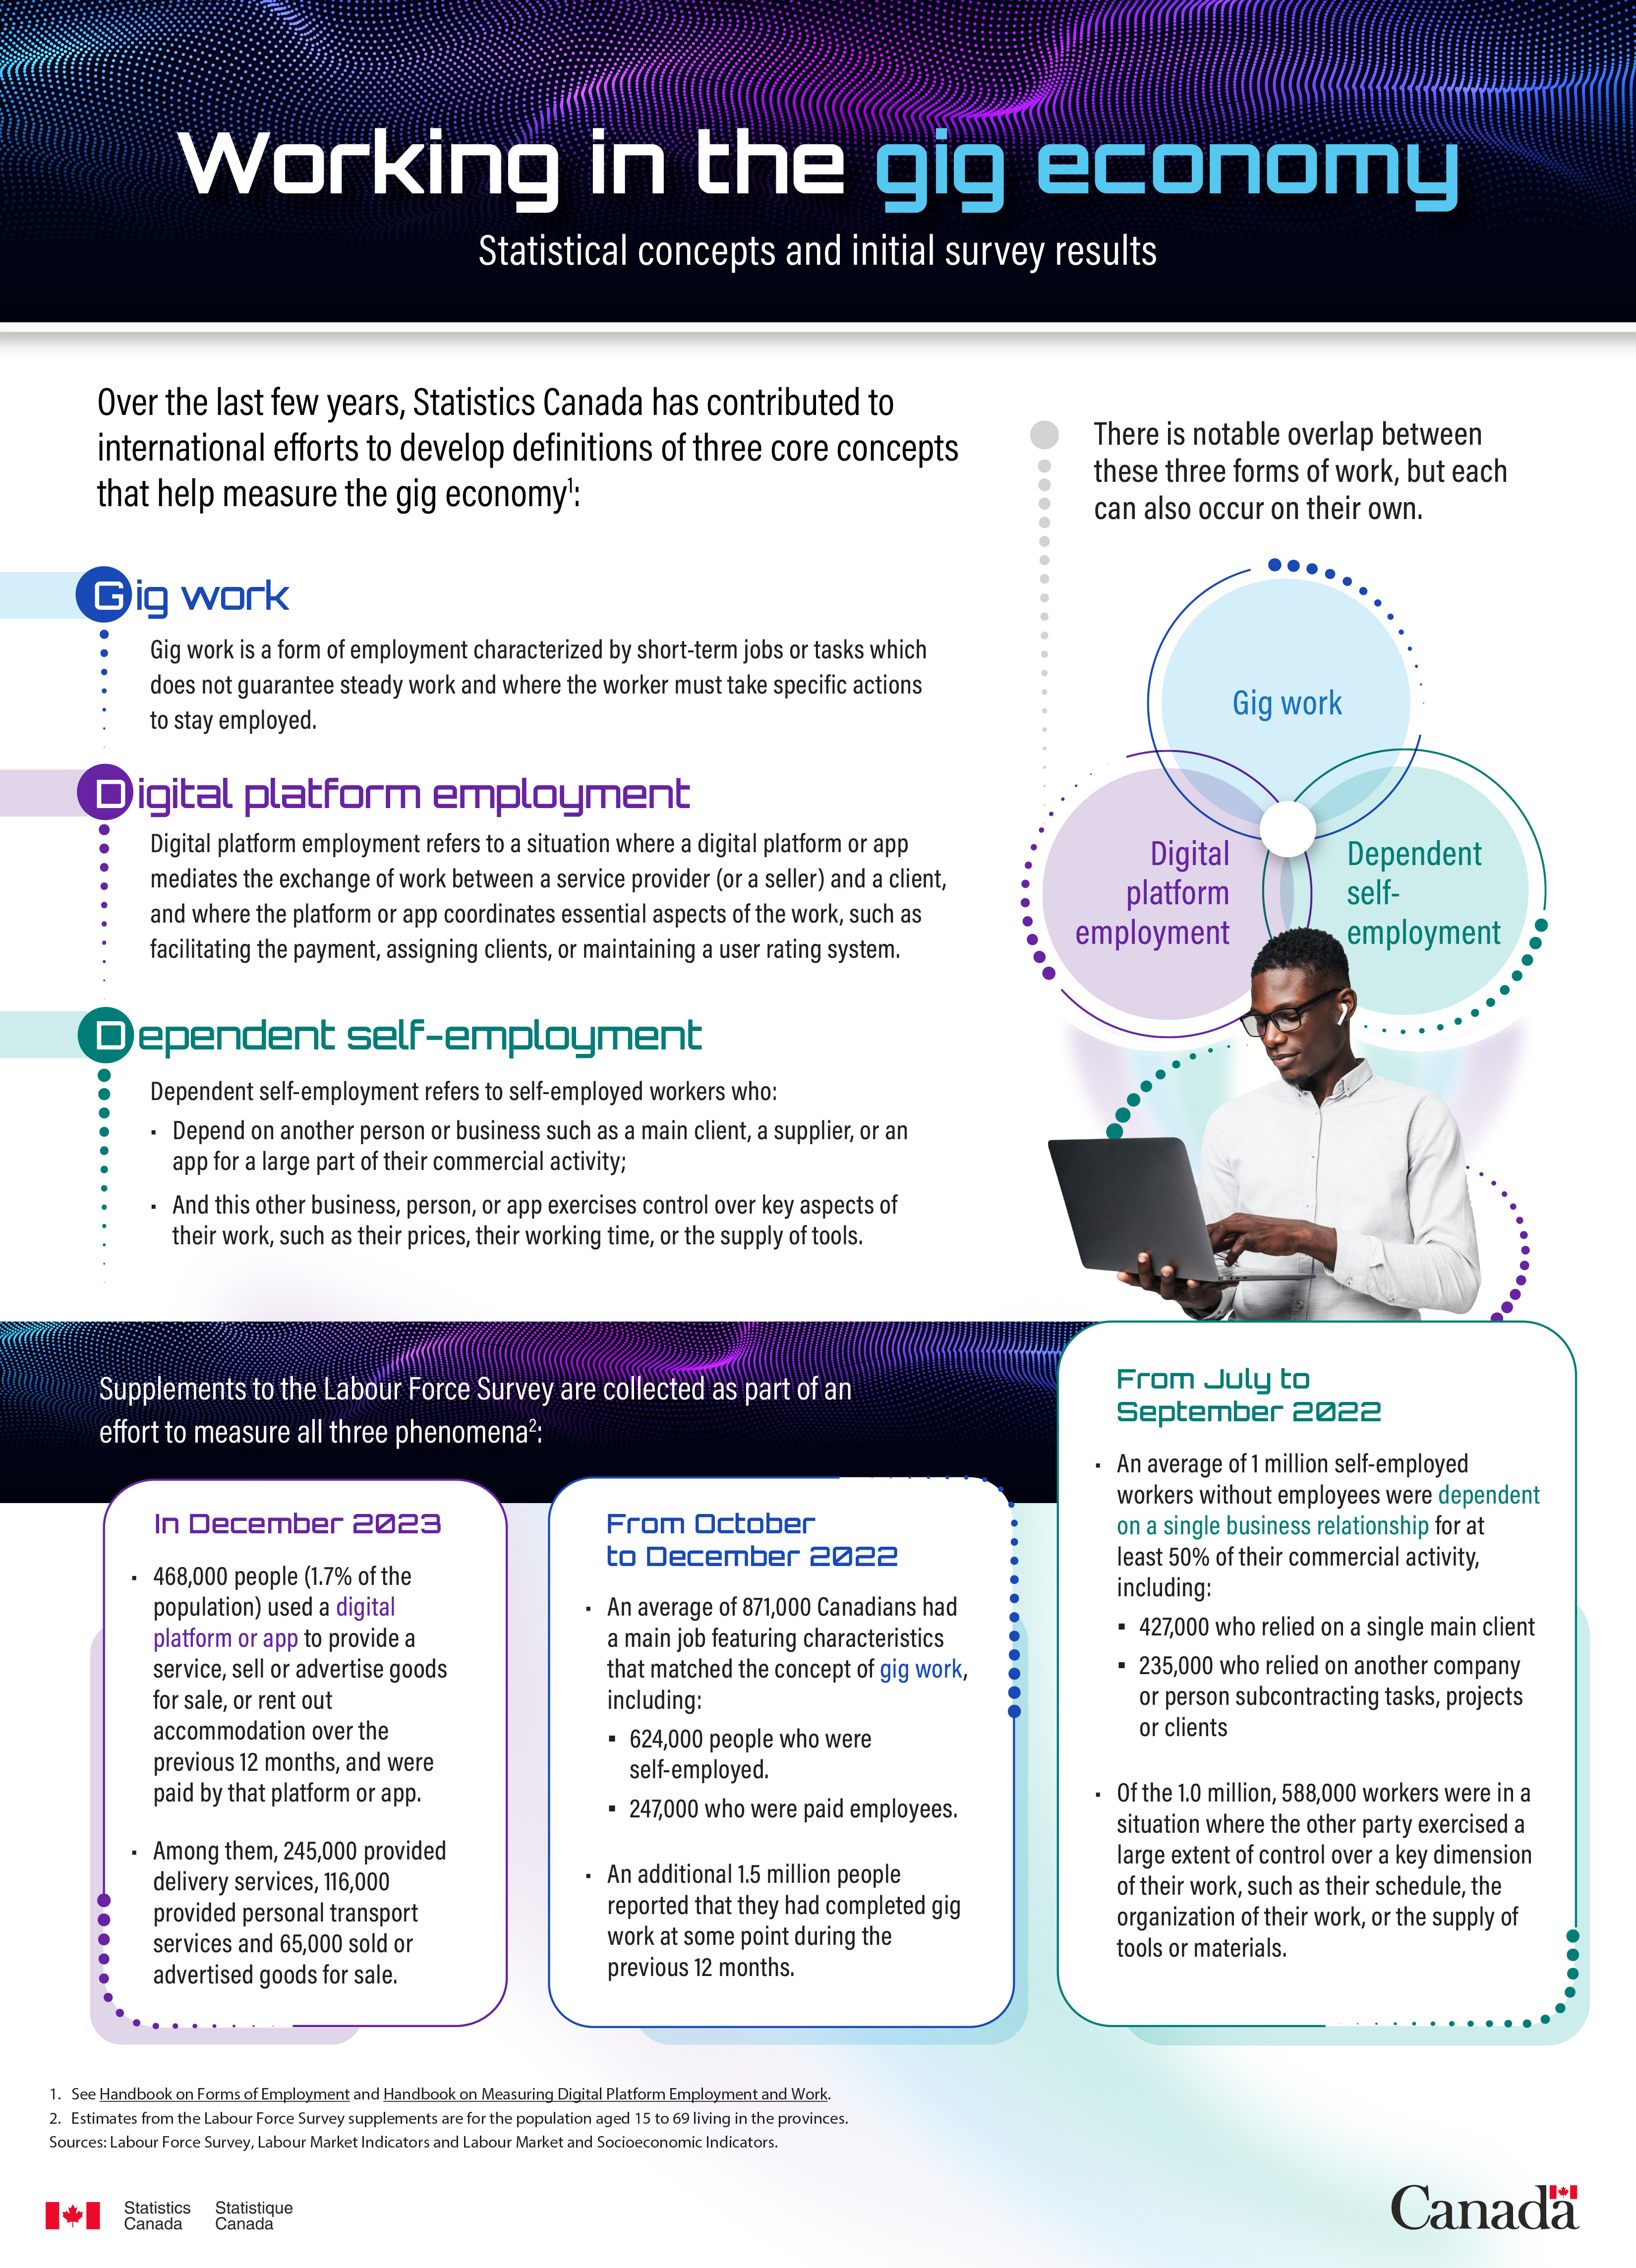
- The report in short
- Acronyms and abbreviations
- What is covered
- What we learned
- How to improve communications and dissemination
- Management response and action plan
- Appendix A - Field 4 divisions and their services
- Appendix B - The Eight Wastes of Lean
The report in short
The Strategic Engagement Field (Field 4) was created in 2019 as part of Statistics Canada's modernization agenda to help foster synergies and horizontal collaboration across the agency and to ensure integration of cross-cutting activities pertaining to the way statistical data and information were conveyed to Canadians. In this field, communications, dissemination and microdata access activities were organized into two branches: the Communications Branch and the Data Access and Dissemination Branch. Following the agency's recent organizational realignment exercise, which aimed at streamlining operations and better aligning resources, a decision was made to move the functions of Field 4 to other areas to enable greater synergies throughout the agency, as part of its evolving modernization journey.
The evaluation was conducted in accordance with the Treasury Board Policy on Results and Statistics Canada's Integrated Risk-based Audit and Evaluation Plan 2022/2023 to 2026/2027. The objective of the evaluation was to provide a neutral assessment of the design, delivery and relevance of the communications and dissemination activities of the Strategic Engagement Field (Field 4). The evaluation also identified some of the key risks, opportunities and lessons learned to consider moving forward during the restructuring. Data access and internal communications activities were excluded from the evaluation scope.
The evaluation methodology consisted of a document review and interviews, which were conducted with Statistics Canada employees, i.e., Field 4, subject-matter areas (SMAs) and regional offices (ROs). The findings outlined in this report are based on the triangulation of these data collection methods.
Given that the decision to restructure Field 4 was announced during the conduct phase of the evaluation, the recommendations are focused on addressing the foundational elements of the reorganization, leveraging the lessons learned from Field 4 to help support the transition of communications and dissemination activities to the new structure. The report also provides areas of consideration to improve the effectiveness and efficiency of both the communications and dissemination functions.
Key findings and recommendations
Since the creation of Field 4, communications and dissemination activities have shifted to a greater focus on engagement and user-centric service delivery. The field's structure enabled operational effectiveness within each of the units in the divisions, but in some instances, the lack of integration across divisions hindered overall efficiency. Despite some initial growth in capacity, Field 4 has experienced a substantial rise in workload burden since 2019, which has impacted both the well-being of its employees and the effectiveness of its service delivery.
Communications and dissemination activities were a shared responsibility between Field 4, SMAs and ROs. However, the lack of understanding around the roles of the Stakeholder Relations and Engagement Division and the Strategic Communications and Planning Division hindered the effectiveness and efficiency of some communications activities. Opportunities remain to improve integration between Field 4, SMAs and ROs through early involvement; better coordination tools; and a mutual understanding of and agreement on roles and responsibilities, including the role of the Communications Branch as the agency's functional authority for all communications activities.
Performance indicators have been developed for all Field 4 divisions. Metrics for access indicators were used by Field 4 to assess the effectiveness of its activities. While media monitoring reports were also used, the lack of awareness of some SMAs around metrics and limitations in demographic data lessens their usefulness for decision making. Performance metrics were not always updated or monitored consistently, and gaps were also noted in the use of certain operational and availability metrics. While service standards were established for each division, not all divisions monitored whether their service standards were met.
Communications and dissemination services supported the priorities of the agency and the initiatives of SMAs. While the Engagement Playbook provided guidance to SMAs in undertaking engagement activities, some wanted further support from Field 4. Overall, most internal users interviewed were satisfied with the communications and dissemination services provided by Field 4; however, some opportunities for improvement were identified.
Given that capacity, integration and coordination will remain key challenges, the restructuring of communications and dissemination presents an opportunity to reassess their core functions, redefine their roles and explore new ways to generate efficiencies. Change management, including ongoing communication, will be essential during the transition period. Performance measurement is also another area that could be strengthened in the future.
Recommendation 1
The Assistant Chief Statistician (ACS) of the Corporate Strategy and Management Field (Field 3) should ensure that the core functions of the Strategic Communications Branch, including the extent of its role going forward, are clearly determined by
- defining communications activities that each core function will, fully or in part, undertake itself, while
- engaging key internal partners, including all SMAs with Information Services (IS) positions, for input
- considering factors such as (but not limited to) value added, risk exposure and capacity of internal partners that could be leveraged
- developing a formal framework (e.g., directives, guidelines, gating process, roles and responsibilities of internal partners) to guide communications activities, and sharing it with internal partners.
Recommendation 2
The ACS of Field 3, in collaboration with the ACS of the Census, Regional Services and Operations Field (Field 7), should ensure that
- regular updates on the progress of the transition are provided to all employees
- employees directly impacted by the change are informed of the new direction of communications and dissemination and engaged for input during the transition period through various channels (e.g., townhalls)
- communications and dissemination services, including key contact information, processes for service requests and related service standards, are updated periodically and promoted through various channels.
Recommendation 3
The ACS of Field 3, in collaboration with the ACS of Field 7, should strengthen the performance measurement of their respective communications and dissemination activities by
- reviewing their respective performance measurement framework (e.g., performance information profiles, dashboards, strategic roadmaps) to ensure it aligns with the new structure
- leveraging existing data to enhance business intelligence and decision making, including providing guidance to internal partners (e.g., SMAs) to effectively use available information
- incorporating more operational efficiency metrics
- implementing a process to monitor service standards and satisfaction of internal users.
Acronyms and abbreviations
- ACS
- Assistant Chief Statistician
- CRMS
- Client Relationship Management System
- GBA Plus
- Gender-based Analysis Plus
- ICN
- Internal Communications Network
- IS
- Information Services
- ORCSD
- Official Release and Communication Services Division
- PSES
- Public Service Employee Survey
- ROs
- Regional offices
- SCPD
- Strategic Communications and Planning Division
- SIS
- Statistical Information Service
- SMA
- Subject-matter area
- SRM
- Service Request Management
- SRED
- Stakeholder Relations and Engagement Division
- SOPs
- Standard operating procedures
What is covered
The evaluation was conducted in accordance with the Treasury Board Policy on Results and Statistics Canada's Integrated Risk-based Audit and Evaluation Plan 2022/2023 to 2026/2027. The objective of the evaluation was to provide a neutral assessment of the design, delivery and relevance of the communications and dissemination activities of the Strategic Engagement Field (Field 4), and to identify key risks, opportunities and lessons learned to consider during the restructuring.
Strategic Engagement Field (Field 4)
Statistics Canada plays a critical role in providing leadership, stewardship and expertise to help Canadians navigate a data-fuelled world. Since 2010, Statistics Canada has increasingly adapted its communications and dissemination activities to meet the evolving expectations of data users in a rapidly changing digital landscape by leveraging social media (e.g., X [formerly known as Twitter], LinkedIn), modernizing its web technologies to enhance accessibility (e.g., New Dissemination Model initiative), and introducing new access points and visualization tools.
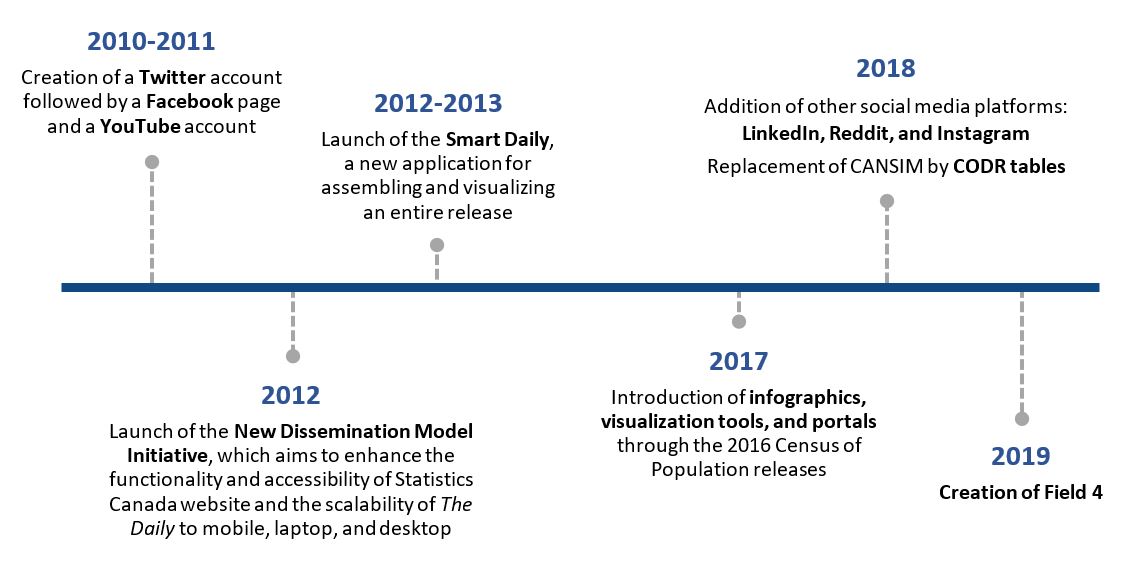
Description - Figure 1. Evolution of communications and dissemination activities
Figure 1 depicts the evolution of communications and dissemination activities in Statistics Canada, with a timeline that includes the following milestones:
- 2010-2011: Creation of a Twitter account followed by a Facebook page and a YouTube account
- 2012: Launch of the New Dissemination Model Initiative, which aims to enhance the functionality and accessibility of Statistics Canada website and the scalability of The Daily to mobile, laptop, and desktop
- 2012-2013: Launch of the Smart Daily, a new application for assembling and visualizing an entire release
- 2017: Introduction of infographics, visualization tools, and portals through the 2016 Census of Population releases
- 2018: Addition of other social media platforms: LinkedIn, Reddit, and Instagram. Replacement of CANSIM by CODR tables
- 2019: Creation of Field 4
While Statistics Canada continued to respond to the evolving needs of data users, three factors impacting the agency between 2018 and 2019 catalyzed the creation of Field 4 in 2019:
- Statistics Canada, through the pursuit of its modernization agenda, was seeking to establish itself as a trusted, leading source of information for Canadians through a broad-based approach, founded on strengthening stakeholder engagement and user-centric service delivery.
- Following news stories that reported that Statistics Canada had requested that several banks provide the personal financial transaction information of hundreds of thousands of Canadians in 2018, the agency faced public backlash. This incident sparked a need for the agency to have better crisis and issue management in place.
- The technology systems that supported engagement and publishing information, such as the legacy Client Relationship Management System (CRMS) and the Smart Daily system, were at their end-of-life stage.
In light of these factors, Field 4 was created with the mandate to transform how Statistics Canada engages and communicates with Canadians to maintain and promote public trust. To foster synergies and horizontal collaboration across the agency and to ensure integration of cross-cutting activities pertaining to the way data and information were conveyed to Canadians, Field 4 was formed by integrating multiple sections together under the same field and by creating new divisions to focus on specific priorities. Under the new structure, communications, dissemination and microdata access activities were organized into two branches: the Communications Branch and the Data Access and Dissemination Branch (refer to Figure 2).
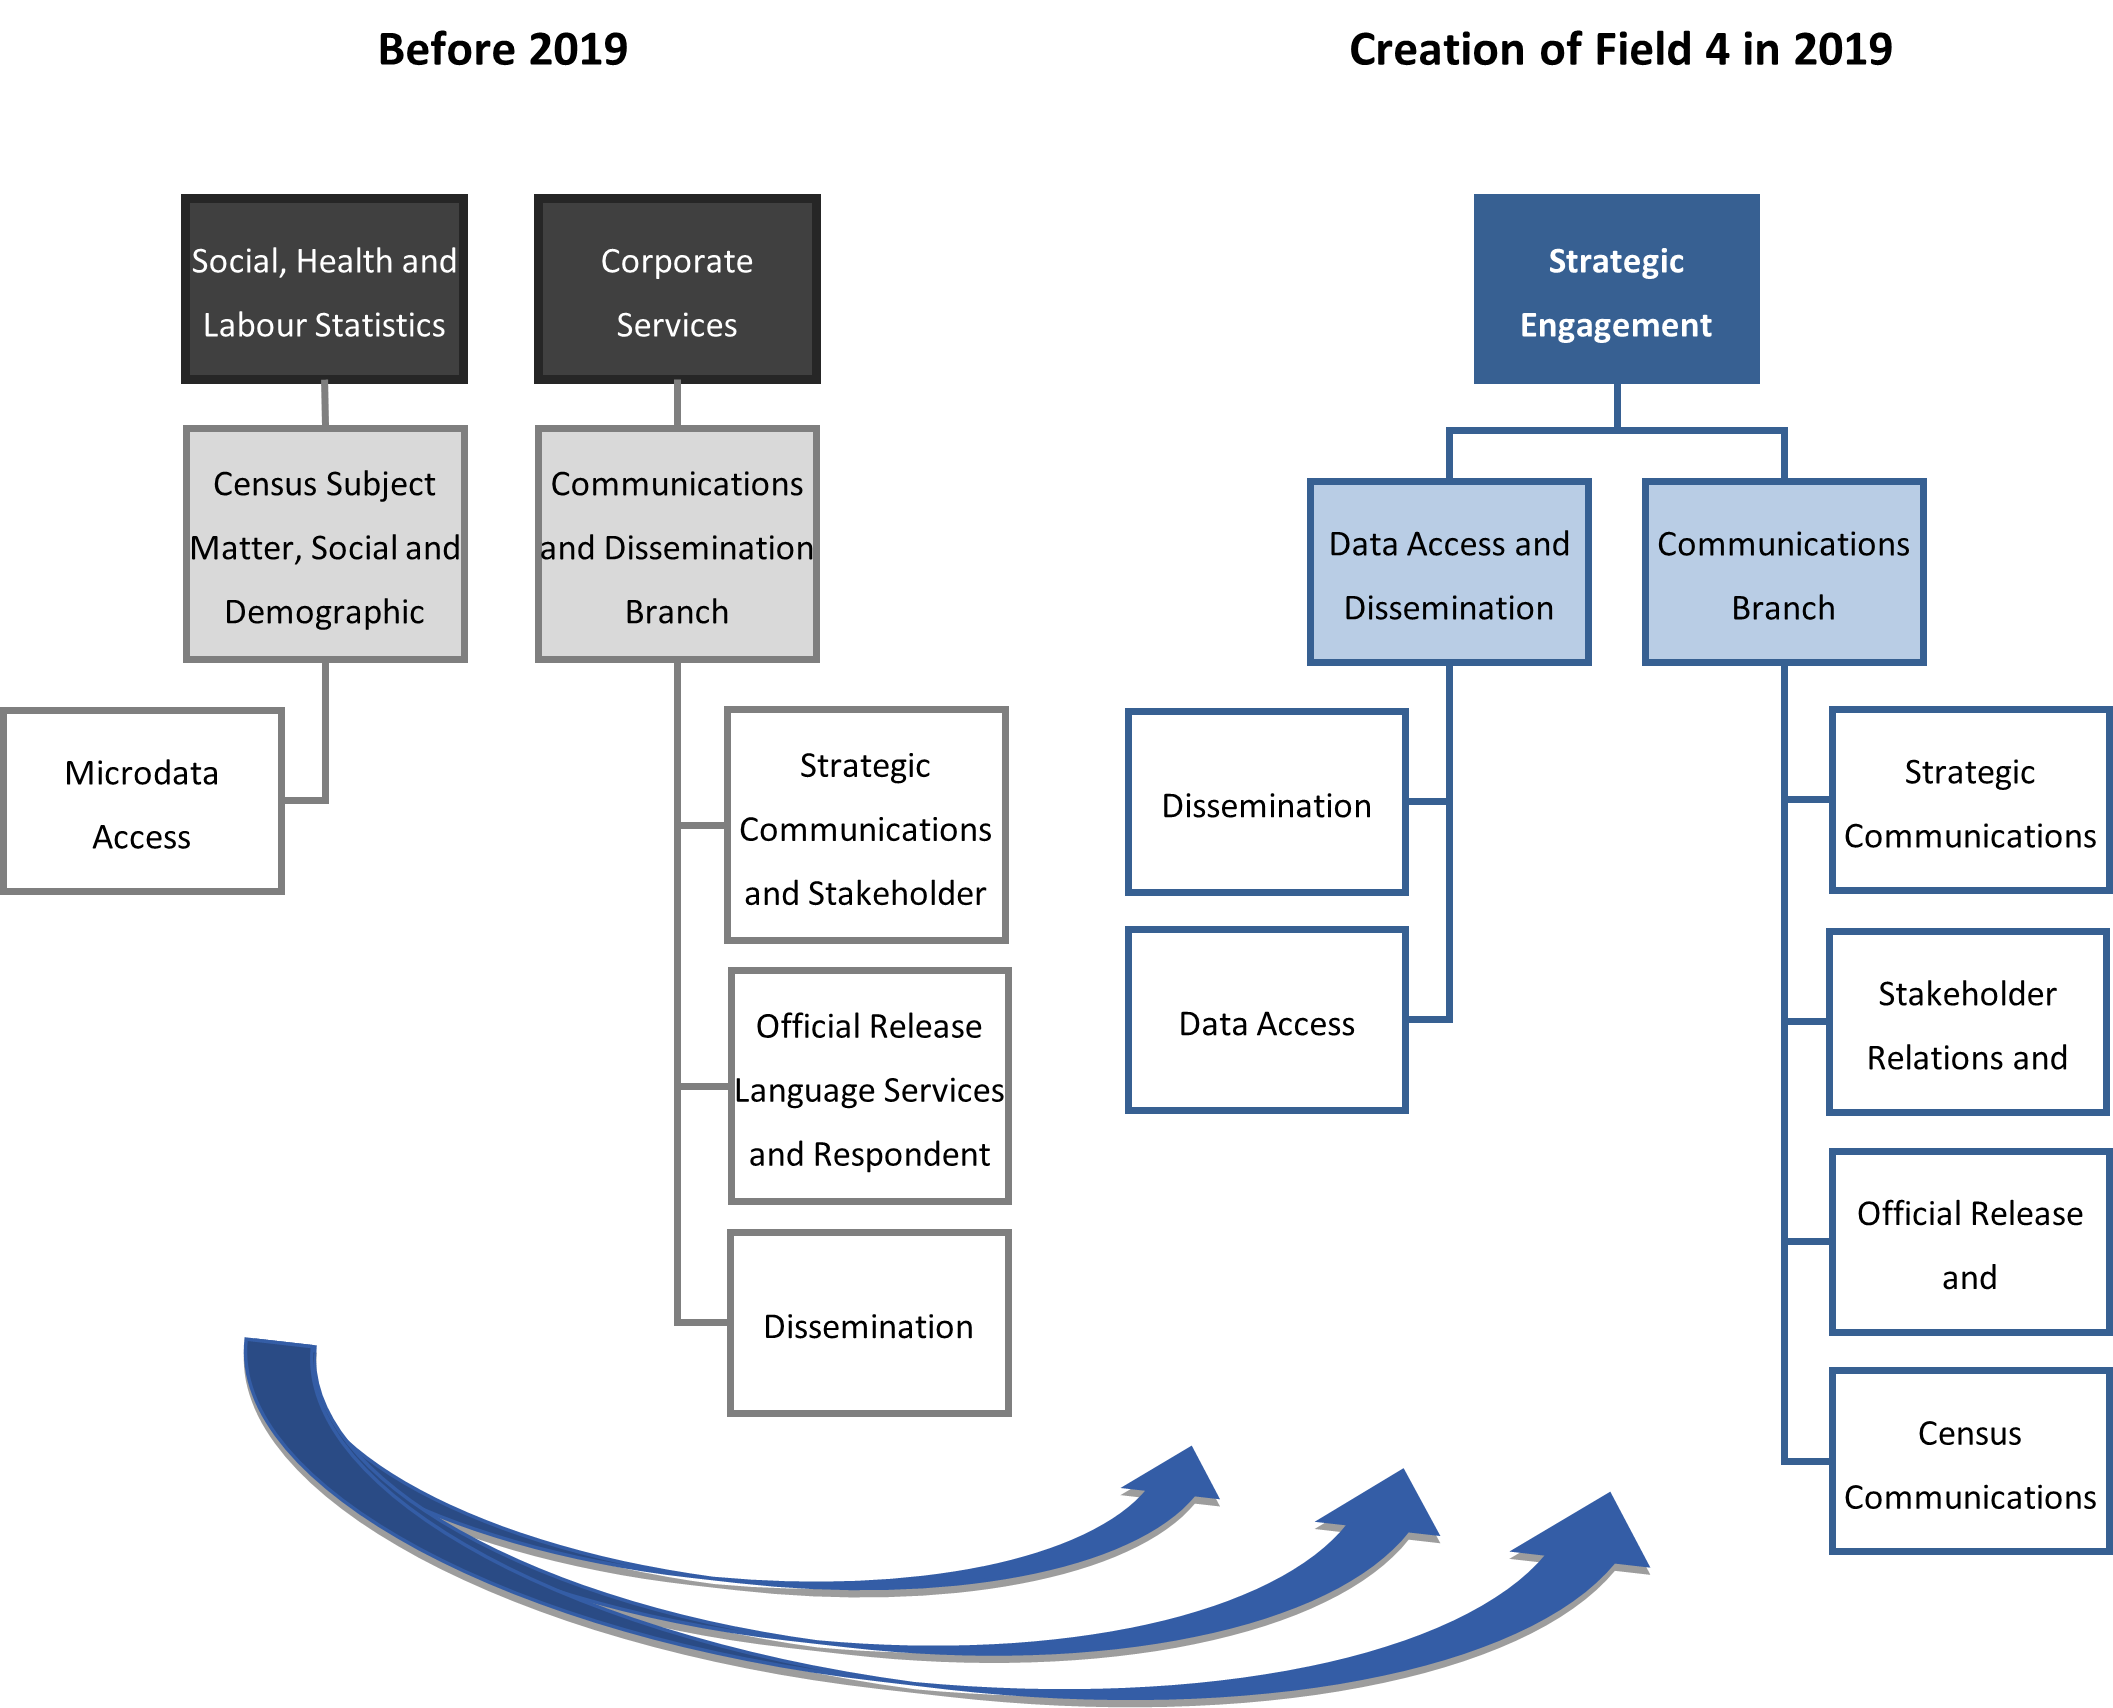
Description - Figure 2. Communications and dissemination before and after the creation of Field 4
Figure 2 depicts two organizational charts showing the structure of communications and dissemination before and after the creation of Field 4 in 2019.
Before 2019, Microdata Access was under the Census Subject Matter, Social and Demographic Statistics Branch within the Social, Health and Labour Statistics (Field 8). Strategic Communications and Stakeholder Relations, Official Release Language Services and Respondent Communications, and Dissemination were under the Communications and Dissemination Branch within the Corporate Services (Field 3).
After the creation of Field 4 in 2019, two new branches were created under the field: the Data Access and Dissemination Branch and the Communications Branch. Microdata Access (changed to Data Access) and Dissemination moved under the Data Access and Dissemination Branch. Under the Communications Branch, there were four divisions: Strategic Communications and Planning, Stakeholder Relations and Engagement, Official Release and Communication Services, and Census Communications.
Since its inception, the Field 4 transformation has been impacted by the COVID-19 pandemic and subsequent budget constraints. These factors have had a notable impact on the agency's ability to operate optimally. Following the agency's organizational realignment exercise, which aimed at streamlining operations and better aligning resources, the decision to move the functions of Field 4 to other areas was announced by the Chief Statistician on April 27, 2023. The move of the Dissemination Division to Field 7 and the Data Access Division to the Strategic Data Management, Methods and Analysis Field (Field 6) took effect in May 2023. The Communications Branch will reorganize its structure and join Field 3 in October 2023. The Statistical Information Service (SIS) from Field 7 will also join the branch (refer to Figure 3). The restructuring is seen as an opportunity to enable greater synergies throughout the agency as part of its evolving modernization journey.
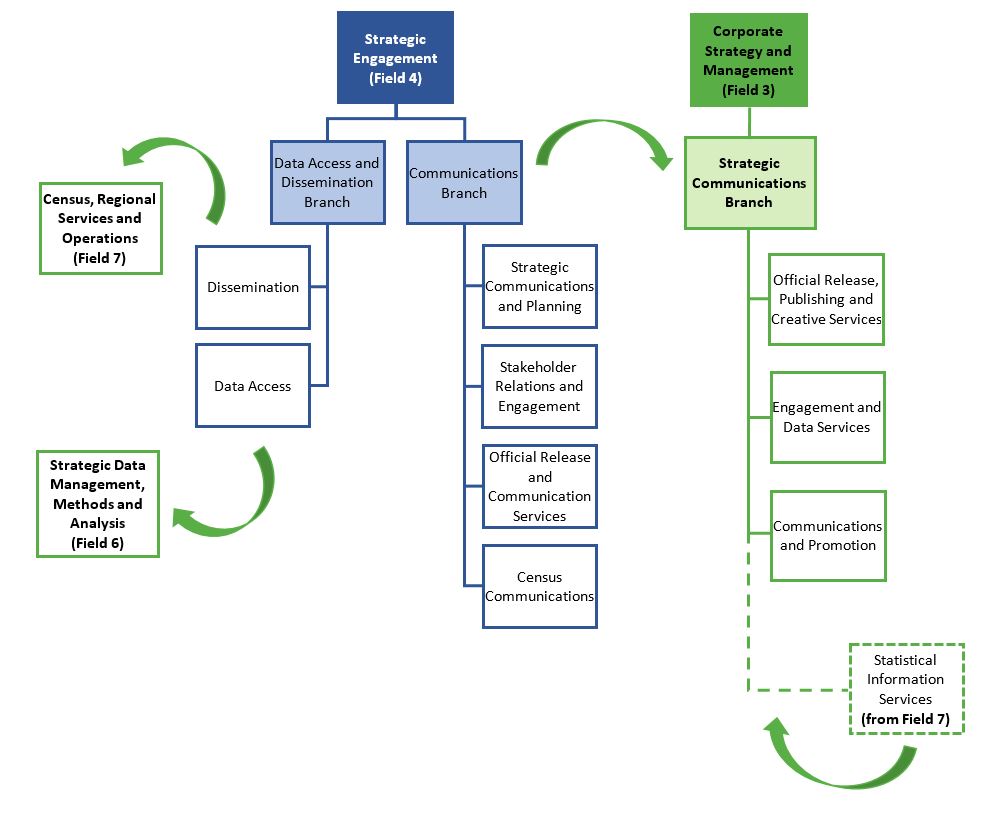
Description - Figure 3. Communications and dissemination after the restructuring of Field 4 in 2023
Figure 3 depicts Communications and Dissemination after the restructuring of Field 4 in 2023.
Before 2023, Strategic Engagement Field (Field 4) had two branches: Data Access and Dissemination Branch and the Communications Branch. Two divisions fell under the Data Access and Dissemination Branch: Dissemination and Data Access. Four divisions fell under the Communications Branch: Strategic Communications and Planning, Stakeholder Relations and Engagement, Official Release and Communication Services, and Census Communications.
After the restructuring of Field 4 in 2023, Dissemination moved under Census, Regional Services and Operations (Field 7) and Data Access moved under Strategic Data Management, Methods, and Analysis (Field 6).
The Communications Branch (changed to Strategic Communications Branch), going from four to three divisions, which are Official Release, Publishing and Creative Services; Engagement and Data Services; and Communications and Promotion, will join Corporate Strategy and Management (Field 3). Statistical Information Services will also join the branch.
The evaluation
The scope of this evaluation, determined in collaboration with Field 4 management, covered communications and dissemination activities since the creation of the Strategic Engagement Field (Field 4) in 2019. The evaluation considered the context of Field 4 since its inception, as well as its evolving role as a strategic enabler. Data accessFootnote 1 and internal communications activities were not examined as part of the scope, given the distinct nature of their processes. The evaluation was conducted from October 2022 to May 2023 and covered the services listed in Appendix A.
Given that the decision to restructure Field 4 was announced during the conduct phase of the evaluation, the recommendations are focused on addressing the foundational elements of the reorganization, leveraging the lessons learned from Field 4 to help support the transition of communications and dissemination activities to the new structure. The report also provides areas of consideration to improve the effectiveness and efficiency of both the communications and dissemination functions.
As outlined in Table 1, three evaluation issues were identified.
| Evaluation issues | Evaluation questions |
|---|---|
| 1. Design and delivery |
1.1. To what extent do the structure and capacity of Field 4 support the effective and efficient delivery of communications and dissemination services? |
| 2. Relevance | 2.1. To what extent do communications and dissemination services meet the needs of internal users? |
| 3. Moving forward | 3.1. What are the key risks, opportunities, and lessons learned moving forward? |
Guided by a utilization-focused evaluation approach, the data collection methods outlined in Figure 3 were used.
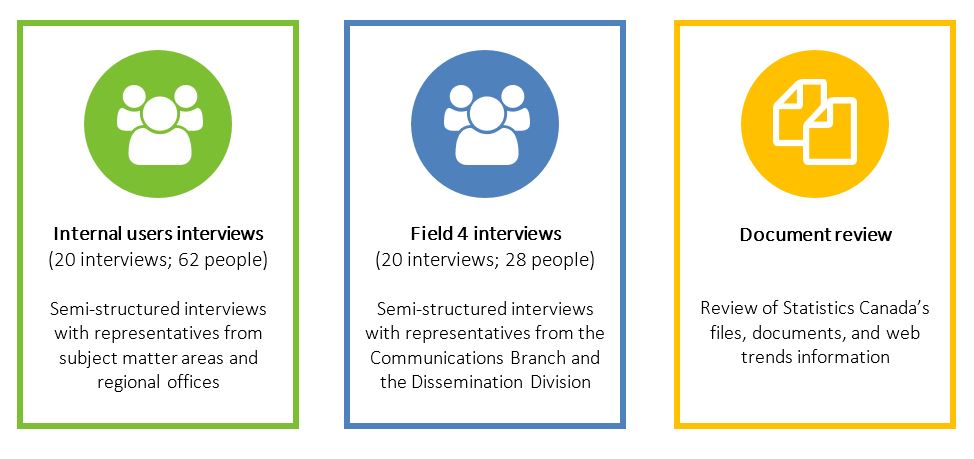
Description - Figure 4. Data collection methods
Figure 4 depicts the three data collection methods used for the evaluation: internal users interviews, Field 4 interviews, and document review.
The internal users interviews included semi-structured interviews with representatives from subject matter areas and regional offices. There were 20 interviews conducted with 62 people.
The Field 4 interviews included semi-structured interviews with representatives from the Communications Branch and the Dissemination Division. There were 20 interviews conducted with 28 people.
The document review included a review of Statistics Canada's files, documents, and web trends information.
Four main limitations were identified, and mitigation strategies were employed, as shown in Table 2.
| Limitations | Mitigation strategies |
|---|---|
| Interviews have the possibility of self-reported bias, which occurs when individuals who are reporting on their own activities and experience portray themselves in a more positive light. | The large number of interviewees enabled us to identify patterns within these groups and gave us the opportunity to get a comprehensive view and gain valuable insights from a broad spectrum of perspectives. |
| Some interviewees had not been in their roles for very long, hindering their ability to provide the full context for some interview questions. | The large number of interviewees enabled us to identify patterns, and additional information and context were provided in interviews, when needed. |
| During the interviews, it was noted that some internal users had limited knowledge of the communications and dissemination services offered by Field 4. Consequently, the evaluation did not proceed with the satisfaction survey of internal users; conducting a survey under these circumstances would have introduced biases and gaps in the data collected. | To ensure representation across all subject-matter areas, the number of interviews with internal users was increased and the interviews included the perspective of directors. This approach enabled the evaluation to gather more comprehensive information, compared with a survey. |
| Because not all internal users were involved with the Census Communications Division, information collected regarding the level of satisfaction for this division is limited. | The evaluation included information on Census Communications activities and the views of internal users only when relevant. |
What we learned
1. Design and delivery
Evaluation question 1.1
To what extent do the structure and capacity of Field 4 support the effective and efficient delivery of communications and dissemination services?
Summary
Since the creation of Field 4, communications and dissemination activities have shifted to a greater focus on engagement and user-centric service delivery. The field's structure enabled operational effectiveness within each of the units in the divisions, but in some instances, the lack of integration across divisions hindered overall efficiency. Despite some initial growth in capacity, Field 4 has experienced a substantial rise in workload since 2019, without a corresponding budget increase, which has impacted both the well-being of its employees and the effectiveness of its service delivery.
For most Field 4 interviewees, the structure of their own unit and division enabled them to deliver effectively. However, enhancing integration between divisions would have yielded greater overall efficiency.
Most Field 4 interviewees expressed that the structure of their own division was conducive to effective service delivery, as each unit was able to specialize in specific activities. From a field-wide perspective, however, almost all Field 4 interviewees noted that greater integration between divisions would have yielded greater efficiency. Given the interdependencies of some communications and dissemination services, their delivery often relies on cross-divisional collaboration. However, some instances of duplication and inefficiency were noted by Field 4 interviewees, especially for urgent requests or large projects involving multiple teams from different divisions (for example, a team working on a task while unaware that it has already been completed by another team, or a division being assigned tasks that do not fall within its regular operations, leading to time wasted in reassigning the work to the right group). Some interviewees also reported challenges and delays in obtaining information from other divisions necessary for the execution of their tasks.
Since the inception of Field 4, communications and dissemination activities have shifted to a greater focus on engagement and user-centric service delivery. Considerable effort was also made by the field to strengthen the capacity of the infrastructure that supports communications and dissemination services through technological upgrades and developments.
In line with its mandate, Field 4 was called upon to play a greater strategic role in positioning the agency as a trusted data steward and leading source of statistical information, as opposed to the more transactional role of communications and dissemination in the past. This new orientation presented a culture shift across the field and the agency.
Progressively over the first few years, communications and dissemination activities shifted toward a greater focus on engagement and user-centric service delivery. Some of the key activities carried out by Field 4 in 2020 included the re-energization of the Trust Centre, originally created to address the concerns of Canadians regarding the privacy and security of their personal information, and the launch of the Purpose-based Engagement Strategy, along with its Engagement Playbook, to guide engagement and outreach activities across the agency. Recognizing that storytelling has become an essential component of effective communication in today's digital era, Field 4 also promoted the use of innovative narrative techniques to turn data into compelling stories. New communication channels, such as podcasts (the Eh Sayers podcast), and new dissemination platforms (StatsCAN Plus and the StatsCAN app) were leveraged to reach a wider audience and facilitate storytelling.
Although some Field 4 and subject-matter area (SMA) interviewees noted limitations and inefficiencies in some of the agency's technological tools for communications and dissemination, considerable efforts were made by Field 4 to build and improve the capacity of the infrastructure supporting communications and dissemination activities. Examples of technological upgrades and new developments led by Field 4 included the following:
- In collaboration with multiple partners within the agency, CRMS was developed to improve and unify the agency's client service delivery. Using a phased approach, the development of the system included different modules and a Client Experience Index. However, there was a scaling back of the original scope, and the updated CRMS was not fully implemented or available to everyone.
- The Smart Daily system, based on aging technology, is extremely vulnerable. Its redesign began in 2018 but has encountered delays. However, the early work enabled the quick implementation of StatsCAN Plus in the Official Release Publishing System and the StatsCAN mobile application. This upgrade improved the system's capacity to support storytelling and visual elements. A plan is also in place to decommission the current Smart Daily in 2024/2025.
- StatsCAN Plus is a new communications vehicle that complements The Daily. Averaging approximately 19,000 views in November 2022, it supports content publishing at different times of the day, as well as storytelling and visual elements. The StatsCAN app is a new platform to visualize The Daily and StatsCAN Plus articles.
- The Language Services Portal was launched internally by Field 4 to better manage translation and editing requests from internal users.
Despite an initial increase in capacity, Field 4 has continued to experience a substantial rise in workload since 2019 related to intrinsic and external factors, including the ongoing pandemic, the introduction of new initiatives and products, an escalation in the number of incoming requests, and the lack of a corresponding budget increase. These challenges impacted the well-being of employees, as well as the effectiveness of the field's service delivery.
Since its inception in 2019, there has been an increase in the number of Field 4 employees, mainly because of the addition of its two new divisions, the Stakeholder Relations and Engagement Division (SRED) and the Strategic Communications and Planning Division (SCPD), and census projects in 2021 and 2022, which required more temporary employees. In parallel, demands for communications and dissemination services continued to increase rapidly over the period.
While there had already been steady growth in demand for communications and dissemination services since 2019, the COVID-19 pandemic intensified that growth in both volume and breadth of services. For example, before the pandemic, the maximum word count for The Daily was around 2,000 words, but it was increased to 7,000 words for major releases during the pandemic. The increase in the number and length of publications was later fuelled by the prominence of the 2021 Census of Population releases. During that period, the number of social media posts almost doubled, and there was an increased demand for portals and Common Output Data Repository tables. Moreover, the introduction of additional release vehicles (StatsCAN Plus, StatsCAN app) and changes to the agency's Policy on Official Release also led to additional writing and editing work, which put a strain on the resource capacity of the Official Release and Communication Services Division (ORCSD). Throughout this period, Field 4 capacity was overstretched.
The combination of all these factors, including difficulties in retaining and hiring talent with the right skills, as well as the hiring process itself, led to capacity challenges within some sections of Field 4, particularly the Social Media Section and ORCSD, since their services were among the most solicited across the agency. Field 4 interviewees reported that the high volume of work increased stress among staff, which led to high levels of turnover, sick leave and overtime. Many also recognized that the workload distribution among units was not well balanced; some even questioned the resource allocation within the field and its sustainability. Based on the results of the 2020 Public Service Employee Survey (PSES),Footnote 2, which was conducted from November 2020 to January 2021, the main factors causing stress at work for Field 4 employees also reflected matters related to capacity (see Chart 1).
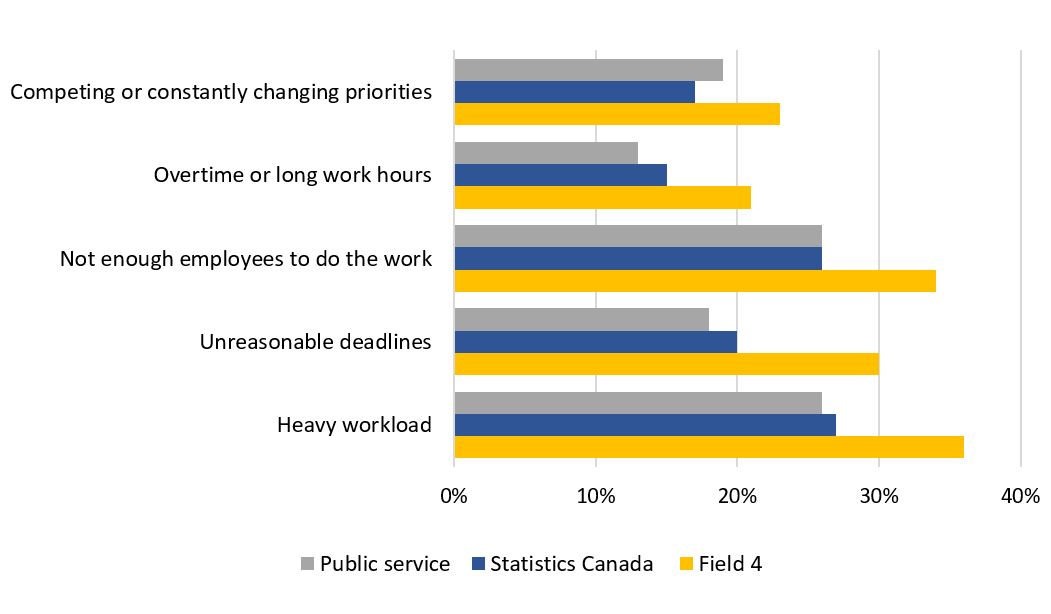
Description - Chart 1. Key factors causing stress at work for Field 4 employees
Chart 1 depicts a bar chart showing key factors causing stress at work for Field 4 employees in comparison to the agency and the public service.
Based on the chart, Field 4 employees experience these stressors to a greater extent than those from the agency and the public service.
The 5 key factors causing stress at work for Field 4 include:
- Heavy workload (36%), which is higher than Statistics Canada (27%) and the public service (26%)
- Not enough employees to do the work (34%), which is higher than Statistics Canada (26%) and the public service (26%)
- Unreasonable deadlines (30%) which is higher than Statistics Canada (20%) and the public service (18%)
- Competing or constantly changing priorities (23%) which is higher than Statistics Canada (17%) and the public service (19%)
- Overtime or long work hours (21%) which is higher than Statistics Canada (15%) and the public service (13%)
For many interviewees, despite the rising number of publications, the limited capacity within Field 4 impeded its ability to fulfill growing demands. Field 4 introduced various strategies to provide data, alleviate pressure and streamline the agency's publishing approach. Following the agency's organizational realignment exercise, a decision was made to move the functions of Field 4 to other areas of the agency.
Since 2020, certain units have had to make difficult decisions, such as limiting certain communications and dissemination activities to alleviate pressure on their employees. The pressure further intensified in July 2022, compelling Field 4 to reinforce a word-count limit for The Daily articles, reintroduce a limit on the number of The Daily releases (seven per day), and impose a cap on services and reduce investment in areas like CRMS and the Official Release Publishing System. The impact of these measures on service delivery was noted by internal users. To help address this situation, Field 4 introduced the Connecting with Canadians strategy, which focused on user centricity (i.e., increasing reach, relevance, timeliness and access by providing data in multiple formats, at different times of day) and streamlining the agency's publishing approach. From 2022 to 2023, the agency entered a period of austerity, which led to a series of spending reduction measures, further increasing the pressure on the resource capacity of Field 4. Following the agency's organizational realignment exercise, which aimed at streamlining operations and better aligning resources, a decision was made to move the functions of Field 4 to other areas to enable greater synergies throughout the agency as part of its evolving modernization journey.
Evaluation question 1.2
To what extent are key communications and dissemination activities coordinated and managed effectively and efficiently at the agency-level?
Summary
Communications and dissemination activities were a shared responsibility between Field 4, SMAs and regional offices (ROs). However, the lack of understanding around the roles of SRED and SCPD hindered the effectiveness and efficiency of some communications activities. Opportunities remain to improve integration between Field 4, SMAs and ROs through early involvement; better coordination tools; and a mutual understanding of and agreement on roles and responsibilities, including the role of the Communications Branch as the agency's functional authority for all communications activities.
From an agency-wide perspective, communications and dissemination activities were a shared responsibility between Field 4, SMAs and ROs.
Field 4 assumes a large range of responsibilities, all aimed toward delivering user-centric services, maximizing reach to target audiences, fostering trust, and ensuring that the agency's communications and dissemination practices remain consistent and effective. To do so, Field 4 brings a variety of specialized skills and expertise in messaging, engagement, branding, dissemination and strategic communications, as well as its knowledge of best practices and public sector standards and policies.
SMAs are responsible for the quality and relevance of the data they disseminate. Some SMAs have dedicated employees assigned to communications and dissemination activities, while others rely heavily on the expertise of Field 4; the size of the division, the standing of their surveys (i.e., mission-critical programs) and the number of releases tend to be determining factors. SMAs with dedicated communications and dissemination resources tend to coordinate more effectively within their own divisions, have better follow-up on critical matters and be more knowledgeable of Field 4 services.
ROs serve as the liaison between headquarters and external stakeholders (e.g., data users) within their regions. When working with Field 4, ROs bridge the gap between national strategies and regional nuances because they understand the specific needs of their local stakeholders. When working with SMAs, they connect them with local stakeholders. ROs also provide support in planning local events and training, developing data products, and addressing user inquiries.
Roles, responsibilities and accountabilities within Field 4 were clearly defined and understood for legacy services; however, those of SRED and SCPD were not clearly understood for some internal users, which added work burden and created friction.
Familiarity with available communications and dissemination services and understanding of the roles and responsibilities of each Field 4 division are predominantly influenced by internal users' experience with those specific services and divisions. Hence, for legacy services, such as those provided by ORCSD and the Census Communications Division, internal users understood the roles, responsibilities and accountabilities between their divisions and Field 4 regarding communications and dissemination activities.
However, there was a lack of clarity and understanding around the roles, responsibilities and accountabilities of SCPD and SRED for some interviewees. For example, interviewees from SMAs and Field 4 noted a lack of awareness regarding the role of SCPD as the primary point of contact or front door for accessing services offered by Field 4, despite the SCPD's mandate being outlined on the Internal Communications Network (ICN). That said, SCPD did not have the capacity to fully take on this role because of a staff shortage.
While one of the key roles of SRED was to foster relationships with a vast array of stakeholders, SMAs and ROs also had a part to play in stakeholder engagement. However, because there was a lack of understanding regarding the responsibilities of SRED for engagement and outreach, the boundaries of its role and those of ROs and of a few SMAs sometimes got blurred. This occasionally led to contact burden on external stakeholders. For example, a few interviewees noted that some external data users were contacted by representatives from Field 4, ROs and SMAs on the same topic, separately. For these interviewees, not having the CRMS module fully implemented also exacerbated this issue.
Another example highlighted as an area of challenge by some interviewees from both Field 4 and SMAs pertained to the engagement process with media stakeholders. While SRED plays a key advisory role in media relationship management, there were instances where SMAs engaged directly with the media without notifying SRED in advance. For these few SMAs, engaging directly with the media enabled them to be more responsive to inquiries and build long-term relationships. From the perspective of Field 4, however, the trade-off for expediency in not engaging SRED earlier on increases the risk to the agency's reputation.
While the roles and responsibilities of SRED and SCPD were articulated on the ICN and internal documents, there were grey areas in activities within the Communications Branch that were never agreed upon or operationally clarified, creating some friction and additional burden. For instance, some groups felt that they had to provide support on various communications products that did not belong to them (e.g., writing emails on behalf of SMA senior management) because of a lack of capacity within the Communications Branch. A few SMA interviewees also mentioned that the lack of clarity regarding roles and responsibilities led to confusion concerning the required level of approval and the authority responsible for granting approval in certain projects.
While there were mixed views, some SMA interviewees reported seeing the value added of SCPD and SRED and noted positive experiences working with them, such as adding a strategic component to their work and responding to requests efficiently. For a few Field 4 interviewees, working in a virtual environment at the time did not facilitate the understanding of roles and responsibilities, even within the same group.
Planning and decision-making processes are in place for communications and dissemination activities. While prioritization at the operational level for frontline communications activities was identified as a challenge, a tier system was being explored by the Communications Branch to manage production and workflow.
Many Field 4 interviewees reported that input from SMAs and, to some extent, ROs was solicited and considered during their planning and priority-setting processes, through the Data Out: Services, Access, Dissemination and Communication Committee; the Editorial Board; scrum meetings; working groups; and client meetings. The Data Out: Services, Access, Dissemination and Communication Committee, composed of representatives from the Communications Branch, Dissemination Division and SMAs, supports the agency in optimizing access to and use of the information it produces. Led by Field 4, the Editorial Board is a monthly meeting of directors from all fields to discuss, strategize and provide guidance on how to communicate the agency's data and strategic narrative in a consistent and thoughtful manner, while considering current events, public policy needs and other trends. It provided an opportunity for SMAs and Field 4 to collaborate, identify priorities and share information.
Planning and decision-making processes vary based on the nature of the activities involved. Project-based communications and dissemination activities allow for more time to establish plans and charters (e.g., census communications), while frontline communications and dissemination activities (e.g., publishing, official release) tend to focus on mission-critical programs (e.g., Labour Force Survey, census cycle) and hot topics (e.g., media relations). A few Field 4 interviewees also reported prioritizing requests from the Chief Statistician, as well as those related to funding initiatives (e.g., Treasury Board submissions) or agency-wide priorities (e.g., Disaggregated Data Action Plan).
Some of the Field 4 interviewees who engaged in frontline communications and dissemination activities raised concerns regarding their limited ability to push back or negotiate timelines when they receive requests, many of which are labelled as high priority. This string of continuous competing demands highlights the necessity to clarify priorities at the operational level. However, the Communications Branch was working to minimize overproduction by developing a tier system for service offerings by ranking them as gold, silver or bronze to help internal users learn what to expect at each level and to help manage their workflow. A guideline was also developed by SCPD to redirect efforts around access to information and privacy requests.
For Field 4 interviewees involved in other communications and dissemination activities, some mentioned that they generally defer to their management or committees to decide which request should be prioritized, while others said that they negotiate timelines with SMAs. Another group mentioned that it had a team dedicated to reviewing requests, triaging them and establishing priorities.
Collaboration and information-sharing mechanisms are in place to support communications and dissemination activities. However, opportunities remain to improve integration between Field 4, SMAs and ROs through early involvement; better coordination tools; and a mutual understanding of and agreement on roles and responsibilities, including the role of the Communications Branch as the agency's functional authority for all communications activities.
Collaboration and information sharing are fostered through the different aforementioned forums (i.e., the Data Out: Services, Access, Dissemination and Communication Committee; the Editorial Board; scrum meetings; working groups; and client meetings); most interviewees reported overall good cooperation between the representatives of Field 4, SMAs and ROs who attended these forums. That said, ensuring broad representation from all relevant fields and securing their attendance were not always easy. Moreover, ensuring the alignment of topics and exchanges with the diverse interests of all participants, especially for the Editorial Board, also proved to be a challenge. Nevertheless, interviewees still considered the Editorial Board as the right mechanism to foster collaboration and information sharing between Field 4, SMAs and ROs. Following a succession of recalibrations and periods when its activities were put on hold, the Editorial Board was reinstated in 2022. During the period in which its activities were paused, interviewees noted that there were no similar avenues for Field 4, SMAs and ROs to collaborate and share information. To reinforce coordination and information sharing between communications and dissemination and their internal partners, these existing mechanisms could be further examined to determine whether they could be better leveraged after the restructuring.
Despite having these collaboration and information-sharing mechanisms, several interviewees identified that the siloed culture within each group (i.e., Field 4, SMAs and ROs) still persisted even when they were engaged in collaborative work. Many interviewees felt that being involved earlier in the process would enhance collaboration, group synergy and common knowledge. For instance, when Field 4 launched communications initiatives to commemorate awareness months or other important occasions (e.g., Black History Month, Asian Heritage Month), some SMAs felt that if they had been involved earlier in the process, these initiatives would have been more impactful, because it would have given them time to extract specific data and synchronize their publication with the launch of the communication initiative. Another example is involving the Dissemination Division earlier, rather than in the final stages of the release, given its knowledge of tools, the behaviours of target audiences and potential releases involving similar topics.
When responding to external requests (e.g., Canadians requesting information or data through social media, the Media Hotline and the Contact Us service), ROs and some groups within the Communications Branch had difficulty at times in distinguishing nuances between products and identifying the appropriate SMA contact, often resulting in unnecessary hand-offs between functions. In this regard, it was suggested that information sessions led by SMAs on their products would help fill this gap. Some SMA interviewees also suggested the implementation of a tracking tool within the Communications Branch to capture inquiries because they have observed recurring requests from different areas within the agency.
Some SMAs have positions (i.e., Information Services [IS] positions) within their division or branch that are dedicated to communications activities. In some cases, these positions also include other responsibilities (e.g., client services), but most play an active role in planning and coordinating the communications and dissemination activities for their division or branchFootnote 4. There were mixed views on the legitimacy of these positions; for SMAs that have them, incumbents in these roles have a greater understanding of the business lines of the SMAs and can better convey specialized requirements to Field 4. In their view, this facilitates collaboration between the two groups and expedites delivery of communications and dissemination services. Moreover, SMAs also believe that these positions contributed to filling some of the capacity gaps encountered in Field 4 and to serving as the liaison between the different units within Field 4 (noting the lack of communication between units within Field 4). From the perspective of Field 4, however, some interviewees perceive these positions as redundant, and consider whether it would best to centralize all IS positions within Field 4. For these Field 4 interviewees, incumbents are often unaware of established guidelines and fail to adhere to them because these IS positions reside outside Field 4. Consequently, addressing these instances added burden to the workload of Field 4. Because this practice has both positive and negative implications, it should be further explored during the restructuring of the field, while recognizing at the same time that the Communications Branch remains the agency's functional authority for all communications activities.
ROs play a unique role in engagement by enabling communications and dissemination activities to be more targeted to the specific needs of data users across Canada. With the SIS being integrated into the Communications Branch, there is an opportunity to enhance cohesion between these groups.
ROs play a key role in engagement, as they serve as entry points to the agency across Canada. They are responsible for data collection, respondent relations, advisory services and data user support, and promotion of Statistics Canada products and services either through national campaigns or regional activities and newsletters. One of their key elements for engagement is the SIS, a central hub for general inquiries located in Montréal. The SIS is dedicated to responding to general questions and data requests regarding pre-existing published statistical information from across Canada. For more complex inquiries, it helps connect the client with the appropriate RO or SMA representative.
Given their familiarity with the particularities of their region and the solid network of local contacts they have developed over the years, ROs enable communications and dissemination activities to be more targeted to the specific needs of data users across Canada. For instance, they are recognized as key players in supporting local event planning and connecting SMAs with regional stakeholders. Their role in the development of CRMS was also instrumental, as they are one of the main users. To ensure effective collaboration and information sharing, ROs participate in the Editorial Board and have other communications exchanges with SMAs to promote their products in the regions. A cross-regional committee is also implemented to ensure consistency.
Most of the interviewees indicated that ROs are not systematically integrated in the communications and dissemination processes; most of the time, they are engaged at a later stage, often after the national strategy has been formulated. Because of this lack of early involvement, the ROs perceived that Statistics Canada's messaging was inadequately regionalized, primarily because of the absence of disaggregated data at the regional levels. Moreover, like SMAs, ROs do not fully understand the role of some sections of Field 4, and they feel that headquarters somewhat understands the potential role of ROs to support communications and dissemination activities. For ROs, having employees from different regions involved in communications and dissemination activities is crucial because of their profound understanding of the local context and challenges. For them, this will enable the agency to better communicate with regional users and bridge the gap between headquarters and ROs.
Evaluation question 1.3
To what extent are performance measurements in place and being used to inform decision-making?
Summary
Performance indicators have been developed for all Field 4 divisions. Metrics for access indicators were used by Field 4 to assess the effectiveness of its activities. While media monitoring reports were also used, the lack of awareness of some SMAs around metrics and limitations in demographic data lessens their usefulness for decision making. Performance metrics were not always updated or monitored consistently, and gaps were also noted in the use of certain operational and availability metrics. While service standards were established for each division, not all divisions monitored whether their service standards were met.
Performance indicators have been developed for all Field 4 divisions and comprise access, operational and availability indicators. Some of these access and availability indicators are also reported in Statistics Canada's expenditure plans.
Field 4 has developed a set of performance indicators for each of its divisions. They consisted of a combination of access, operational and availability indicators, tailored according to the nature of the work of each division.
- Access indicators, which are focused on the effectiveness of communications and dissemination activities, primarily aim to measure reach (e.g., number of visits to the Statistics Canada website, number of StatsCAN app downloads).
- Operational indicators are more focused on the effectiveness and efficiency of the communications or dissemination service delivery itself (e.g., number of words translated, number of client consultations conducted).
- Availability indicators apply only to the Dissemination Division and ORCSD and pertain to the number of data products created and published (e.g., infographics, data tables, videos).
Some of the access and availability indicators of Field 4 are also reported in Statistics Canada's departmental reports (i.e., departmental plans and departmental results reports), such as the number of statistical products available on the website, the number of visits to the Statistics Canada website and the number of interactions on social media.
Metrics for access indicators, complemented by media monitoring reports, are used by Field 4 to assess the effectiveness of its communications and dissemination activities and to adjust its strategy as needed. While internal users also have access to media monitoring reports, many noted that the lack of demographic data lessens their usefulness to inform decision making.
Metrics for these performance indicators are tracked by Field 4 using monthly dashboards and the editorial calendar. Metrics for the access indicators in particular are used by Field 4 to assess the effectiveness of its communications and dissemination activities and to subsequently adjust its strategy if needed (for example, determining whether the recent promotion of a hub through social media was effective in increasing the number of visits to that hub in the following months).
Some interviewees from Field 4 and SMAs also used media monitoring reports (e.g., reports from Meltwater, a media intelligence and social monitoring tool to assess engagement) and analytics (e.g., Urchin Tracking Module codes and Google Analytics) to look at the number of clicks or views of their data products. Only a few internal users knew about Meltwater reports or acknowledged their usefulness, although they were highly used by the Census Communications Division for its marketing campaign. While internal users also have access to these reports, many noted that there is a lack of narrative supporting the number of clicks and views. For example, they are unable to discern who is viewing their products, and that is not conducive to decision making. While having some demographic data (i.e., data about viewer groups according to certain attributes) would be more useful for them to tailor their products according to their audience, there are limitations related to privacy considerations.
Performance metrics were not always updated or monitored consistently. Gaps were also noted in the use of certain operational and availability metrics.
While there are monthly dashboards, it was noted that not all performance metrics were updated or monitored consistently. For some Field 4 interviewees, this was caused by a lack of resources or time to update, maintain and monitor these metrics, or to look at performance retrospectively.
Gaps were also noted in the use of certain operational and availability metrics. For some Field 4 interviewees, there was too much focus on volume, which did not always capture the level of effort required to develop certain labour-intensive products. For example, because it takes much more time to create an interactive data visualization than a table, solely measuring how many are created would not give a complete picture. Given that operational and availability indicators are highly dependent on the capacity of the field, there can be challenges in setting adequate targets for departmental indicators. The development of more comprehensive and SMARTFootnote 5 indicators could help assess and improve efficiency.
Field 4 has established service standards and processes for its communications and dissemination services, which are published on the ICN. Some divisions also have tools to track service requests submitted by internal users. However, not all divisions have established a monitoring process to determine whether their service standards are met.
Field 4 has established processes and service standards to help internal users in their planning and to ensure a seamless experience for those involved. These service standards and processes are also published on the ICN to manage the expectations of internal users (e.g., turnaround time to complete a service request). The Dissemination Division, SRED and, to some extent, SCPD have established a process to monitor their performance against service standards; however, some Field 4 interviewees mentioned that further work is needed to have a comprehensive picture. This is because some standards are hard to establish, primarily because of the complexity of certain tasks, leading to important variations.
The Dissemination Division uses the Service Request Management (SRM) Portal to track the service requests submitted by internal users, enabling the division to track and monitor the metrics against its service standards (e.g., average time to complete a service request). The web-based functionality of the SRM Portal also allows the division to gauge the satisfaction of internal users through automated post-completion surveys. This enables the division to monitor the effectiveness and efficiency of its service delivery over time. Except for ORCSD, which uses the Language Services Portal to track the translation and editing requests submitted by internal users, other divisions within the Communications Branch do not use such systems, given the nature of their broad range of services; however, it was mentioned that a centralized tool like the SRM Portal or JIRA, project management software used by the agency, may help organize and monitor the work. There is also no tool to track internal user satisfaction within the Communications Branch.
2. Relevance
Evaluation question 2.1
To what extent do communications and dissemination services meet the needs of internal users?
Summary
Communications and dissemination services supported the priorities of the agency and the initiatives of SMAs. While the Engagement Playbook provided guidance to SMAs in undertaking engagement activities, some wanted further support from Field 4. Overall, most internal users interviewed were satisfied with the communications and dissemination services provided by Field 4; however, some opportunities for improvement were identified.
Communications and dissemination services support agency-wide and subject-matter initiatives and are aligned with the priorities of the agency.
Field 4 was created during a period when Statistics Canada undertook agency-wide modernization initiatives, which included the realignment of strategic directions and governance restructuring. Building on this, Field 4 established a logic model, a comprehensive set of plans, strategic roadmaps and a monitoring framework to ensure the achievement of its expected outcomes and alignment with the agency's priorities. The strategic roadmaps developed by Field 4 clearly outline activities and expected outcomes for both branches, as well as their alignment with agency-wide priorities.
To further ensure continuous alignment with the agency's priorities, Field 4 has also been an active participant in various committees and working groups dedicated to advancing corporate endeavours, such as the Disaggregated Data Action Plan, the Quality of Life Framework and open data. Recognizing the growing demand to have statistical information centralized in one location, Field 4 also supported SMAs in the development of various hubs and portals (e.g., the Centre for Gender, Diversity and Inclusion Statistics).
For horizontal priorities, such as Gender-based Analysis Plus (GBA Plus), responsibility rests primarily with SMAs in terms of data and content; they are responsible for integrating a GBA Plus lens into the material they submit. From a communications and dissemination standpoint, GBA Plus considerations are typically built in as part of a program's consultation or corporate requirement process. For example, Field 4 and SMAs must consult with the Centre for Indigenous Statistics and Partnerships ahead of disseminating information involving Indigenous statistics to ensure that releases are reflective of and sensitive to Indigenous groups. Field 4 also ensures that communications and dissemination services adhere to the Government of Canada's accessibility and official language guidelines.
While the Engagement Playbook provides guidance and resources to support SMAs in undertaking engagement activities, not many were aware of it. Some also wanted further engagement support from Field 4.
The Purpose-based Engagement Strategy and its playbook provide practical, hands-on tips and tools to guide SMAs when undertaking engagement activities. The playbook also includes an engagement continuum model for Statistics Canada and alludes to a centre of excellence dedicated to providing expert advice on strategic engagement to support SMAs. Despite the advertising done by Field 4, only a few interviewees were aware of it—mainly the groups that were consulted during its development.
The engagement continuum model for Statistics Canada includes four incremental levels of engagement: (1) inform, (2) listen, (3) discuss and (4) dialogue. For each level, there are different tactics and methods to consider for effective engagement. According to the playbook, most of the agency's engagement activities are in the bottom three levels of the spectrum. According to SMA interviewees, many engagement activities they undertake typically fall under the "inform" and "dialogue" levels. Because of limited capacity and expertise, some interviewees would like Field 4 to further support them in carrying out their engagement activities. For example, it was suggested that Field 4 provide insight on what engagement tools are available for SMAs to use or feedback on material written by SMAs, or that perhaps Field 4 employees even write the material themselves, based on content and data provided by SMAs.
| 1. Inform (Provide information) |
2. Listen (Ask for feedback) |
3. Discuss (Invite into the process) |
4. Dialogue (Work in partnership) |
|---|---|---|---|
| Tactics and methods | |||
|
|
|
|
For SMAs, expanding the variety of channels beyond the ICN to promote communications and dissemination services could further increase awareness among internal users.
Field 4 relied heavily on the ICN and senior management as the primary channels for informing internal users of their services, although some roadshows were organized when it was newly created. However, some SMA interviewees reported that many internal users were unaware that Field 4 posted their services on the ICN, while the rest did not intuitively consult the ICN; some reported that the information on the ICN was either hard to access or outdated at times. SMAs also believe that staff turnover contributed to information breakdowns. For example, some SMA groups may have developed internal guidelines or established a workflow with Field 4, but the departure of key employees may have disrupted their continuity. Similarly, employees who were present during those Field 4 roadshows may have already left the agency. For SMA interviewees, the use of diverse channels to promote communications and dissemination services may be worth exploring to increase awareness.
Overall, most internal users interviewed were satisfied with the communications and dissemination services provided by Field 4, although they found the processes around HTML and PDF productions cumbersome. Some suggestions for improvement were provided.
Nearly all the internal users interviewed reported using the following Field 4 services frequently:
- translation services (ORCSD)
- official release (ORCSD)
- publishing services (Dissemination Division)
- output database services (Dissemination Division)
- web development (Dissemination Division).
Many also reported using the following services:
- editorial services (ORCSD)
- creative communications (ORCSD)
- social media and media relations (SRED)
- web analytics (Dissemination Division).
Overall, most internal users were satisfied with these services and their access to them. For most, these services met their needs, as well as those of their external audience. Results from the SRM client satisfaction surveys also show a high level of satisfaction for dissemination services. For communications services, some challenges were noted by internal users in the areas of translation and editorial services (e.g., translation not aligned with SMA terminology). Consequently, some internal users indicated that they often prefer performing the translation for non-official releases themselves, rather than sending them to translation services (i.e., ORCSD).
When asked about specific quality aspects (e.g., relevance, usefulness, perceived quality, timeliness and accessibility) of the services they received, most of the internal users were unaware of Field 4 service standards and requested that processes be published on the ICN. Because of their lack of awareness of these standards and processes, a few internal users indicated that it was hard for them to plan. Consequently, some of the services they requested did not meet their timelines or needs, especially services from the Communications Branch. For example, a few internal users who requested communications services noted that while the process was clear in the beginning, it became increasingly complicated as additional tasks were introduced and more people got involved. Consequently, this led to extensions beyond the original timelines of their request.
Others also pointed out the limited capacity in some areas of the Dissemination Division and the Communications Branch, which, coupled with the unexpected announcement of the reduction in the maximum number of Daily releases in early 2023, resulted in delays for certain publications. Several SMAs raised issues around the archaic and cumbersome processes for HTML and PDF document production. Quality control, communication between various internal partners (e.g., Field 4, SMAs) and tracking were the most challenging elements, as the tools were not user-friendly and drained SMA resources.
Despite these challenges, most internal users still felt that Field 4 has proactively supported them. For some, enhancing the system capacity of some of the agency's aging technology, such as the Smart Daily, could help improve the efficiency of some communications and dissemination services (e.g., by developing visual elements or publishing releases more rapidly). Some internal users also suggested the use of an automated tracking system, one that would provide them with real-time updates on the progress of their service request, as well as the estimated completion time. This would greatly help the planning process of internal users and enhance client relations.
3. Moving forward
Evaluation question 3.1
What are the key risks, opportunities, and lessons learned moving forward?
Summary
Given that capacity, integration, and coordination will remain key challenges, the restructuring of communications and dissemination presents an opportunity to reassess their core functions, redefine their roles, and explore new ways to generate efficiencies. Change management will be essential during the transition period, as well as ongoing communication through various channels. Performance measurement is also another area that could be strengthened in the future.
Capacity, integration and coordination will continue to remain key challenges for communications and dissemination.
Some key positions within communications and dissemination groups require specific expertise and skill sets, which are in high demand. Considering the current financial constraints, opportunities for staffing or career advancement may be limited, hindering the agency's ability to compete for resources with other departments. Consequently, recruitment and retention challenges will likely continue to persist after the restructuring of communications and dissemination, further impeding the delivery of services. For instance, the loss of skilled teams may lead to a productivity decrease and delays in some services caused by fatigue (e.g., overtime, heavier workload, low morale and stress) and the additional time and effort required to train replacements and onboard new employees. Field 4 interviewees suggested that partnerships with universities across the country and the flexibility of remote work may help mitigate some of these risks, albeit only to some extent.
One objective in forming Field 4 was to centralize all communications and dissemination activities under a unified umbrella to generate efficiencies and reinforce collaboration across the agency. However, the lack of clarity around some roles and responsibilities, the longstanding silo culture within the agency, and the absence of a common platform to track and monitor services and projects impede the achievement of this objective. With the restructuring of Field 4, coordination and integration will remain challenges that need to be addressed.
The restructuring of Field 4 presents an opportunity for the Communications Branch to reassess its core functions and determine the extent of its role, going forward. New ways to generate further efficiencies could also be explored.
The restructuring of Field 4 presents a unique opportunity for the Communications Branch to reassess its core functions and determine the extent of its role and responsibilities, going forward. A few interviewees also saw the coming changes as a chance to assess whether the work is being performed in the right place and by the right group. This includes, for instance, determining which communications activities under each function the branch should fully undertake, as opposed to those it could pass fully or in part to its internal partners (i.e., SMAs and ROs), while assuming functional authority (e.g., providing guidelines). In light of the branch's capacity, this exercise could help alleviate some of its workload challenges, while offering an opportunity to clarify its role within its own groups and with its internal partners. This could help strengthen integration and coordination of communications activities within groups and across fields. Considerations such as value added (e.g., efficiency gains), risk factors (e.g., reputation of Statistics Canada), areas requiring more support (e.g., engagement with external stakeholders) and the capacity of internal partners that could be leveraged (e.g., SMAs that have IS positions) will need to be taken into account. As part of this exercise, roles, responsibilities and accountabilities of all those involved in communications activities should be clearly defined and communicated.
The restructuring of communications and dissemination also provides an opportunity to reassess some of their processes and explore new ways to generate further efficiencies, when possible. For example, for certain communications or dissemination activities, this could involve assigning an employee or a team dedicated to a portfolio of SMAs; over time, this approach will enable the employee or team to better understand the specific requirements of these SMAs and deliver more efficiently (e.g., faster tracking and monitoring of service requests). Based on the core principle of Lean to reduce and eliminate non-value-adding activities and waste, the evaluation has also identified areas of inefficiencies that could be further explored during the restructuring of communications and dissemination. They are categorized using the Eight Wastes of Lean in Appendix B.
Other areas to consider in the future include ensuring change management during the transition, providing ongoing communication through various channels and improving performance measurement.
The dissolution and restructuring of an entire field present a significant change, not only for Field 4 but across fields; like any other change endeavour, this creates uncertainty among employees. For this reason, change management will be essential during the transition period; it will be crucial to keep employees, especially those directly impacted by the change, informed on the progress of the transition to help assuage anxiety and increase buy-in. Once the key elements of the new structure have been defined (e.g., roles, responsibilities and accountabilities; services offered; processes for service requests; and related guidelines), they should be communicated to all employees using multiple channels to increase awareness at all levels.
Performance measurement of communications and dissemination activities is another area that could be strengthened, moving forward. The performance indicators for communications and dissemination activities were captured in disparate sources (e.g., dashboards, decks) and sometimes not aligned. For example, the Performance Information Profile was never updated to reflect the communications activities that were added with the creation of Field 4. Other opportunities for improvement include ensuring that monthly dashboards are kept up to date; incorporating more operational efficiency metrics; leveraging existing data to enhance business intelligence and decision making, including providing guidance to internal partners (e.g., SMAs) to effectively use available information; and implementing a monitoring process to determine whether service standards are met and to gauge satisfaction of internal users.
How to improve communications and dissemination
Recommendation 1
The Assistant Chief Statistician (ACS) of the Corporate Strategy and Management Field (Field 3) should ensure that the core functions of the Strategic Communications Branch, including the extent of its role going forward, are clearly determined by
- defining communications activities that each core function will, fully or in part, undertake itself, while
- engaging key internal partners, including all SMAs with IS positions, for input
- considering factors such as (but not limited to) value added, risk exposure and capacity of internal partners that could be leveraged
- developing a formal framework (e.g., directives, guidelines, gating process, roles and responsibilities of internal partners) to guide communications activities, and sharing it with internal partners.
Recommendation 2
The ACS of Field 3, in collaboration with the ACS of the Census, Regional Services and Operations Field (Field 7), should ensure that
- regular updates on the progress of the transition are provided to all employees
- employees directly impacted by the change are informed of the new direction of communications and dissemination and engaged for input during the transition period through various channels (e.g., townhalls)
- communications and dissemination services, including key contact information, processes for service requests and related service standards, are updated periodically and promoted through various channels.
Recommendation 3
The ACS of Field 3, in collaboration with the ACS of Field 7, should strengthen the performance measurement of their respective communications and dissemination activities by
- reviewing their respective performance measurement framework (e.g., performance information profiles, dashboards, strategic roadmaps) to ensure it aligns with the new structure
- leveraging existing data to enhance business intelligence and decision making, including providing guidance to internal partners (e.g., SMAs) to effectively use available information
- incorporating more operational efficiency metrics
- implementing a process to monitor service standards and satisfaction of internal users.
Management response and action plan
Recommendation 1
The ACS of Field 3 should ensure that the core functions of the Strategic Communications Branch, including the extent of its role going forward, are clearly determined by
- defining communications activities that each core function will, fully or in part, undertake itself, while
- engaging key internal partners, including all SMAs with IS positions, for input
- considering factors such as (but not limited to) value added, risk exposure and capacity of internal partners that could be leveraged
- developing a formal framework (e.g., directives, guidelines, gating process, roles and responsibilities of internal partners) to guide communications activities, and sharing it with internal partners.
Management response
Management agrees with the recommendation.
- An internal working group will be established to review the core functions of the new Communications and Engagement Branch in collaboration with internal partners, including a review of any IS positions outside the branch.
- The branch will leverage the results and recommendations from the review, along with the existing mandate, vision and service standards, to develop a new strategic communications framework that will clearly outline the roles and responsibilities of the new Communications and Engagement Branch.
The branch will develop guidelines on how it works with internal partners (and what is expected of them in the process), including tiered levels of service. Once finalized and approved by senior management, the framework will be shared with internal partners and made available on the ICN.
Deliverables and timelines
- The results and recommendations of the internal working group's review will be presented to senior management by April 2024.
- The comprehensive strategic communications framework for Statistics Canada, which will provide guidelines on communications activities, including roles and responsibilities of all parties and tiered levels of service, will be approved by senior management, shared with internal partners and made available on the ICN by May 2024.
Recommendation 2
The ACS of Field 3, in collaboration with the ACS of Field 7, should ensure that
- regular updates on the progress of the transition are provided to all employees
- employees directly impacted by the change are informed of the new direction of communications and dissemination and engaged for input during the transition period through various channels (e.g., townhalls)
- communications and dissemination services, including key contact information, processes for service requests and related service standards, are updated periodically and promoted through various channels.
Management response
Management agrees with the recommendation.
- Updates on the progress of the transition will be communicated to all employees.
- To ensure that all impacted employees are aware of the transition to the new structure and the impact of the change,
- Field 7 held a townhall with a question and answer session, as well as a presentation to management, followed by a welcome message from the ACS of Field 7 in April and May 2023.
- Field 3 will use a change management approach.
- This approach will include messaging for Communications and Engagement Branch employees and internal partners, with guidance provided on the new structure and new contacts where required.
- Once well established, the Communications and Engagement Branch will organize a "roadshow" to meet with other divisions and fields to introduce itself and help build awareness and understanding of how it will be operationalizing the new vision of Connecting with Canadians.
- All Field 3 employees will continue to be engaged and kept up to date through a variety of channels, including townhalls and meetings, newsletters, and the ICN.
- Standard operating procedures (SOPs) and service standards for key communications and dissemination services will be updated or developed as needed.
- The SOPs will clearly outline the process for requesting various communications and dissemination services (i.e., whom to contact, how, when, why, what to expect).
- They will be reviewed annually, updated as needed and promoted via various channels in addition to the ICN (e.g., field debriefs, the Editorial Board, shared directly with clients).
Deliverables and timelines
- The transition to the new structure will be completed by October 2023. However, internal communications will continue until April 2024 to ensure that the transition is smooth and questions are addressed as employees settle into the new structure.
- Because the integration of the Dissemination Division in Field 7 started in May 2023, a townhall with a question and answer session was already held by Field 7 in May 2023.
- Townhalls and meetings and internal messages for employees of the new Communications and Engagement Branch will be completed by April 2024.
- The roadshow for the new Communications and Engagement Branch will be done by July 2024.
- SOPs and service standards, including an annual review process to ensure they are kept up to date, will be completed and communicated through the ICN and various channels (e.g., field debriefs, the Editorial Board, shared directly with clients) by June 2024.
Recommendation 3
The ACS of Field 3, in collaboration with the ACS of Field 7, should strengthen the performance measurement of their respective communications and dissemination activities by
- reviewing their respective performance measurement framework (e.g., performance information profiles, dashboards, strategic roadmaps) to ensure it aligns with the new structure
- leveraging existing data to enhance business intelligence and decision making, including providing guidance to internal partners (e.g., SMAs) to effectively use available information
- incorporating more operational efficiency metrics
- implementing a process to monitor service standards and satisfaction of internal users.
Management response
Management agrees with the recommendation.
- The Communications and Engagement Branch and the Dissemination Division will review their respective performance measurement frameworks to ensure alignment with the new structure for communications and dissemination.
- Existing communications and dissemination divisional dashboards will be reviewed to ensure that operational efficiency indicators are included, as applicable.
- The Communications and Engagement Branch, working closely with Field 3 and the Dissemination Division, will explore new ways to provide more analytics to target audiences, including tools for internal partners to enhance business intelligence and decision making (e.g., new and revised corporate dashboards to support the One Plan and the Connecting with Canadians strategy).
As part of the aforementioned Communications and Engagement Branch roadshow to internal partners, a presentation and training will be included on communications and engagement services and how clients can be more involved with the evaluation of products (e.g., how they can be more prescriptive in the type of results they are looking for in the evaluation section of a communications plan, or what performance indicators are required). - and d. With respect to the monitoring of service standards and satisfaction of internal users, the following measures will be taken.
- The Dissemination Division will continue to leverage the SRM system to monitor adherence to service standards and user satisfaction. Results will be reported to senior management on an annual basis for continuous improvement.
- The Communications and Engagement Branch will implement a process to monitor adherence to service standards. Results will be reported to senior management on an annual basis for continuous improvement.
- The branch, working closely with Field 3, will explore ways to measure user satisfaction by leveraging existing tools. Options and recommendations will be presented to senior management for implementation approval.
Deliverables and timelines
- Updated Communications and Engagement Branch and Dissemination Division performance measurement frameworks (including dashboards and operational efficiency indicators, as applicable) will be implemented by June 2024.
- Analytics to target audiences and tools for clients to enhance business intelligence and decision making (e.g., corporate dashboards to support the One Plan and the Connecting with Canadians strategy) will be provided by June 2024.
- Training and a presentation on evaluation methods will be provided in July 2024 as part of the Communications and Engagement Branch roadshow.
- Service standards and user satisfaction results for dissemination services will be monitored and reported to senior management by April 2024.
- Service standards for communications services will be monitored and reported to senior management by September 2024.
- Options to measure user satisfaction with communications services and recommendations will be presented to senior management for implementation approval by September 2024.
Appendix A –Field 4 divisions and their services
Communications Branch
1. Official Release and Communication Services Division
Description: Develops and implements the strategic management framework, policies and plans governing the communications advice, standards, tools and services provided by the agency's official release program. Supports the modernization of publishing initiatives and the long-term vision to reach more Canadians through new and modern tools. Also provides high-quality language and creative communications services to the agency's subject-matter experts to improve the public's understanding of official statistics on Canada's economy and society.
Services offered
- Official release (The Daily, StatsCAN Plus, Policy on Official Release)
- Creative communications (infographics, web graphics, promotional material, videos, Eh Sayers podcast)
- Translation and terminology services
- Innovative communications (e.g., Connecting with Canadians strategy, web analytics, StatsCAN app)
- Editorial services (e.g., editing, proofreading)
2. Census Communications Division
Description: Develops and implements communications strategies that support all phases of the census cycle: content consultation, testing, recruitment, early enumeration, collection, dissemination and evaluation. Aims to enhance the public's knowledge of the importance of census information and the census's mandatory nature, increase the number of candidates applying for census jobs, support online completion and self-response, and foster the visibility and use of census data.
Services offered
- Social marketing and engagement (promoting census awareness)
- Respondent communications
- Census media relations
3. Stakeholder Relations and Engagement Division
Description: Ensures timely communication and dissemination of Statistics Canada information to Canadians and works to foster a positive image of Statistics Canada as the national statistical agency. Manages the corporate social media accounts, social trends monitoring and reporting, media monitoring and media relations, public consultations, and usability testing. Plays a key role in maintaining relationships with target markets, including key data users, associations, stakeholders (internal and external) and the public. Also oversees the reporting of key performance metrics for the agency, as well as supporting the Office of the Principal Service Officer.
Services offered
- Social media
- Media relations
- External engagement and marketing (e.g., coordination and logistics of events, engagement opportunities)
- Internal engagement (e.g., focal points, outreach with federal partners)
4. Strategic Communications and Planning Division
Description: Determines communications priorities and the long-term vision, develops overarching communications plans, and provides advice to clients in various fields across the agency, with the goal of ensuring that Statistics Canada is a trusted steward of data about Canada and Canadians. Serves as the front door and main point of contact for the Communications Branch. Helps clients navigate the services the branch offers by connecting them with relevant communications teams and working closely with all parties to achieve clients' goals, while fulfilling the agency's mandate. Uses knowledge and understanding of the public environment to identify opportunities to advance corporate priorities; improve public understanding of Statistics Canada's mandate and value; increase transparency and strengthen public trust, while identifying and managing emerging issues that could impact the corporate reputation; and strengthen connections and drive meaningful engagement with key stakeholders. Develops and implements communications policies, practices, plans and products to achieve these objectives and support internal and external communications activities.
Services offered
- Strategic communications (front door for communications advice, planning and coordination)
- Corporate communications, speechwriting
Data Access and Dissemination BranchFootnote 6
5. Dissemination Division
Description: Promotes a user centric approach to providing timely access to high-quality statistical information that matters.
Services offered
- Centre of Expertise on Accessibility
- Client Relations Office
- Web modernization
- Dissemination special projects
- Internal Communications Network (ICN)
- Output database services
- Publishing services
- Web development
- Web analytics
Appendix B –The Eight Wastes of Lean
1. Defects –Information, products, and services that are incomplete or inaccurate
Examples
- Inaccurate applications
- Broken parts
- Missed deadlines
Example from the evaluation
- A few internal users noted instances where there were errors in the text of their releases after sending them to Field 4. These errors include the meaning of the text changing after it has gone through review, editing and translation with Field 4.
2. Overproduction –Making more of something or making it earlier or faster than it is needed
Examples
- Extra copies of reports
- Redundant storage (paper and electronic)
- "Reply all" on emails
Examples from the evaluation
- A few Field 4 interviewees reported that internal users had requested products that may not be as effective in garnering interest for their target audience.
- There is redundancy noted among publications. For example, the creation of web-based and PDF versions of the same product can be resource consuming, although it is a federal requirement.
- A few Field 4 interviewees reported that there is a tendency in the field to overproduce and focus on production, rather than maintaining or tweaking existing products.
- A few Field 4 interviewees also wondered whether the field was putting effort toward the right products that were going to have the greatest reach (e.g., a focus on resource-heavy products, such as podcasts, that are not accessed by many people).
- The information regarding the editorial calendar and upcoming releases is currently maintained in disparate formats and within different groups, representing a burden in the process of reconciliation and monitoring.
- The Communications Branch relies heavily on emails for interactions with stakeholders and progress tracking, increasing the risk of overlooking important information.
3. Waiting –Waiting for information, equipment, materials, parts or people
Examples
- Waiting for approvals
- Waiting for equipment
- Waiting for large batches
Examples from the evaluation
- There is a heavy reliance on IT on the part of Dissemination. If something requires fixing, Dissemination may need to wait for IT to fix it. However, Dissemination may possess the skills to undertake some activities that IT is supposed to do (e.g., work with JavaScript).
- A few interviewees from the Communications Branch noted that approval processes can take a long time.
- There can be a long lead time to disseminate information, which can result in missed opportunities (e.g., producing videos).
4. Non-utilized talent – Not properly utilizing people's experience, skills, knowledge, or creativity
Examples
- Employees unable to make decisions
- Skilled employees doing unskilled tasks
- Employees not fully trained
Examples from the evaluation
- SMAs take on communications and dissemination responsibilities by undertaking them in-house (e.g., translation), taking them away from performing more SMA-related tasks.
- Intelligence from ROs is being underutilized. They can tailor messages to their region-based stakeholders and respective audiences.
5. Transportation – Unnecessary movement of materials, information or equipment
Examples
- Hand-offs between functions
- Multiple reviews
- Sending and resending emails
- Moving documents, files or equipment between departments or locations unnecessarily
- Travelling to meetings or events that could be conducted remotely
Examples from the evaluation
- Each time Integrated Metadatabase pages and PDF documents go online, regardless of the changes made (even minor ones), a comprehensive review by SMAs is required.
- A need was identified for greater centralization of documents (for example, a centralized location that would enable SMAs to access the documents and information they need).
6. Inventory –Accumulation of parts, information, applications, etc. beyond what is required by the client
Examples
- Stockpiling supplies
- Information piling up for data entry
- Keeping data longer than necessary
Example from the evaluation
- Interviewees indicated that there is limited capacity within Field 4 to meet all demands, and subsequently there are delays (or pile-up), which led to a backlog of tasks.
7. Motion –Any movement by people that is not of value to the client
Examples
- Repetitive keystrokes
- Walking between equipment
- Switching applications
Examples from the evaluation
- Some internal users noted that it is unclear who the first point of contact is for accessing communications services.
- While information is available on the ICN, a few SMA interviewees noted that this information can sometimes be difficult to access or is outdated.
8. Extra processing – Any steps that do not add value in the eyes of the client
Examples
- Extra formatting, extra fields
- Extra features, excess detail
- Extra report information
Example from the evaluation
- A few internal users reported that, upon reaching out to SCPD for assistance with specific needs, SCPD wanted to do a full communications plan instead of just what was requested.