


Sales at food services and drinking places were up 1.0% to $7.9 billion in November (seasonally adjusted).
Higher sales at full-service restaurants (+1.4% to $3.5 billion) contributed the most to the monthly gain. While sales at limited-service restaurants (+0.5% to $3.6 billion) rose at a slower pace during the month, they maintained their lead in overall sales.
Sales at special food services (+3.2% to $625.7 million)—which includes caterers, school cafeterias and work camps—rose at the fastest pace in November, while sales at drinking places declined 2.6% to $205.4 million.
Ontario (+1.4% to $3.1 billion), Quebec (+1.0% to $1.6 billion) and British Columbia (+0.6% to $1.4 billion) contributed the most to the monthly increase among the provinces, while Alberta (-0.1% to $1.0 billion) reported the lone decline.
The prices Canadians paid for food purchased from restaurants or for alcoholic beverages served in licensed establishments rose at the same pace in November (+5.5%).
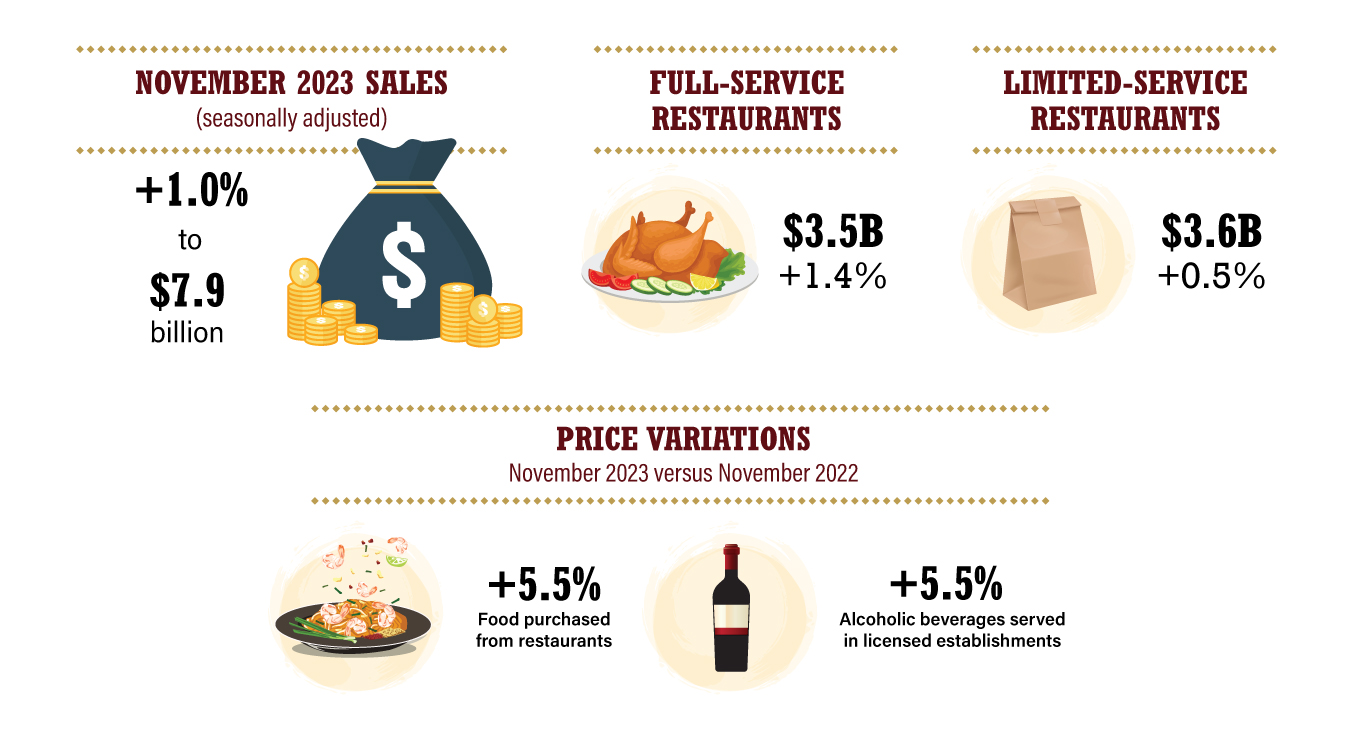
Description - November 2023 sales
November 2023 sales
(seasonally adjusted)
+1.0% to $7.9 billion
Full-service restaurants
$3.5 billion; +1.4%
Sales at limited-service restaurants
$3.6 billion; +0.5%
Price variations
November 2023 versus November 2022
+5.5% Food purchased from restaurants
+5.5% Alcoholic beverages served in licensed establishments
Related products
Data tables
Data visualizations
Previous release
Definitions, data sources and methods
StatsCAN app
Did you know you can read StatsCAN Plus articles and more on the StatsCAN app? If you’re already using the app, let us know what you think by leaving a review in the App Store and Google Play.
Contact information
For more information, contact the Statistical Information Service (toll-free 1-800-263-1136; 514-283-8300; infostats@statcan.gc.ca) or Media Relations (statcan.mediahotline-ligneinfomedias.statcan@statcan.gc.ca).