


We’ve all seen prices in grocery stores lately. Wherever you live in Canada, there is no question that grocery bills are getting more expensive. From 2021 to 2022, prices for food purchased from stores increased by 9.8% on average nationally. This year-over-year growth is a continuing trend, with food prices up by 19.1% from 2018 to 2022. The rise in food prices could be contributing to more Canadians experiencing food insecurity.
What is food insecurity?
The Canadian Income Survey (CIS) measures food insecurity using the Household Food Security Survey Module. Based on a household’s experience caused by a lack of money for food, food insecurity can be categorized as marginal, moderate or severe.
Marginal food insecurity means worrying about running out of food or having a limited selection of food. Moderate food insecurity means compromising in the quality or quantity of food. Severe food insecurity means missing meals, having a reduced food intake and, at the most extreme, going day(s) without food.
Food insecurity in this article refers to people living in households that experienced moderate or severe food insecurity. As Canadians who reported marginal food insecurity did not compromise on the quality or quantity of the food they purchased, they have been grouped with those that did not report any food insecurity.
More people are living in food-insecure households
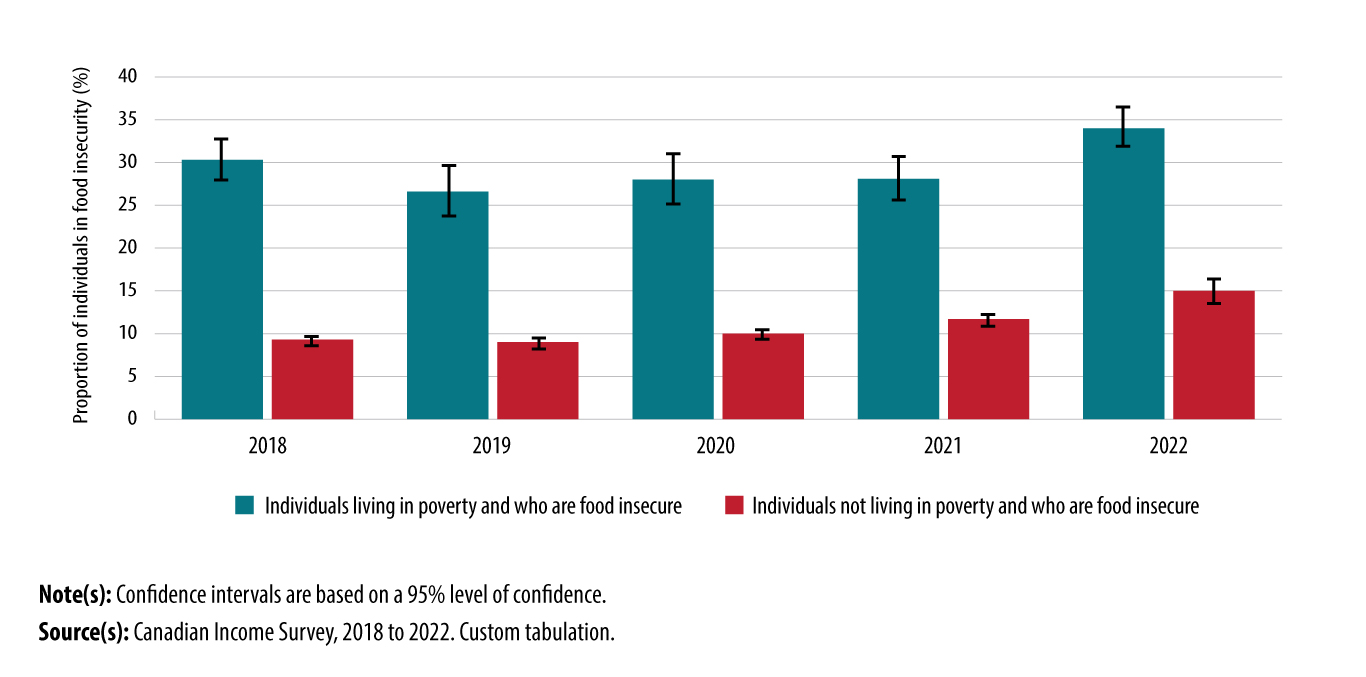
In 2022, 16.9% of Canadians were food insecure, compared with 12.9% in 2021. Overall, the proportion of individuals in households experiencing food insecurity has increased by 5.3 percentage points from 2018 to 2022.
Close to 1 in 10 (9.9%) Canadians were living in poverty in 2022. An individual or family with a disposable income below the appropriate Market Basket Measure (MBM) threshold, for the size of the family and the region of residence, is considered to be living in poverty. The MBM is Canada’s Official Poverty Line. Food insecurity was greater for people living in poverty (34.0%) than for people not living in poverty (15.0%). From 2018 to 2022, food insecurity has increased for both those living in poverty (by +3.6 percentage points) and those not living in poverty (by +5.8 percentage points).
Chart 1: Proportion of individuals in food insecurity by poverty status, Canada, 2018 to 2022
Description - Chart 1 Proportion of individuals in food insecurity by poverty status, Canada, 2018 to 2022
The title of the chart is “Proportion of individuals in food insecurity by poverty status, Canada, 2018 to 2022.”
This is a vertical bar chart.
The vertical axis represents the proportion of individuals in food insecurity.
The vertical axis goes from 0% to 50%, with increments of 5%.
The horizontal axis represents the year and goes from 2018 to 2022.
There are two series. The first series represents individuals living in poverty and who are food insecure. The second series represents individuals not living in poverty and who are food insecure.
At period 2018, the first series is at 30.3%, with a lower bound confidence interval of 28.1% and an upper bound confidence interval of 32.5%. The second series is at 9.3%, with a lower bound confidence interval of 8.7% and an upper bound confidence interval of 9.8%.
At period 2019, the first series is at 26.6%, with a lower bound confidence interval of 23.6% and an upper bound confidence interval of 29.6%. The second series is at 9.0%, with a lower bound confidence interval of 8.4% and an upper bound confidence interval of 9.6%.
At period 2020, the first series is at 28.0%, with a lower bound confidence interval of 25.4% and an upper bound confidence interval of 30.6%. The second series is at 10.0%, with a lower bound confidence interval of 9.5% and an upper bound confidence interval of 10.6%.
At period 2021, the first series is at 28.1%, with a lower bound confidence interval of 25.4% and an upper bound confidence interval of 30.7%. The second series is at 11.7%, with a lower bound confidence interval of 11.0% and an upper bound confidence interval of 12.3%.
At period 2022, the first series is at 34.0%, with a lower bound confidence interval of 31.6% and an upper bound confidence interval of 36.3%. The second series is at 15.0%, with a lower bound confidence interval of 14.3% and an upper bound confidence interval of 15.7%.
Note(s): Confidence intervals are based on a 95% level of confidence.
Source(s): Canadian Income Survey, 2018 to 2022. Custom tabulation.
Food insecurity across the provinces
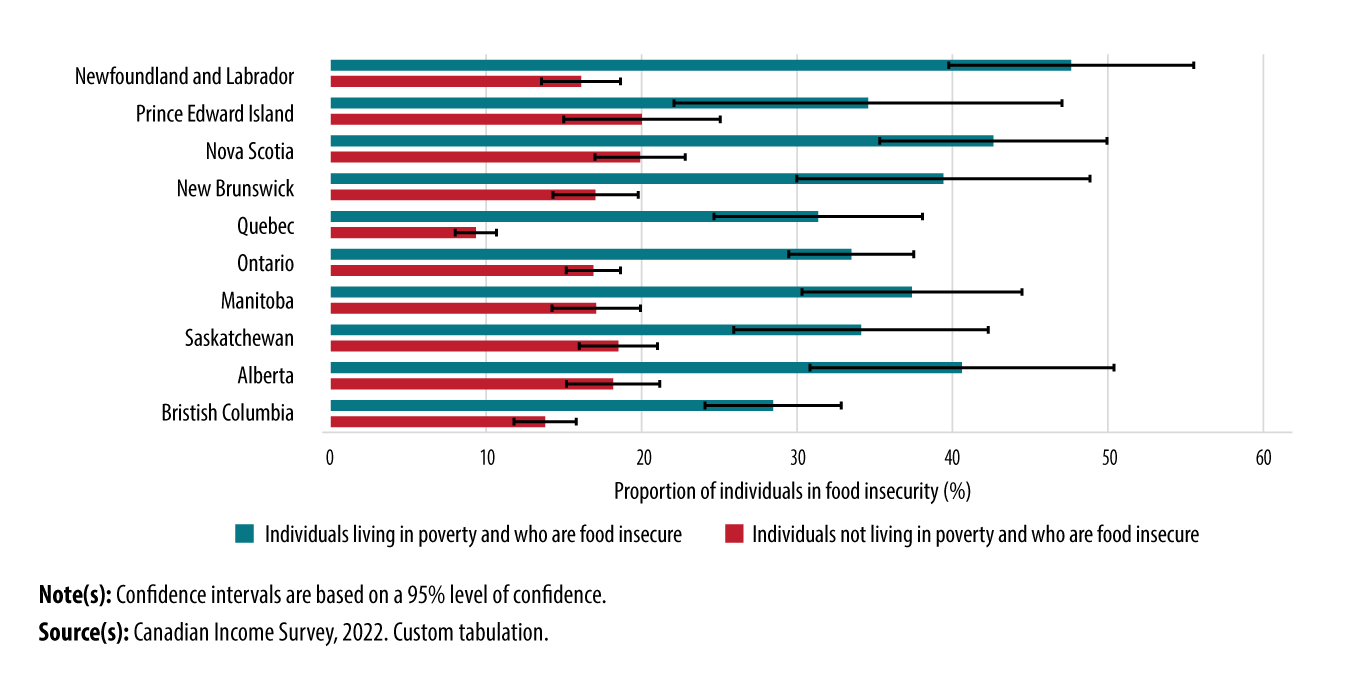
The proportion of the population experiencing food insecurity is different in each province. In Newfoundland and Labrador, for example, nearly half (47.6%) the people who were living in poverty were also experiencing food insecurity in 2022. Those living in poverty in British Columbia, the most western province in Canada, had a food insecurity rate of 28.5%. For people not living in poverty, Quebec had the lowest rate of food insecurity in 2022 at 9.3%, while the remaining provinces had relatively similar rates.
Chart 2: Proportion of individuals in food insecurity by poverty status and province, 2022
Description - Chart 2 Proportion of individuals in food insecurity by poverty status and province, 2022
The title of the chart is “Proportion of individuals in food insecurity by poverty status and province, 2022.”
This is a horizontal bar chart.
The horizontal axis shows the proportion of individuals living in poverty and who are food insecure and individuals not living in poverty who are food insecure.
The vertical axis shows the provinces in Canada, from Newfoundland and Labrador to British Columbia.
There are two series of bars for each province. The red bar (first series) represents individuals living in poverty and who are food insecure. The blue bar (second series) represents individuals not living in poverty and who are food insecure.
In Newfoundland and Labrador, the first series is at 47.6%, with a lower bound confidence interval of 39.6% and an upper bound confidence interval of 55.7%. The second series is at 16.1%, with a lower bound confidence interval of 13.5% and an upper bound confidence interval of 18.7%.
In Prince Edward Island, the first series is at 34.6%, with a lower bound confidence interval of 21.7% and an upper bound confidence interval of 47.5%. The second series is at 20.0%, with a lower bound confidence interval of 15.4% and an upper bound confidence interval of 24.7%.
In Nova Scotia, the first series is at 42.6%, with a lower bound confidence interval of 34.9% and an upper bound confidence interval of 50.4%. The second series is at 19.9%, with a lower bound confidence interval of 17.3% and an upper bound confidence interval of 22.5%.
In New Brunswick, the first series is at 39.7%, with a lower bound confidence interval of 31.2% and an upper bound confidence interval of 48.2%. The second series is at 17.0%, with a lower bound confidence interval of 14.8% and an upper bound confidence interval of 19.2%.
In Quebec, the first series is at 31.4%, with a lower bound confidence interval of 25.4% and an upper bound confidence interval of 37.4%. The second series is at 9.3%, with a lower bound confidence interval of 8.2% and an upper bound confidence interval of 10.4%.
In Ontario, the first series is at 33.4%, with a lower bound confidence interval of 29.5% and an upper bound confidence interval of 37.3%. The second series is at 16.9%, with a lower bound confidence interval of 15.7% and an upper bound confidence interval of 18.1%.
In Manitoba, the first series is at 37.2%, with a lower bound confidence interval of 30.1% and an upper bound confidence interval of 44.3%. The second series is at 17.1%, with a lower bound confidence interval of 15.0% and an upper bound confidence interval of 19.2%.
In Saskatchewan, the first series is at 34.1%, with a lower bound confidence interval of 25.7% and an upper bound confidence interval of 42.5%. The second series is at 18.5%, with a lower bound confidence interval of 16.1% and an upper bound confidence interval of 20.9%.
In Alberta, the first series is at 40.6%, with a lower bound confidence interval of 31.5% and an upper bound confidence interval of 49.7%. The second series is at 18.2%, with a lower bound confidence interval of 15.4% and an upper bound confidence interval of 20.9%.
In British Columbia, the first series is at 28.5%, with a lower bound confidence interval of 23.5% and an upper bound confidence interval of 33.4%. The second series is at 13.8%, with a lower bound confidence interval of 12.2% and an upper bound confidence interval of 15.4%.
Note(s): Confidence intervals are based on a 95% level of confidence.
Source(s): Canadian Income Survey, 2022. Custom tabulation.
Some family types are at a greater risk of experiencing food insecurity
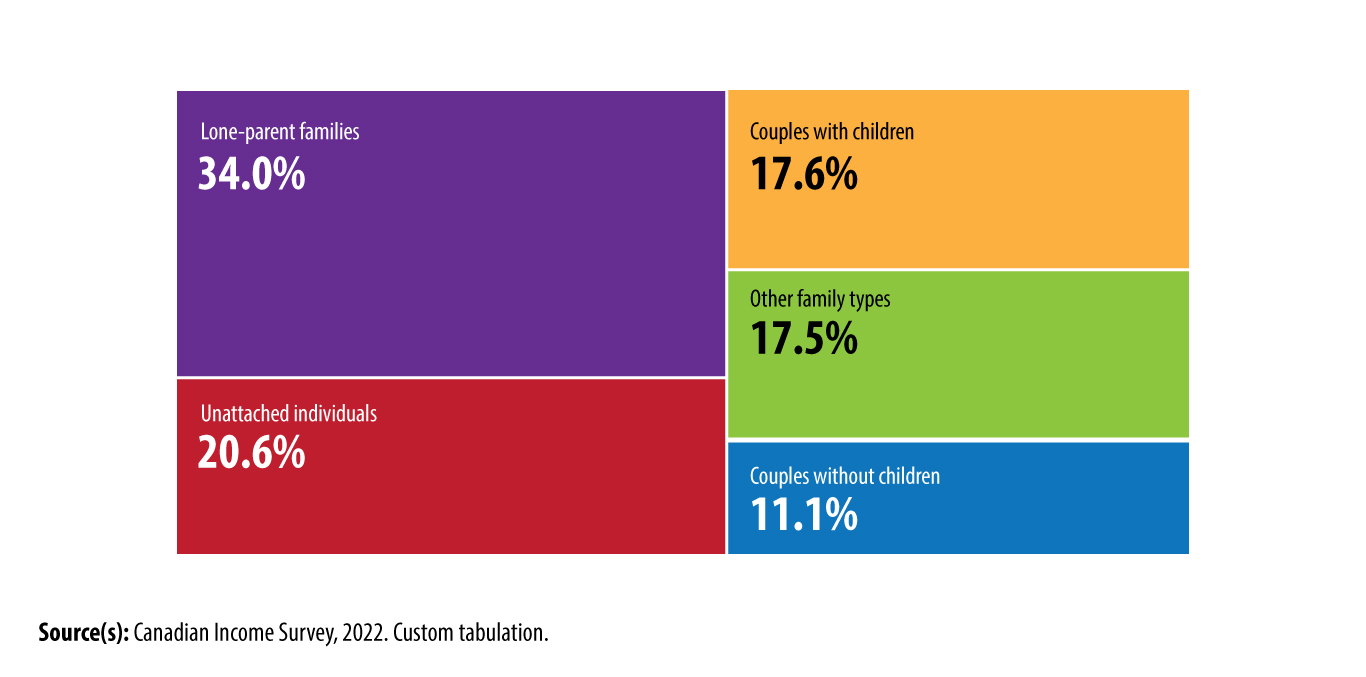
Data from the 2022 CIS show that certain family types are more vulnerable to living in a household that is food insecure. For example, people in lone-parent families were at the greatest risk of experiencing food insecurity compared with people in other family types. About one-third (34.0%) of people living in lone-parent families faced food insecurity in 2022. Looking at this family type in more detail, we see that 36.5% of people in female lone-parent families were food insecure, compared with 23.2% of people in male lone-parent families.
Children living in lone-parent families were also at a greater risk of experiencing food insecurity (36.4%), compared with children living in couple families (18.3%) and children living in other family types (18.6%).
Chart 3: Illustration of the percentage of individuals that are in food insecurity by family type, Canada, 2022
Description - Chart 3 Illustration of the percentage of individuals that are in food insecurity by family type, Canada, 2022
The chart title is “Illustration of the percentage of individuals in food insecurity by family type, Canada, 2022.”
This tree map shows the proportion of individuals in food insecurity by family type.
The family types are lone-parent families, unattached individuals, couples with children, other family types and couples without children.
The family type “lone-parent families” represents 34.0%.
The family type “unattached individuals” represents 20.6%.
The family type “couples with children” represents 17.6%.
The family type “other family types” represents 17.5%.
The family type “couples without children” represents 11.1%.
Source(s): Canadian Income Survey, 2022. Custom tabulation.
Racialized groups and Indigenous people are at a higher risk of experiencing food insecurity
Food insecurity for those who belonged to a racialized group was 20.7% in 2022, an increase of 3.9 percentage points from 2021. Among the three largest racialized groups in Canada, the rate of food insecurity was 31.9% for Black Canadians, 17.6% for South Asian Canadians and 13.4% for Chinese Canadians.
Among Indigenous people aged 15 years and older (excluding those living on reserve and in the territories), 28.6% experienced food insecurity in 2022, an increase of 4.5 percentage points from 2021. This rate is greater than that experienced by the non-Indigenous population aged 15 years and older (15.7%).
In 2022, still looking only at people aged 15 years and older, 33.0% of First Nations people living off reserve and 23.8% of Métis experienced food insecurity. Separate estimates for Inuit could not be published because of a smaller sample.
For more information on food insecurity and poverty in Canada, please see the 2022 Canadian Income Survey release in The Daily.
To explore how food insecurity is tracked and measured over time, check out the Dimensions of Poverty Hub.

StatsCAN app
Did you know you can read StatsCAN Plus articles and more on the StatsCAN app? If you’re already using the app, let us know what you think by leaving a review in the App Store and Google Play.
Contact information
For more information, contact the Statistical Information Service (toll-free 1-800-263-1136; 514-283-8300; infostats@statcan.gc.ca) or Media Relations (statcan.mediahotline-ligneinfomedias.statcan@statcan.gc.ca).