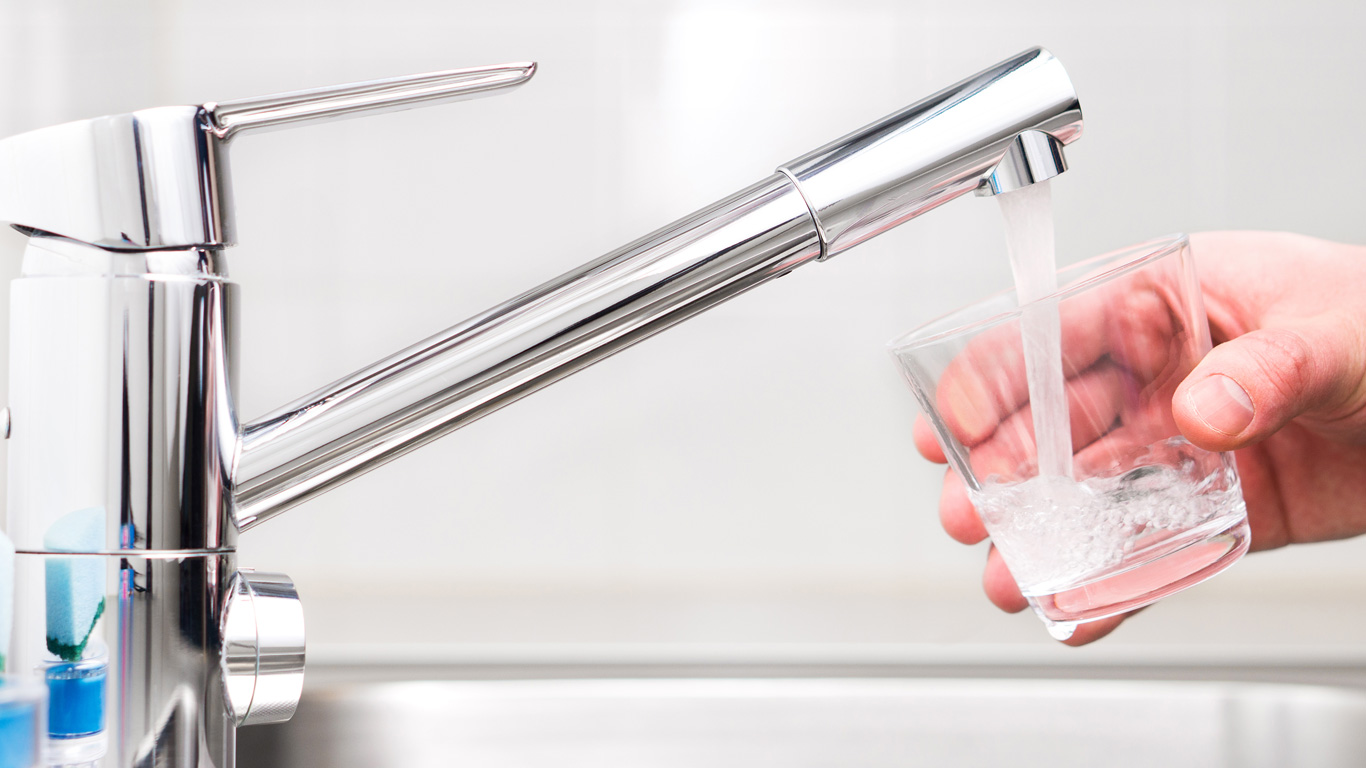
We drink it, bathe in it, flush it, generate electricity with it and, best of all, skate on it. We are also blessed with the fourth most renewable fresh water resources in the world. Today, let’s immerse ourselves in some “fresh” Canadian water data.
While the theme for this year’s United Nations World Water Day is groundwater, public water utilities in Canada supplied 88% of the potable water in 2019 from surface water sources, such as lakes and rivers, with groundwater and other sources accounting for the rest.
In 2019, nearly all of the potable water produced by public water utilities was treated by filtration and disinfection processes, while 1% of Canadians received untreated water, which came primarily from groundwater sources. This is unchanged from 2017.
Approximately half of Canadian households treated water before drinking it in 2019, and the other half drank it straight from the tap. Just over two-fifths (43%) of households treated their water with some type of filter or purifier, with jug filters being the most common type (25%). In 2019, 1 in 10 Canadian households were informed of a boil water advisory, with 62% of affected households boiling it before use as a result.
Canadians supplied by public water utilities “used” on average 411 litres of water per day in 2019, either directly by turning on a tap at home, or through indirect use, such as the fresh water required to manufacture and keep food products safe in restaurants and grocery stores.
Over half of the water we used per day on average in 2019 was a direct result of household use, such as taking a shower, washing clothes or flushing the toilet. This worked out to 2 469 million cubic metres, equivalent to 988 Olympic-sized swimming pools, or just over half of the 4 866 million cubic metres that drinking water plants produced in 2019.
A study in select cities in the United States and Canada found that toilets accounted for almost one-quarter (24%) of the average annual water used per household in 2016.
An average family of four people using a low-volume toilet will flush almost two-thirds (63%) less water than the same-sized family using a traditional model. In 2019, 53% of Canadian households reported having a low-volume toilet, up from 47% in 2011.
Just over half of Canadians households reported using a low-flow shower head (52%).
As a result of these and other conservation efforts, residential water use per person per day has fallen 14% from 2011 to 215 litres in 2019.
The infrastructure required to deliver fresh water into our homes is immense. There were over 500 000 kilometres of potable water, storm water and wastewater pipes in 2018—almost half the total length of all roads in Canada—as well as over 56,000 water, storm water and wastewater facilities.
The construction of water assets of all types is accelerating. An average of approximately 13 000 kilometres of new linear water assets were built per year in 2017 and 2018, over twice the yearly average from 2000 to 2016.
Water is also an important source of energy. Hydro remained the single largest contributor to Canada's electricity mix in 2020, generating three-fifths (60.4%) of the electricity produced nationally in 2020. Quebec accounted for just over half (51.0%) of the hydroelectricity generated in Canada.
Perhaps most importantly of all, water is used to make ice that Canadians can skate or play hockey on.
In 2018, there were 3,003 public indoor ice arenas and 4,136 public outdoor ice arenas located in towns and cities across Canada, as well as 774 curling facilities. On average, there was one indoor ice arena for every three rural municipalities, and two arenas for every urban municipality in Canada.
Contact information
For more information, contact the Statistical Information Service (toll-free 1-800-263-1136; 514-283-8300; infostats@statcan.gc.ca) or Media Relations (statcan.mediahotline-ligneinfomedias.statcan@statcan.gc.ca).
