New Dissemination Model — Getting ready for Beta Test, Part 2
Archived information
Archived information is provided for reference, research or recordkeeping purposes. It is not subject to the Government of Canada Web Standards and has not been altered or updated since it was archived. Please "contact us" to request a format other than those available.
In April 2012, Statistics Canada launched its three-year New Dissemination Model project with the goal to modernize the methods and framework for disseminating data on its website. The key objective is to create a user-centric website and to increase coherency, consistency and simplicity in dissemination activities.
As part of this project, Statistics Canada consulted with Canadians in June 2014. The objectives of the consultation were to determine the ease of navigation, usefulness and participant satisfaction with the new design. The evaluation sessions tested the intuitiveness of various items on the main menu including: Census, data tables and profiles; Surveys; Geography door and the map to data tool; reference categories; and analysis categories.
Consultation methodology
Statistics Canada held in-person usability consultations. This round of sessions was held in French using the French website. Participants were asked to complete a series of tasks and to provide feedback on the proposed website.
How to get involved
The consultations are now closed.
Individuals who wish to obtain more information or to take part in a consultation may contact Statistics Canada by sending an email to consultations@statcan.gc.ca.
Please note that Statistics Canada selects participants for each consultation to ensure feedback is sought from a representative sample of the target population for the study. Not all applicants will be asked to participate in a given consultation.
Statistics Canada is committed to respecting the privacy of consultation participants. All personal information created, held or collected by the Agency is protected by the Privacy Act. For more information on Statistics Canada's privacy policies, please consult the Privacy notice.
Results
What worked
Most participants successfully navigated through the new options within the mega menu. Participants liked the filter options on the left-hand side bar of the “Census” page and thought the filters were intuitive. They also found that the keyword search function worked well within the filters.
Overall, participants considered the geography tool to be easy to navigate. They understood the regional breakdown on the left-hand side of the map and went to “Advanced search” when they wanted to add a geographic region to the search function.
Under “Analysis”, the new keyword search function worked well. Participants liked the auto-populate feature that offered suggestions as they typed in the search field.
Areas for improvement
From the “Census” page, it was not intuitive to participants that the “National Household Survey” icon was a button to obtain more information.
The difference between the filters “Sujet”, “Thème de diffusion”, and “Variable” was not apparent.
“Documentation sur l'enquête à propos du : Recensement de la population", which offers information on the Census collection methodology, was not intuitive.
Finding information on a specific survey was not intuitive.
Within the geography tool, some the on/off switch, under the “Advanced search”, was not intuitive for participants.
The “Montrer tout” button, within the geography tool, was also not intuitive.
The majority of participants did not know the difference between the three Analysis sub-categories “Stats express”, “Articles et Rapports” and “Revues et publications vedettes”.
The “Montrer tout” pull down menu under the sub-categories was not intuitive.
Recommendations
Make the “National Household Survey” button icon appear more like a button.
From the left-hand side filters, either merge or clarify the sub-categories underneath “Sujet”, “Thème de diffusion” and “Variable”.
Merge “Documentation sur les enquêtes” with “Résultats des enquêtes”.
Offer a search function at the top of the A to Z survey list, as well as the list by subject.
Make the buttons underneath the advanced search more intuitive by either changing the color, or creating a check box.
Keep the search function under “Analysis” as a metadata search (only the titles and description).
The preferred sub-category options under “Analysis” were “Survol statistique”, “Articles et Rapports” and “Revues et périodiques”.
Statistics Canada thanks participants for their participation in this consultation. Their insights guide the Agency's web development and ensure that the final products meet users' expectations.
A new version of the My StatCan module will be launched in May!
This new and improved My StatCan will include an updated and user-friendly interface, additional email notification options, and the ability to subscribe to even more types of statistical content.
In order to ensure a successful transition, new user registrations will be disabled on May 15 and 16. Also, changes made to existing subscriptions during that time will not be reflected in the new version of My StatCan.
My StatCan - help
Setting up and using your personalized My StatCan portal.
I have logged in to My StatCan for the first time. A message says that my account is unverified. What should I do?
In your email application, retrieve the registration confirmation email sent to you by Statistics Canada. Select the validation link in the email, or copy it and paste it to your browser. This action will validate your email address, and you will be redirected back to your My StatCan home page. You can then proceed in customizing your account.
Customizing My StatCan
My StatCan is a customizable portal that enables you to bookmark for easy access your favourite Statistics Canada articles, reports, data tables, indicators and more. You can customize what you see on your home page when you log in to My StatCan. Each bookmarked item is placed in a specific topic box.
Adding a topic box
Three topic boxes appear automatically on your My StatCan home page when you first register. They are labelled “Articles and reports”, “Data tables” and “Online discussions”
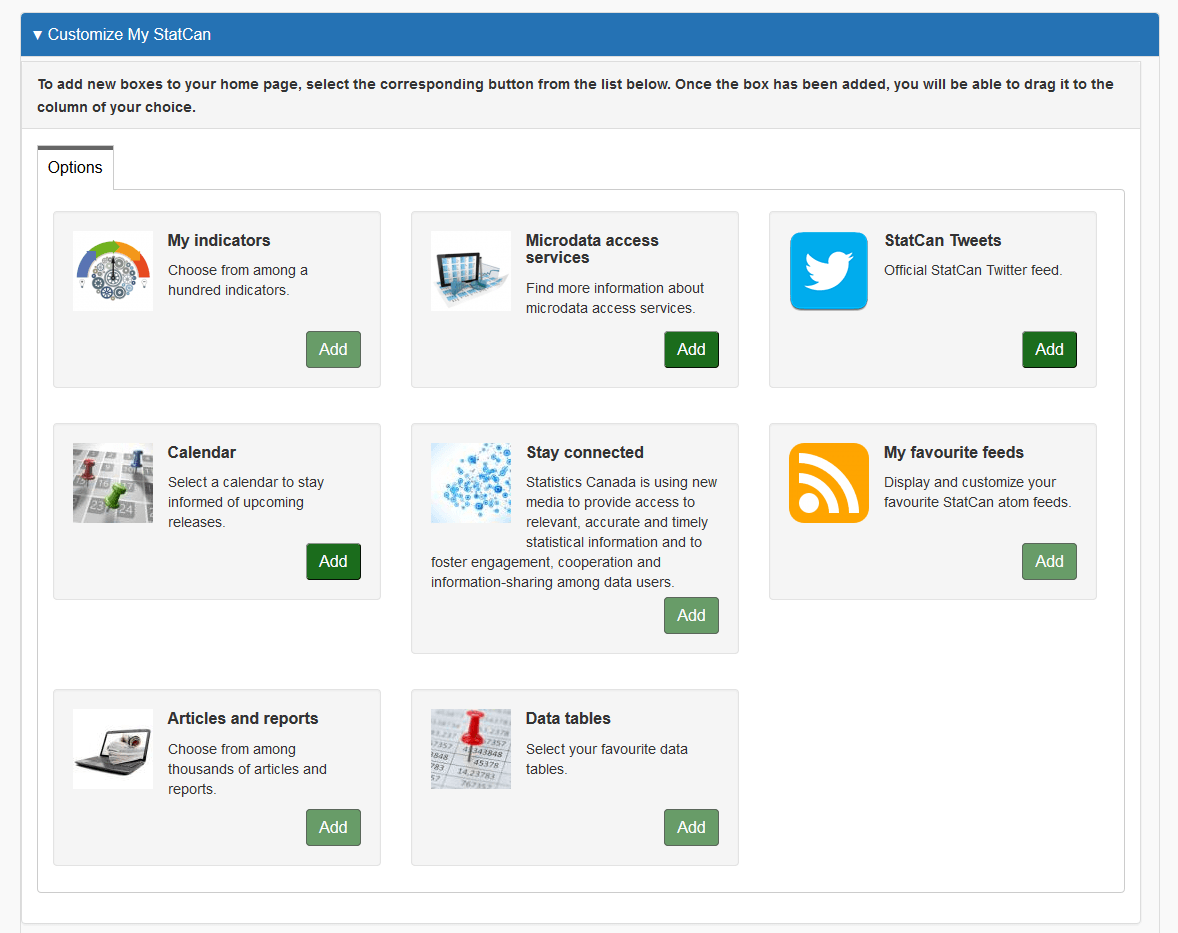
To add new topic boxes, select Customize My StatCan.
You can add to your home page, a selection of topic boxes. To add a new topic box, select the green button ‘Add’ and the box will appear automatically in the appropriate list pane. The boxes who have the ‘Add’ button deactivate are those you have already added.
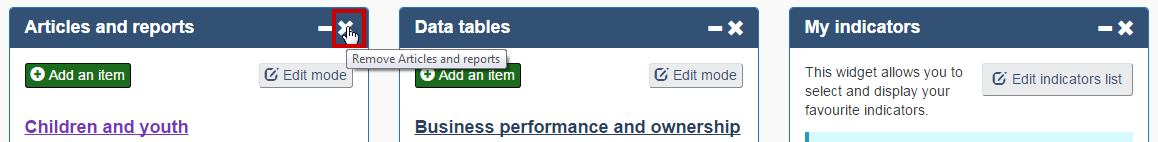
Removing a topic box
Select the x on the top right of the topic box you wish to remove from your home page.
Once a topic box has been removed, the ‘Add’ button of the topic box will reappear, highlighted in green, under the “Customize My StatCan” link, should you wish to add it again in the future. If the topic box ‘Add’ button does not reappear automatically, refresh your page.
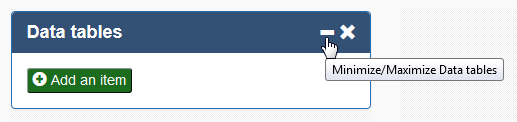
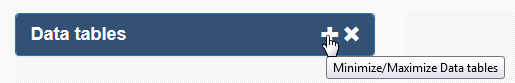
Select the – symbol from the upper right corner of the topic box to minimize the box. Select the + to maximize the topic box.
Dragging and dropping topic boxes
You can customize the way you view each topic box on your My StatCan home page.
To do so, choose a topic box you want to move, then select and drag it into one of the three list panes on your home page. Repeat this drag and drop action for as many topic boxes as you wish.
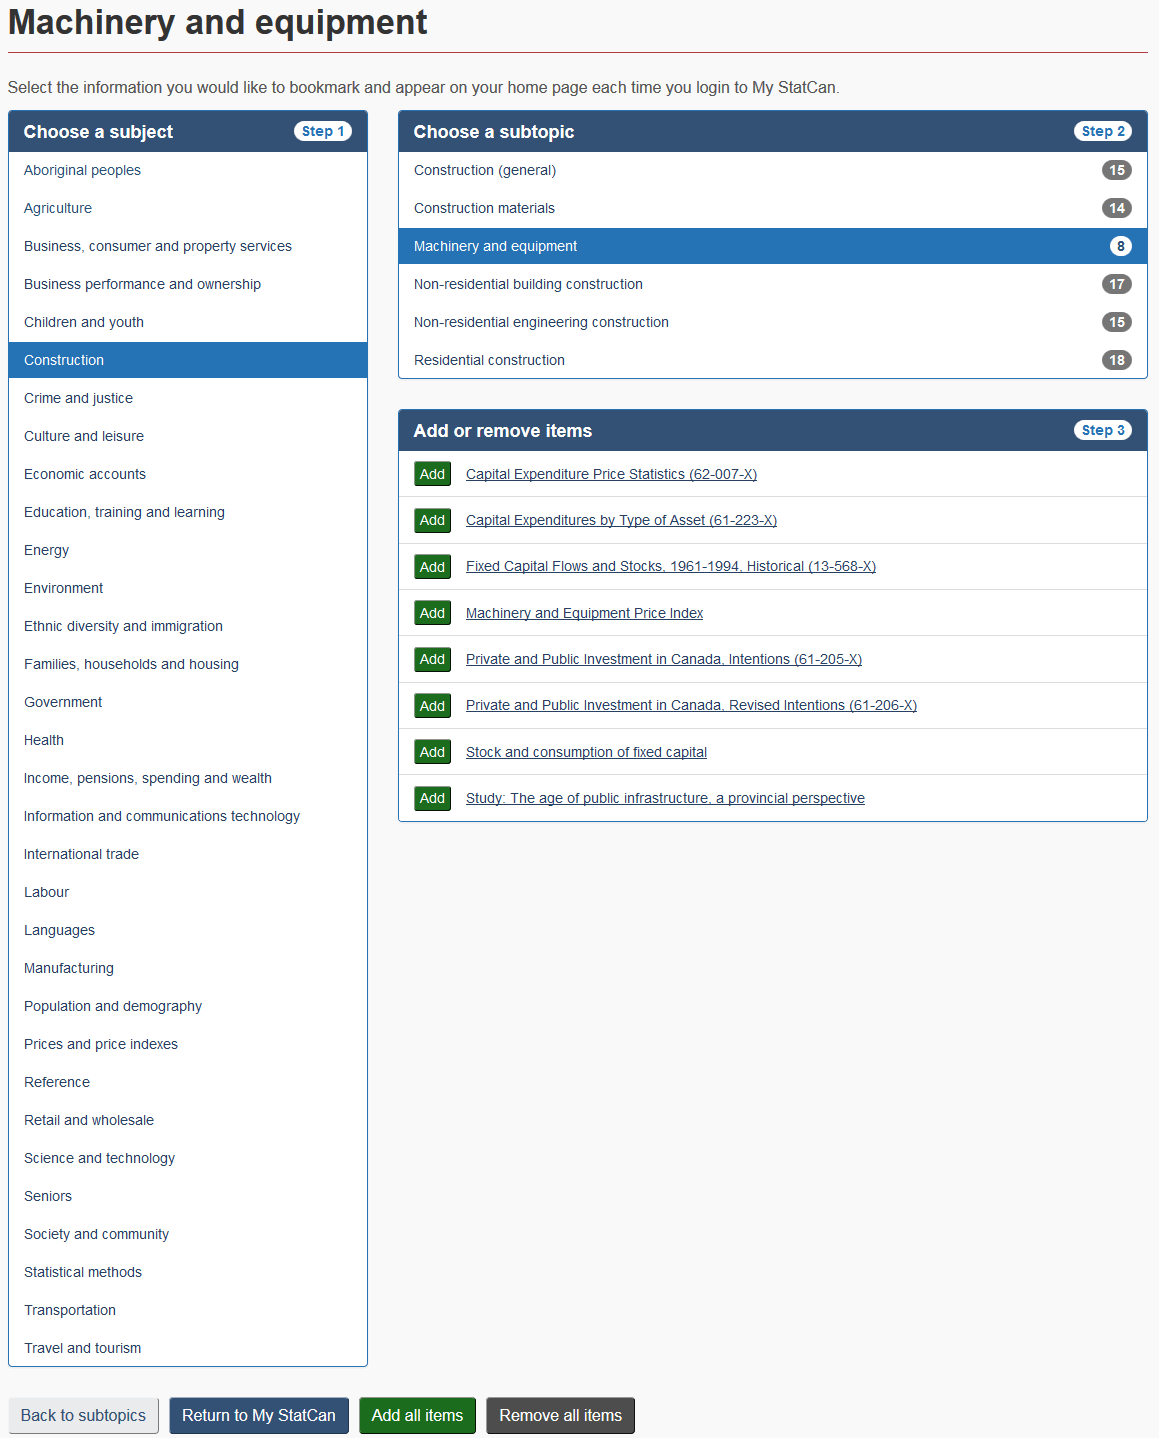
Adding items to topic boxes
To add an item to a topic box, select the green Add an item button for that box.
A list of items will appear in a new page. Select a subject of interest. You may need to open multiple levels of sub-topics to select the exact item you wish to add. Select Add next to each item. These items will be added automatically to your My StatCan home page.
When you are done adding items to your home page, select Return to My StatCan.
From now on, these items will be listed on your home page when you log in to your My StatCan account. Select the link in the topic box to read the latest article.
Removing items from topic boxes
Select the Edit mode button in the top-right corner of the topic box.
A Remove button will appear to the left of each bookmarked item in your list. Select it to remove the item. To remove all items under the same subject, you may clear all by selecting the Remove subject button.
Select the Leave edit mode button to hide the Remove buttons.
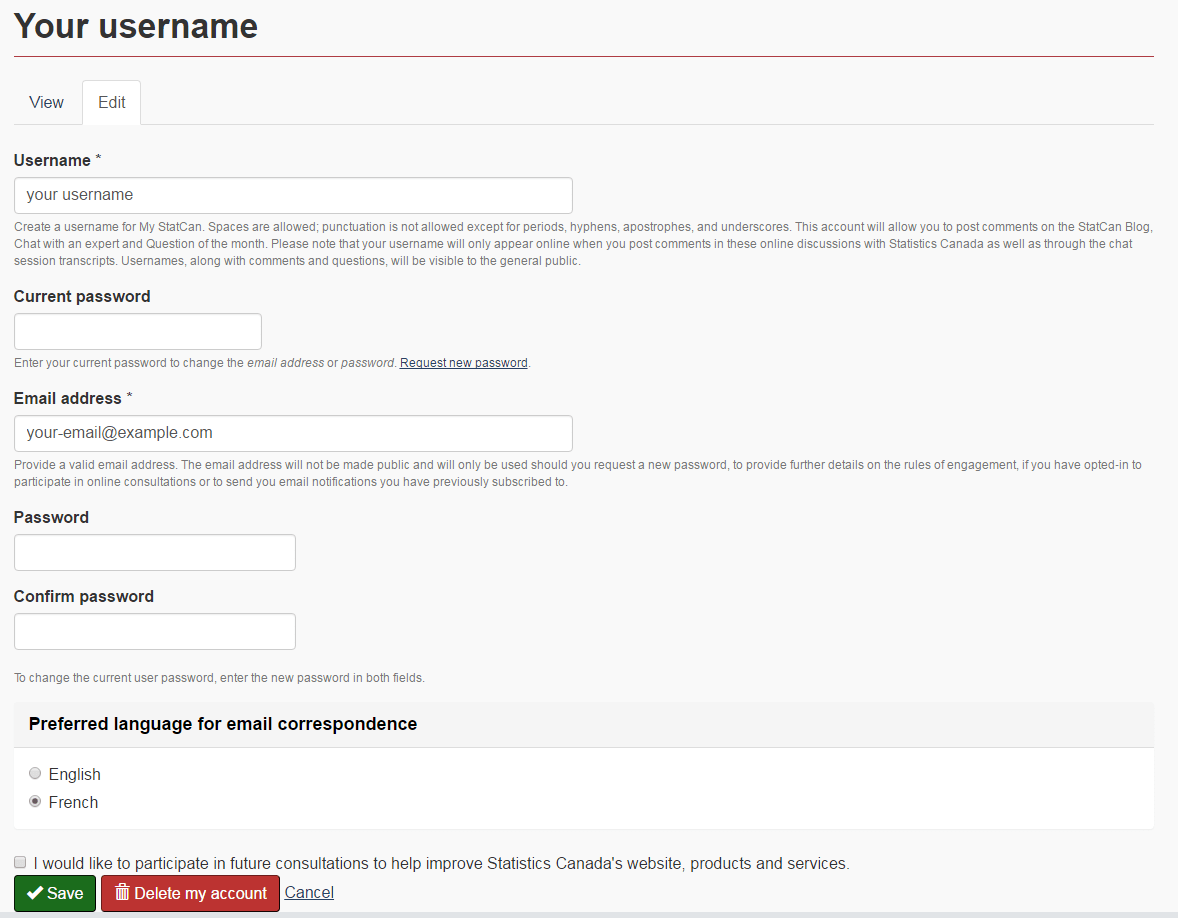
Changing your account settings
To change your My StatCan username, password, email address and language preferences, select My Settings on the right side menu of the home page.
Change any field and then select Save at the bottom of the page for the changes to take effect.
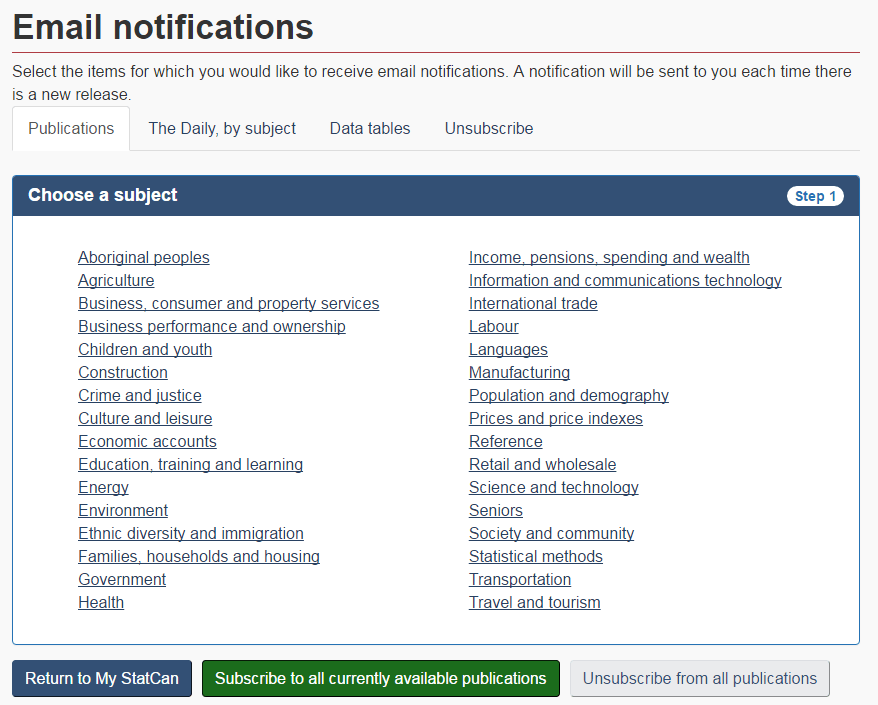
Subscribing to email notifications
To subscribe to email notifications, select Email notifications in the menu on the right side of the home page.
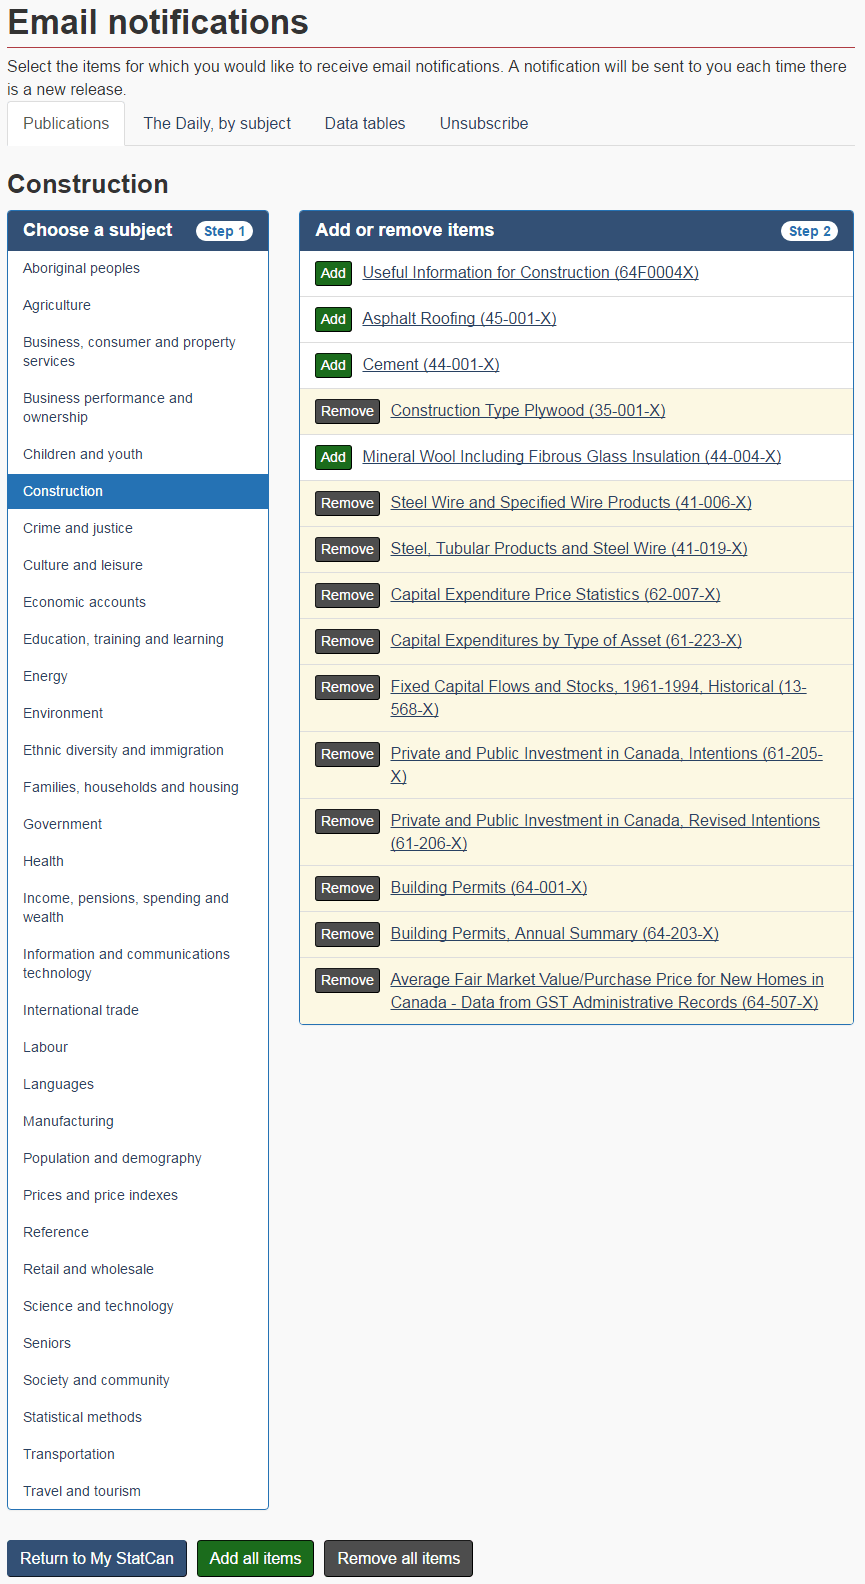
On the Email notifications page, browse through the different tabs. Under each tab, choose the subject and then the items you wish to subscribe to by selecting the green Add button.
If you would like to receive an email notification for all Statistics Canada releases, select the Add all items button at the bottom of the page.
When you have completed your selection, select the Return to My StatCan button to return to your home page. You will receive an email notification every time there is a new release for the products you have selected.
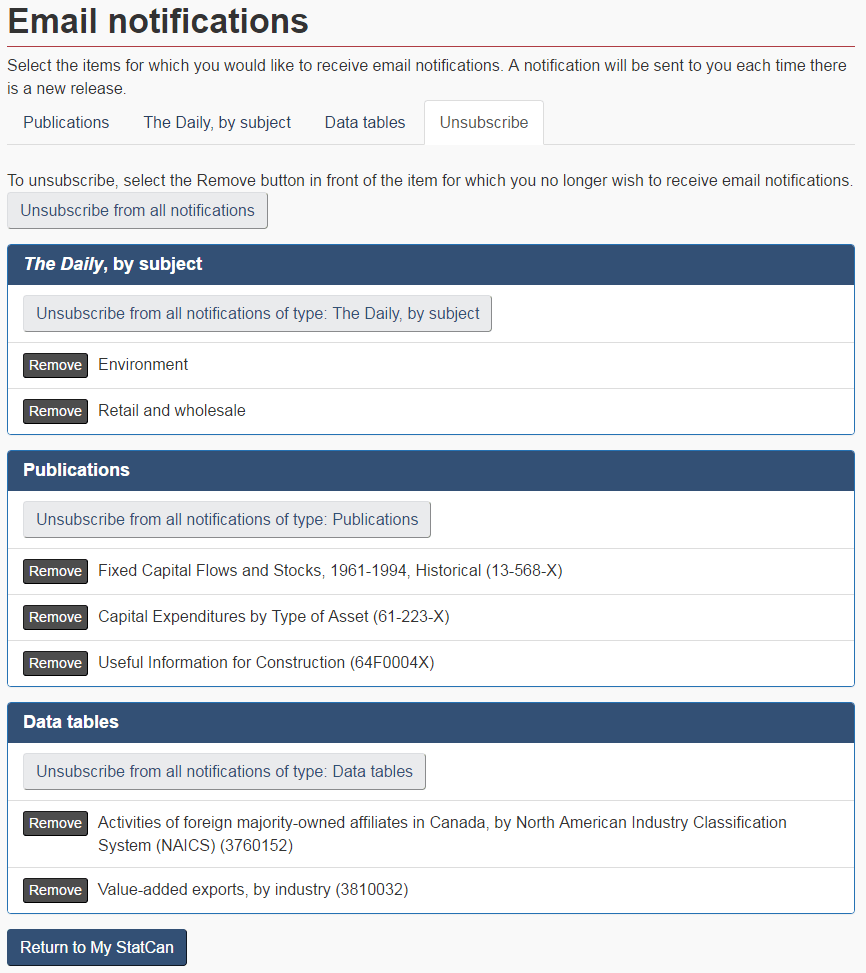
Unsubscribing to email notifications
To unsubscribe to email notifications, select Email notifications in the menu on the right side of the home page.
On the Email notifications page, select the Unsubscribe tab. A list of the items you are currently subscribed to will appear.
Select Remove in front of each item for which you no longer wish to receive an email notification. To unsubscribe to all items at once, select the Unsubscribe from all notifications button at the top of the page.
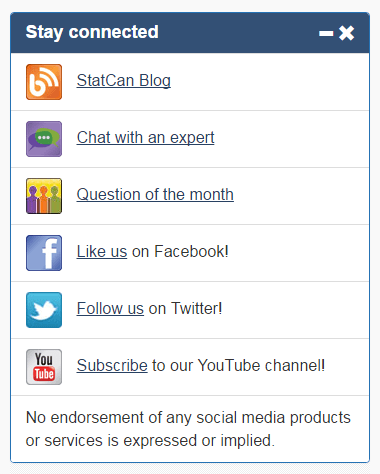
Participating in online discussions
To view posts or comment on the StatCan Blog, participate in a chat session with our data experts, vote and comment on the Question of the Month, or access any of our social media platforms, go to the Online discussions topic box on your My StatCan home page. Select the name of the platform you wish to access and you will be redirected.
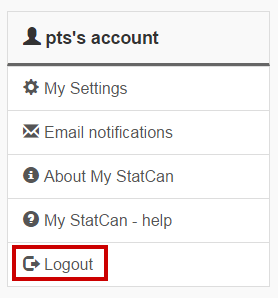
Logging out of My StatCan
Even if you browse away from the My StatCan portal, you will remain logged in. To log out of My StatCan, select Logout in the menu on the right side of your My StatCan home page.
Still having issues using My StatCan?
Contact our Technical support team:
Monday to Friday (except holidays)
From 8:00 a.m. to 7:00 p.m. (Eastern time)
To familiarize participants with benchmarking methods and software. Benchmarking deals with the problem of combining a series of high-frequency data (e.g., quarterly, or monthly data) with a series of less frequent data (e.g., annual data) for a certain variable into a consistent time series. Benchmarking techniques can also be used to solve interpolation, linking and bridging problems associated with time series.
Benefits to participants
Upon completion of the course, the participants will be able to understand some of the benchmarking techniques in use at Statistics Canada. They will have acquired the technical knowledge to solve benchmarking problems in SAS and in R, and to analyze the results. The course is technical and theoretical.
Target population
This course is intended for employees involved or interested in the production and analysis of benchmarked series or in the benchmarking process itself.
Course outline
The course examines
Introduction and issues related to benchmarking.
Benchmarking methods available in SAS and R: pro-rating; Denton; proportional Denton, a numerical version of the regression-based model and variants that directly compute the benchmarking adjustment factors.
Timeliness issues with implicit and/or explicit forecasts and annual growth rates.
Benchmarking stock variables and interpolation.
Using benchmarking methods to solve bridging or linking problems.
Some knowledge of SAS or R will be useful, but not mandatory.
Other Related Courses
The course is specialized and requires basic statistical knowledge. The course STC0437 Theory and Application of Reconciliation is also available.
In 2006, the My Account feature was launched to provide visitors to the Statistics Canada website with the option to receive email notifications when products of interest are released. In 2014, My Account was updated and improved to ensure that it continues to meet the needs of its users, and was renamed My StatCan.
Objectives
A privacy impact assessment for My StatCan was conducted to determine if there were any privacy, confidentiality and security issues associated with the web application, and if so, to make recommendations for their resolution or mitigation.
Description
My StatCan includes the following key features: increased access to Statistics Canada information, a more efficient email notification system, and a one-stop registration for all online interactions with Statistics Canada, such as the Chat with an Expert, Question of the Month and StatCan Blog.
Participants are asked to provide a user name (alias) and their email address, which may be used to correspond with them if required, and indicate by checking a box whether they wish to participate in Statistics Canada's future consultations.
A username is a necessary component of the registration process because it allows registrants to log in to My StatCan and customize their home page. It also enables them to participate in Statistics Canada’s online discussion platforms such as Chat with an Expert. Participants are told explicitly that their username will be displayed in their My StatCan account, and alongside their questions or comments in the online discussion platforms.
All questions and comments posted will be subject to moderation to ensure that the rules of engagement are followed and that no personal information is disclosed.
Risk Area Identification and Categorization
The privacy impact assessment also identifies the risk areas and categorizes the level of potential risk (level 1 representing the lowest level of potential risk and level 4, the highest) associated with the collection and use of personal information through My StatCan.
Personal information of respondents:
Type of program or activity – Level 1: Program or activity that does not involve a decision about an identifiable individual.
Type of personal information involved and context – Level 1: Only personal information, with no contextual sensitivities, collected directly from the individual or provided with the consent of the individual for disclosure under an authorized program.
Program or activity partners and private sector involvement – Level 1: Within the institution (among one or more programs within the same institution).
Duration of the program or activity – Level 3: Long-term program or activity (ongoing).
Program population – Level 3: The program's use of personal information for external administrative purposes affects certain individuals.
Personal information transmission – Level 2: The personal information is used in a system that has connections to at least one other system.
Technology and privacy: The platform will use the Drupal software, which has already been implemented for other Statistics Canada online products, including StatCan Blog and Question of the Month.
Privacy breach: There is a very low risk of personal information being disclosed.
Conclusion
This assessment of My StatCan did not identify any privacy risks that cannot be managed using existing safeguards.
Education generally pertains to the process by which knowledge, skills and values are passed from one generation to the next. Education in the past has been seen primarily as the learning of life and labour force skills before entry to the labour force. Training was seen to deal more with the development of specific labour skills and it was seen to precede entry to the labour force. Increasingly, training is seen as part of labour force participation as attempts are made to better match labour supply skills with labour demand skills. Education, as well, may now continue into the labour force participation years and, indeed, into retirement years. Literacy and numeracy deal with outcomes and are measures of educational achievement.
School attendance refers to whether or not a person is currently attending school (or has done so in the past eight months) and taking courses which could be used as credits towards a certificate, diploma or degree.
Some sources may restrict collection to the population aged 15 and over where it is assumed that the population aged between 5 and 15 are attending. Other sources, particularly provincial administrative sources, may collect for other age groups, for example, the population aged four and over. The population covered should be clearly stated in the classification.
Classification(s)
1
Not attending
2
Attending
2.1
Full-time
2.2
Part-time
2.2.1
Day classes
2.2.2
Evening classes
2.2.3
Both
Educational attainment
Educational attainment refers to the highest level of schooling a person has attained in terms of grades of elementary or secondary school completed and certificates or diplomas obtained. It also refers to post secondary institutions attended and certificates, degrees or diplomas granted.
While a hierarchy of educational attainment is implied with this variable, in a number of instances the levels are not entirely hierarchical. For example, the placement of Trades certificate or diploma as a higher level of attainment than the Secondary (high) school graduation certificate is justified on the basis of the former being obtained primarily for employment or occupational purposes by persons who were, on the whole, beyond the secondary school age at the time of completion of the course. However, a sizable proportion of the group may never have obtained a secondary school certificate. In effect, it cannot be implied that, if a person has attained a certain level, they have necessarily attained all lower levels.
Some sources may restrict collection to the population aged 15 and over. Other sources, particularly provincial administrative sources, may collect for other age groups, for example, the population aged four and over. The population covered should be clearly stated in the classification.
It should also be noted the data will be most meaningful when tabulated by age groups in the population such as the population aged 25 and over since younger groups are less likely to have achieved their life-time attainment potential
Classification(s)
1
Never attended educational institution
2
Primary - secondary school only
2.1
Primary school
2.1.1
Grades 01 - 06
2.1.1.1
Grades 01 - 04
2.1.1.2
Grades 05 - 06
2.2
Secondary (high) school without graduation certificate
2.2.1
Lower secondary
2.2.1.1
Grades 07 - 09
2.2.1.1.1
Grade 07
2.2.1.1.2
Grade 08
2.2.1.1.3
Grade 09
2.2.2
Upper secondary
2.2.2.1
Grade 10
2.2.2.2
Grade 11
2.2.2.3
Grade 12
2.2.2.4
Grade 13
2.3
Secondary (high) school graduation certificate
2.4
Trades certificate or diploma
3
Other non-university education only
3.1
Without other non-university or trades certificate or diploma
3.2
With trades certificate or diploma
3.3
With other non-university certificate or diploma
4
University
4.1
University, without university degree
4.1.1
Without other non-university degree
4.1.1.1
Without other non-university education
4.1.1.1.1
Without certificate, degree or diploma
4.1.1.1.2
With trades certificate or diploma
4.1.1.1.3
With university certificate or diploma below bachelor level
4.1.1.2
With other non-university education
4.1.1.2.1
Without certificate, degree or diploma
4.1.1.2.1.1
With trades certificate or diploma
4.1.1.2.1.2
With university certificate or diploma below bachelor level
4.2
University with university degree
4.2.1
With bachelor or first professional degree
4.2.2
With university certificate above bachelor level
4.2.3
With master's degree
4.2.4
With earned doctorate
Education, highest degree, certificate or diploma
Highest degree, certificate or diploma refers to the highest educational certification attained by a person.
Some sources may restrict collection to the population aged 15 and over. Other sources, particularly provincial administrative sources, may collect for other age groups. The population covered should be clearly stated in the classification.
Classification(s)
1
No degree, certificate or diploma
2
Secondary (high) school graduation certificate or equivalent
3
Trades certificate or diploma
4
Other non-university certificate or diploma
5
University certificate or diploma below bachelor level
6
Bachelor's degree
7
University certificate or diploma above bachelor level
8
Degree in medicine, dentistry, veterinary medicine or optometry
9
Master's degree
10
Earned doctorate
Major field of study
Major field of study refers to the instructional programs (combination of courses and experiences) a person has taken to accomplish a predetermined objective or set of allied objectives such as preparation for advanced study, qualification for an occupation or range of occupations, or simply the increase of knowledge and understanding.
Under this definition, instructional programs, while containing courses and other learning experiences (such as laboratories, field experiences, practical applications, research assignments, etc.), are not merely the sum of such components. A list of courses, for example, cannot be equated with a program, much less successfully completed program, unless there is evidence that an institution or other provider recognizes the existence of such a program and certifies completion of it. This point is set forth via the operational criteria described below.
Operational criteria
There are two criteria that refine the conceptual definition for operational purposes:
An instructional program must be offered by, through, or under the auspices of an educational institution or other provider.
Accomplishment of predetermined objectives must mean, in practice, the presence of a set of structured learning experiences, as defined by an institution or other provider, that lead to a completion point, and that point must be formally certified via an award or other form of recognition.
Instructional programs that meet the above criteria include:
Post secondary programs culminating in the following awards: Post secondary Certificates, Associate's Degrees, Bachelor's Degrees, Post baccalaureate Certificates, Master's Degrees, Post-Master's Degrees, First-Professional Degrees, Specialist Degrees, Doctoral Degrees and Post-Doctoral Certificates.
Secondary programs culminating in the following awards: Regular High School Diplomas, College Preparatory Diplomas, Vocational Diplomas, Regents of Honors Diplomas, High School Equivalence Certificates, Certificates of Academic or Vocational Competence, and Certificates of IEP Completion.
Secondary and post secondary Cadet and Junior/Senior R.O.T.C. programs.
Adult education programs leading to certificates of completion in credit or non-credit programs of various types.
Residency programs conducted by the dental, medical and veterinary professions that lead to advanced professional certification.
Archived information is provided for reference, research or recordkeeping purposes. It is not subject to the Government of Canada Web Standards and has not been altered or updated since it was archived. Please "contact us" to request a format other than those available.
In April 2012, Statistics Canada launched its three-year New Dissemination Model project with the goal of modernizing the methods and framework for disseminating data via its website. The key objective is to increase coherence, consistency and simplicity in dissemination activities.
Consultations were held to determine whether Statistics Canada website users find the New Dissemination Model's proposed navigation framework, taxonomy and A–Z list intuitive and easy to use.
Consultation methodology
From February 19 to March 4, 2013, Communications Division conducted usability tests, during which participants were asked to complete a series of tasks.
The tests measured the participants' success in completing the tasks and tracked the method adopted by each participant to complete them. Following testing, interviews were conducted to help determine the participants' thought processes during each task.
How to get involved
This consultation is now closed.
Individuals who wish to obtain more information or to take part in a future consultation should contact Statistics Canada through the Contact Us page.
Please note that Statistics Canada selects participants for each consultation to ensure feedback from a representative sample of the target population for the study. Not all applicants are asked to participate in a given consultation.
Statistics Canada is committed to respecting the privacy of consultation participants. All personal information created, held or collected by the Agency is protected by the Privacy Act. For more information on Statistics Canada's privacy policies, please consult the Privacy notice.
Statistics Canada thanks participants for their participation in this consultation. Their insights guide the Agency's web development and ensure that the final products meet users' expectations.
Results
What worked
Participants were able to complete a range of common tasks and found the modified website generally intuitive and easy to use.
Feedback was generally positive for the main menu, A–Z list (list of common search topics) and Key indicators. The shorter list of topics and the landing page that predominantly features The Daily were preferred.
Almost all the participants stated that the Subject list was the element that worked best for them.
Areas for improvement
Unintuitive bread-crumbing on the home page
Low visibility of the A–Z list
Unintuitive links and menus in the Key indicators
Inadequate display of the Subject list
Unintuitive use of the 'Geography' label in the main menu
Some unfamiliar terminology in the new taxonomy
Recommendations
Enhance the visibility of the A–Z list
Create web pages specific to subjects included in the A–Z list and the Subject list
Add provinces, territories, cities and regions to the 'Geography' function (available from the top menu)
Display the data more prominently and change menus in Key indicators
Revise some of the new taxonomy
Clarify the Subject list to show the topic/subtopic hierarchy
Statistics Canada no longer collects or publishes data on abortion.
Note: In 1995, the collection of the data for the Therapeutic Abortion Survey was transferred from Statistics Canada to the Canadian Institute for Health Information (CIHI). Once the data were collected, they were transferred to Statistics Canada to be released in The Daily. This process has caused some confusion with the users of the data. Statistics Canada has decided, in consultation with CIHI that the responsibility for disseminating these data should reside with CIHI . This move will bring the Therapeutic Abortion Survey in line with other programs at CIHI . As a result, the 2006 data is the final year therapeutic abortion data will be released by Statistics Canada. Since therapeutic abortion data is a component of pregnancy outcomes, pregnancy outcomes will no longer be produced by Statistics Canada.
Statistics Canada does not publish data on number of schools and enrolments.
For a breakdown of elementary, secondary, or a mix of elementary and secondary schools and students enrolled in public elementary and secondary schools, please visit the Council of Ministers of Education, Canada (CMEC) website.
Environment – Emissions of air or water pollutants
Statistics Canada does not provide key environmental indicators on air, climate, water, nature and human influence.
For more information on the Canadian Environmental Sustainability Indicators (CESI) program, please visit the Environment and natural resources website.
Fisheries-related activities
Statistics Canada does not collect data on fisheries-related activities such as fisheries harvests, commercial fisheries, recreational fishing or fisheries and the Canadian economy.
Statistics Canada does not collect monthly or annual data on the number of homeless persons in Canada.
Residents of shelters are enumerated during the census, which occurs every 5 years. (Shelters include shelters for abused women and children, shelters for persons lacking a fixed address, and other shelters and lodging and rooming with assistance services).
Statistics Canada has information on the following:
homeless shelter capacity
hidden homelessness
number of people living in shelters during the census
residential facilities (shelters) for victims of abuse
Identity documents (birth, death and marriage certificates)
Statistics Canada does not issue certificates for birth, death or marriage.
Civil registration (birth, death and marriage records) is a provincial jurisdiction. Please contact the government ministry, registry or vital statistics office of the province or territory in which the birth, death or marriage occurred.
Name change
Legal name change is a provincial jurisdiction.
To legally change your name, please contact your provincial or territorial ministry of government, registry, vital statistics or court of justice office.
Pets, cats, dogs, stray animals, animal cruelty
Statistics Canada does not collect data on the number of pets (including cats and dogs) or stray animals in Canada. We do not collect data on animal cruelty or animal testing.
Statistics Canada has information on the following:
Update of the Classification of Instructional Programs
Archived information
Archived information is provided for reference, research or recordkeeping purposes. It is not subject to the Government of Canada Web Standards and has not been altered or updated since it was archived. Please "contact us" to request a format other than those available.
From April 1, 2014 to March 31, 2015, Statistics Canada will be consulting with key stakeholders and the public to update its Classification of Instructional Programs and to ensure it continues to meet the needs of users and to offer relevant, up-to-date illustrative examples.
Consultation method
Statistics Canada invites data producers, data users, clients, ministries of education, post-secondary institutions, other stakeholders, and members of the public to submit proposals for changes to the CIP through email.
Proposals will be accepted until March 31, 2015.
How to get involved
This consultation is now closed.
Proposals for changes to the Classification of Instructional Programs should be submitted by email to the following address: standards-normes@statcan.gc.ca. Participants should consult the guidelines before submitting their proposal.
Statistics Canada, one of 13 federal departments and agencies taking part in the Paperwork Burden Reduction Initiative (PBRI), has completed the baseline count of administrative requirements and information obligations with which businesses must comply. The methodology followed instructions provided for choosing the appropriate in-scope documents and counting the relevant fields.
The total baseline count for Statistics Canada is 11,019 requirements, with 75 stemming from the Statistics Act and the Corporations Returns Act and 10,944 from forms. The implementation deadline for the 20% reduction is October 27, 2008.
PBRI is one of the many initiatives adopted or developed by Statistics Canada in our long history of working to reduce the paperwork burden for respondents, both businesses and individuals. Statistics Canada recognizes that the goodwill of survey respondents is one of our most valuable assets, since the continued co-operation of Canadians enables us to turn survey results into reliable information.
Statistics Canada makes two fundamental commitments to our respondents:
The first is to protect the confidentiality of information provided to us.
The second is to find innovative ways to reduce the time spent completing surveys and to use existing information whenever possible to minimize the number of surveys. Indeed, a declining trend in response burden, particularly for small business respondents, has been achieved over the years.
Thirteen federal departments and agencies are participating in the Paperwork Burden Reduction Initiative (PBRI). The objectives of the PBRI are consistent with those of Statistics Canada and build on our previous internal efforts to eliminate duplication, ease the reporting burden on businesses, improve and facilitate response to surveys, and demonstrate accountability.
The Ombudsman for Small Business Response Burden is pleased to report that Statistics Canada met the PBRI deadline of August 24, 2007, for completing the baseline count of administrative requirements and information obligations with which business must comply.
Below is a description of the methodology used in establishing the count, a list of the surveys included in the initiative, and a summary of some of the many complementary measures that are currently in place at Statistics Canada.
2.0 Baseline count and methodology used
The following instructions on how to produce the baseline count were provided to the participating departments and agencies by Industry Canada (Making the Cut: Reducing Administrative Requirements and Information Obligations by 20 Percent, Industry Canada, April 2007):
The count will be the sum of A, B and C, where:
(1) Includes every "must", "shall" and equivalent in the consolidated federal statutes, with which businesses must comply;
(2) Includes every "must", "shall" and equivalent in the associated federal regulations, with which businesses must comply;
Includes all related federal regulatory and administrative requirements stemming from the administrative policies and guidelines that are associated with the statutes or regulations, and with which businesses must comply; and
Includes all information requirements (number of fields x number of submissions) on government forms associated with A or B.
Guiding principles:
Count all requirements that place a prohibition or that require a business to undertake a set of activities in order to be in compliance with government rules. Requirements also include data fields on forms. Be all inclusive in counting requirements and obligations, but exclude obligations that do not pertain to business.
Count those requirements that your department and agency places on business as a result of federal statutes and regulations only. Do not include those requirements that are derived from international or provincial legal obligations, agreements, standards or similar entities.
Seek clarification in cases of uncertainty.
Statistics Canada's baseline count comprises the following:
(1) = a count of every "must", "shall" and equivalent in the following consolidated federal statutes with which businesses must comply:
the Statistics Act
the Corporations Returns Act.
(2) = not applicable to Statistics Canada
= not applicable to Statistics Canada
= a total of all information requirements (number of fields x number of submissions) on Statistics Canada forms associated with A or B.
Two sources were used to identify surveys/forms that would be reviewed in this initiative:
Statistics Canada's Integrated Metadatabase (IMDB) maintained by Standards Division, was used to identify all active business surveys as of November 1, 2006.
Statistics Canada's 2006/2007 User/Uses Program Review document was used to identify the users and uses of survey output. Surveys are conducted to meet one or many of the following uses:
statutory requirements
statutory instruments
contractual obligation
policy and public interest
interest groups
Surveys conducted to meet statutory requirements or used as statutory instruments were considered out of scope for this initiative as they met the exclusion criteria: "Do not include those requirements that are derived from international or provincial legal obligations, agreements, standards or similar entities."
Most business surveys conducted at Statistics Canada are input to the Federal–Provincial Fiscal Arrangements Act; the Bretton Woods and Related Agreements Act; the Special Data Dissemination Standard (SDDS) with the International Monetary Fund; and the Comprehensive Integrated Tax Coordination Agreement (CITCA) related to the harmonized sales tax to name a few.
Discussions were held with representatives from the 15 survey program divisions that conduct business surveys to review the list of 381 forms and update both the IMDB and the 2006/2007 User/Uses Program Review document. Survey identifiers were mapped to this document and this mapping will be maintained by Finance Division on an annual basis. The Census of Agriculture was excluded from consideration under PBRI because it requires Cabinet approval every five years.
The total baseline count for Statistics Canada is 11,019 requirements, with 75 stemming from the Statistics Act and the Corporations Returns Act and 10,944 from forms. This count was derived by multiplying the maximum number of fields on each form times the number of submissions/frequency.
3.0 Surveys included in the baseline count
Statistics Canada's baseline count includes 75 reporting requirements stemming from the Statistics Act and the Corporations Returns Act and 10,944 requirements stemming from the following 23 surveys (29 forms) from 5 survey program divisions:
Environment Accounts and Statistics Division (EASD) – 4 surveys, 8 forms
Environment Industry Survey
Survey of Environmental Protection Expenditures (long form)
Survey of Environmental Protection Expenditures (short form)
Waste Management Industry Survey (long form)
Waste Management Industry Survey (short form)
Industrial Water Survey: Manufacturing Industries
Industrial Water Survey: Mineral Extraction Industries
Industrial Water Survey: Fossil Fuel and Nuclear Power Generating Plants.
Industrial Organization and Finance Division (IOFD) – 2 surveys, 3 forms
Survey of Deposit-accepting Intermediaries
Survey of Suppliers of Business Financing (short from)
Survey of Suppliers of Business Financing (long form).
Labour Statistics Division (LSD) – 1 survey, 1 form
Workplace and Employee Survey: Employer questionnaire.
Manufacturing Construction and Energy Division (MCED) – 7 surveys, 7 forms
Steel Wire and Specified Wire Products
Mineral Wool Including Fibrous Glass Insulation
Monthly Survey of Construction Type Plywood
Industrial Chemicals and Synthetic Resins
Shipments of Solid Fuel Burning Heating Products
Greenhouse Gas Emissions Report
Asphalt Roofing.
Science, Innovation and Electronic Information Division (SIEID) – 9 surveys, 10 forms
Energy Research and Development Expenditures by Area of Technology
Survey of Innovation
Survey of Advanced Technology
Survey of Electronic Commerce and Technology
Biotechnology Use and Development Survey
Bioproducts Development and Production Survey
Survey of Business Incubators
Health Research and Development Expenditures by Therapeutic Class
The Functional Foods and Nutraceuticals Survey
SIEID precontact questionnaire.
Statistics Canada confirmed that surveys conducted on a contractual basis for other departments were not reported on the sponsoring departments' PBRI baseline count, so they are included here.
4.0 Complementary measures
4.1 Statistics Canada's commitment to reducing reporting burden
We strive continually, in the normal course of our day-to-day work, to minimize the burden associated with our surveys by
sampling and minimizing sample size
striving to keep questionnaire length to a minimum and rigorous testing of questionnaires
using tax or other administrative data in preference to survey data wherever feasible
offering flexible reporting options such as electronic data reporting (EDR)
seeking, listening to and taking action on the basis of respondent feedback
minimizing survey frequency based on client needs (e.g., occasional or annual surveys rather than monthly or quarterly)
minimizing applicability of surveys to small companies
customizing response arrangements for large firms who must participate in many surveys.
The measures described below highlight Statistics Canada's achievements in response burden reduction initiatives.
4.2 Accountability: Annual measurement and reporting of response burden
We take response burden seriously. Included in our annual Departmental Performance Report is a quantitative estimate of total response burden hours calculated annually as the product of (i) the frequency of each survey, (ii) the average time it takes a business to complete the questionnaires and (iii) the number of surveyed respondents.
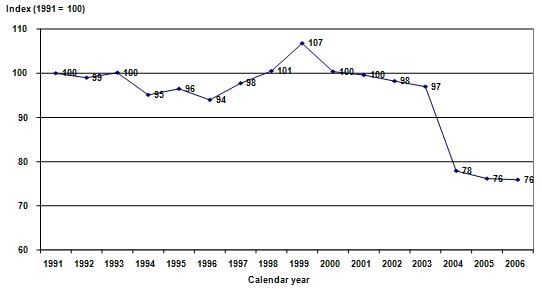
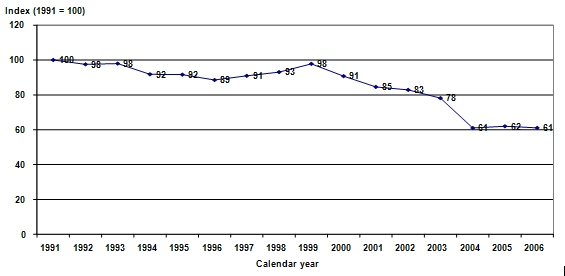
In 2006, total response burden hours remained unchanged from 2005, maintaining the large reductions achieved in previous years. While absolute response burden hours have declined by 24% since 1991 (Graph 1 below), over the same period the average burden placed on each Canadian business has declined 39% (Graph 2 below). Statistics Canada significantly reduced the reporting burden placed on small businesses—for this group of businesses, burden is down 38% since 2000 and 43% over the last 14 years.
Graph 1: Index of response burden hoursDescription - Graph 1: Index of response burden hours
Graph 1 depicts the index of response burden hours from 1991 to 2006. Since 1991, absolute response burden hours have declined by 24%.
Graph 2: Index of average response burden hours per Canadian businessDescription - Graph 2: Index of average response burden hours per Canadian business
Graph 2 depicts the index of average response burden hours per Canadian business from 1991 to 2006. Since 1991, the average burden placed on each Canadian business has declined by 39%.
4.3 Use of administrative data to replace survey questionnaires
For the last several years, Statistics Canada has been using administrative records from the Canada Revenue Agency (CRA) to replace statistical data collected via survey questionnaires. The CRA information of greatest value for statistical purposes is income tax records for unincorporated and incorporated businesses. For monthly and quarterly surveys, administrative files from the goods and services tax are being exploited. The increased use of administrative data in lieu of direct surveys of respondents has resulted in a very substantial reduction in response burden, especially for small businesses.
4.4 Reducing the burden on small businesses
Statistics Canada applies an exclusion threshold to its business surveys, ensuring that the smallest businesses in Canada are not contacted by Statistics Canada. In the annual survey program measuring economic production, this revenue threshold is set to exclude the smallest businesses that in aggregate account for 10% of activity in an industry and province. This means that for the million businesses that could be surveyed in this program, over 700,000 will never be contacted by Statistics Canada. The number of questionnaires sent to businesses has decreased 25% over past four years (net sample x frequency).
Statistics Canada is presently taking action to raise the prescribed exclusion thresholds applicable under the Corporations Returns Act with the aim of cutting the number of corporations required to provide this information by about 40% while still maintaining the quality of the information collected on foreign control of Canadian industry.
4.5 Ombudsman for Small Business Response Burden
The office of the Ombudsman for Small Business Response Burden was established in 1997
as a tangible measure of Statistics Canada's commitment to minimizing the cost incurred by businesses
in recognition that new data initiatives would increase form-filling burden
in response to the call by the Joint Forum on Paper Burden Reduction on Small Businesses.
The position of Ombudsman for Small Business Response Burden addresses complaints relating to excess burden. The Ombudsman's office also works closely with associations like the Canadian Federation of Independent Business in dealing with complaints from the small business community.
4.6 Holistic strategy for managing business survey response
The Holistic Response Management Strategy, devised in 2004, acknowledges the need for different response management strategies for different types of respondents. A key component is the Enterprise Portfolio Manager (EPM) program, responsible for the largest businesses—the ones that are in most of our surveys. This program is designed to make custom-made arrangements with each of these large respondents for collecting the very large volume of information we need from them. The goal is to form long-term relationships with respondents from the largest and most important businesses in Canada in order to manage their response burden and maintain an accurate profile of their business operations.
4.7 Reducing the level of detail on our questionnaires
Statistics Canada has also been taking measures to streamline the content of business surveys. The level of commodity detail collected in the Annual Survey of Manufactures was reduced by almost 90% when the questionnaire was redesigned three years ago. The content of survey questionnaires is regularly reviewed with help from focus groups. Statistics Canada works with the Canadian Institute of Chartered Accountants to align survey content with business accounting standards.
4.8 Facilitating responding to our surveys
Statistics Canada is an active player in the Government On-Line (GOL) initiative and has taken action to increase electronic reporting options for business respondents as a way of providing them with additional flexibility in how they meet their reporting requirements. We have co-operated with other departments and continue to do so, in an effort to eliminate any duplicate reporting requirements.
4.9 Survey of Regulatory Compliance Costs
Statistics Canada's triennial Survey of Regulatory Compliance Costs is an important component of the PBRI. It provides benchmark data on the current cost of regulatory compliance for small and medium-sized businesses in meeting key information obligations that are the responsibility of various levels of government. It focuses on administrative compliance requirements such as completing forms and reporting information.
Data released on July 28, 2006, focused on the internal cost of compliance; data released on December 12, 2006, examined external costs related to 11 key government information obligations. Internal costs included the time and salary of internal staff involved in the preparation of regulatory submissions. External costs included the outsourced services of accountants, income tax specialists and payroll service providers to comply with the businesses' reporting obligations.
5.0 PBRI Steering Committee
Statistics Canada is committed to meeting the 20% response burden reduction target and has created a steering committee of senior managers to monitor progress and provide guidance.