Weighted Asset Response Rate Table summary
This table displays the results of Weighted Asset Response Rate. The information is grouped by Release date (appearing as row headers), 2023, Q1, Q2, Q3, and Q4, and 2024, Q1, calculated using percentage units of measure (appearing as column headers).
Release date
2023
2024
Q2
Q3
Q4
Q1
Q2
percentage
August 23, 2024
78.1
77.8
70.1
73.4
61.2
May 24, 2024
78.1
77.8
70.1
58.8
February 23, 2024
78.1
73.3
56.9
November 23, 2023
74.2
59.2
August 24, 2023
59.4
.. not available for a specific reference period Source: Quarterly Survey of Financial Statements (2501)
Statement outlining results, risks and significant changes in operations, personnel and program
A) Introduction
Statistics Canada's mandate
Statistics Canada ("the agency") is a member of the Innovation, Science and Industry portfolio.
Statistics Canada's role is to ensure that Canadians have access to a trusted source of statistics on Canada that meets their highest priority needs.
The agency's mandate derives primarily from the Statistics Act. The Act requires that the agency collects, compiles, analyzes and publishes statistical information on the economic, social, and general conditions of the country and its people. It also requires that Statistics Canada conduct the census of population and the census of agriculture every fifth year and protects the confidentiality of the information with which it is entrusted.
Statistics Canada also has a mandate to co-ordinate and lead the national statistical system. The agency is considered a leader, among statistical agencies around the world, in co–ordinating statistical activities to reduce duplication and reporting burden.
has been prepared by management, as required by Section 65.1 of the Financial Administration Act, and in the form and manner prescribed by Treasury Board of Canada Secretariat;
has not been subject to an external audit or review.
Statistics Canada has the authority to collect and spend revenue from other federal government departments and agencies, as well as from external clients, for statistical services and products.
Basis of presentation
This quarterly report has been prepared by management using an expenditure basis of accounting. The accompanying Statement of Authorities includes the agency's spending authorities granted by Parliament and those used by the agency consistent with the Main Estimates for the 2024-2025 fiscal year. This quarterly report has been prepared using a special purpose financial reporting framework designed to meet financial information needs with respect to the use of spending authorities.
The authority of Parliament is required before moneys can be spent by the Government. Approvals are given in the form of annually approved limits through appropriation acts or through legislation in the form of statutory spending authority for specific purposes.
The agency uses the full accrual method of accounting to prepare and present its annual departmental financial statements that are part of the departmental results reporting process. However, the spending authorities voted by Parliament remain on an expenditure basis.
B) Highlights of fiscal quarter and fiscal year-to-date results
This section highlights the significant items that contributed to the net increase in resources available for the year, as well as actual expenditures for the quarter ended June 30.
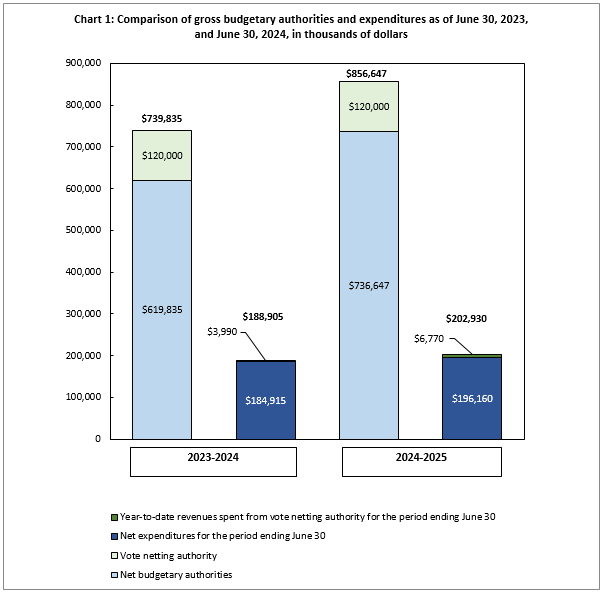
Description for Chart 1: Comparison of gross budgetary authorities and expenditures as of June 30, 2023, and June 30, 2024, in thousands of dollars
This bar graph shows Statistics Canada's budgetary authorities and expenditures, in thousands of dollars, as of June 30, 2023 and 2024:
As at June 30, 2023
Net budgetary authorities: $619,835
Vote netting authority: $120,000
Total authority: $739,835
Net expenditures for the period ending June 30: $184,915
Year-to-date revenues spent from vote netting authority for the period ending June 30: $3,990
Total expenditures: $188,905
As at June 30, 2024
Net budgetary authorities: $736,647
Vote netting authority: $120,000
Total authority: $856,647
Net expenditures for the period ending June 30: $196,160
Year-to-date revenues spent from vote netting authority for the period ending June 30: $6,770
Total expenditures: $202,930
Chart 1 outlines the gross budgetary authorities, which represent the resources available for use for the year as of June 30.
Significant changes to authorities
Total authorities available for 2024-25 have increased by $116.8 million, or 15.8%, from the previous year, from $739.8 million to $856.6 million (Chart 1). The net increase is mostly the result of the following:
An increase of $78 million for salary increases mostly related to the latest rounds of collective bargaining, including price increases and signing bonuses;
An increase of $12.1 million for funding received to cover the advanced planning and testing stage related to the ramping up of the 2026 Census of Population and 2026 Census of Agriculture programs;
A decrease of $7.4 million for the 2021 Census of Population and 2021 Census of Agriculture programs due to cyclical nature of funding winding down;
An increase of $58.7 million for various initiatives including Building a World-Class Health Data System for Canadians, Dental Care for Canadians, as well as for Cloud Operations;
A decrease of $26.6 million for the Employee Benefit Plan Adjustments and various initiatives such as the Disaggregated Data Action Plan.
In addition to the appropriations allocated to the agency through the Main Estimates, Statistics Canada also has vote net authority within Vote 1, which entitles the agency to spend revenues collected from other federal government departments, agencies, and external clients to provide statistical services. The vote netting authority is stable at $120 million when comparing the first quarter of fiscal years 2023-2024 and 2024-2025.
Significant changes to expenditures
Year-to-date net expenditures recorded to the end of the first quarter increased by $11.3 million, or 6.1% from the previous year, from $184.9 million to $196.2 million (see Table A: Variation in Departmental Expenditures by Standard Object).
Statistics Canada spent approximately 26.6% of its authorities by the end of the first quarter, compared with 29.8% in the same quarter of 2023-2024.
Table A: Variation in Departmental Expenditures by Standard Object (unaudited) This table displays the variance of departmental expenditures by standard object between fiscal 2023-2024 and 2024-2025. The variance is calculated for year to date expenditures as at the end of the first quarter. The row headers provide information by standard object. The column headers provide information in thousands of dollars and percentage variance for the year to date variation.
Departmental Expenditures Variation by Standard Object:
Q1 year-to-date variation between fiscal year 2023-2024 and 2024-2025
$'000
%
(01) Personnel
14,719
9.0
(02) Transportation and communications
114
2.9
(03) Information
204
15.2
(04) Professional and special services
-5,743
-56.7
(05) Rentals
4,270
50.3
(06) Repair and maintenance
2
2.4
(07) Utilities, materials and supplies
141
186.5
(08) Acquisition of land, buildings and works
-
-
(09) Acquisition of machinery and equipment
362
83.8
(10) Transfer payments
-
-
(12) Other subsidies and payments
-44
-26.5
Total gross budgetary expenditures
14,025
7.4
Less revenues netted against expenditures:
Revenues
2,780
69.7
Total net budgetary expenditures
11,245
6.1
Note: Explanations are provided for variances of more than $1 million.
Personnel: The increase is mainly due to spending for price increases and signing bonuses in relation to the ratification of collective agreements and the overall increase in the agency's activities related to the 2026 Census.
Professional and special services: This decrease is due a change in the financial coding for Cloud related expenditures. Following consultations with and guidance from other departments and central agencies, a change in accounting treatment was made to code cloud services to rental services from professional and special services to better align with the nature of the agency's Cloud arrangement. The decrease is also due to timing differences compared to last year.
Rentals: This increase is mainly due to financial coding changes in professional and special services for Cloud related expenditures.
Revenues: The increase is mainly due to a timing difference in invoicing compared to last year.
C) Significant changes to operations, personnel and programs
In 2024-25, the following changes in operations, personnel and program activities are underway:
The Census program is ramping down operations from the 2021 Census of Population while ramping up for the 2026 Census which is in the advanced planning and testing stage. As such, expenditures for this program are increasing.
Budget 2024 announced funding for new initiatives for which Statistics Canada will be contributing to, such as, the Modernizing Housing Data and Canada's Action Plan to Combatting Hate. Statistics Canada's implication is to be determined shortly.
Budget 2024 announced a second phase of the refocusing government spending:
Budget 2024 announces the government will seek to achieve savings primarily through natural attrition in the federal public service.
Starting on April 1, 2025, federal public service organizations will be required to cover a portion of increased operating costs through their existing resources.
Impacts on Statistics Canada are still unknown at this time.
Cloud funding is ending in 2024-25. For 2025-26, in the absence of an enterprise-wide funding model by 2025-26, funding will be sourced by Treasury Board of Canada Secretariat resources for that year.
D) Risks and uncertainties
Statistics Canada is addressing the issues and corresponding uncertainties raised in this Quarterly Financial Report through ongoing monitoring activities on its corporate risks and mitigation measures captured in the 2024-25 Corporate Risk Profile and at the program level.
Statistics Canada continues to pursue and invest in modernizing business processes and tools to maintain its relevance and maximize the value it provides to Canadians. To address uncertainties, the agency is continuing its work on the Census of Environment, the Quality of Life Framework for Canada, the Disaggregated Data Action Plan and several other initiatives focused on leveraging modern methods and recent investments in a modern infrastructure to meet the evolving needs of users and remain relevant as an agency. Additionally, Statistics Canada continued to conduct ethical assessments on its new data collections and develop content and expand the Trust Centre on its website. The agency is committed to protecting its data against cyber threats by continuously ensuring the security of data handling and processing, and by supporting the use of modern methods with a functional digital infrastructure.
To achieve its goals, Statistics Canada needs a proficient and empowered workforce. Yet, it faces challenges in competing with other organizations in the data ecosystem due to the current labor market conditions and the growing demand for digital tools and skills. In addition, it is imperative to continue focusing on having an accessible, equitable and inclusive workforce. To address uncertainties, Statistics Canada will collaborate with key stakeholders (e.g. Treasury Board of Canada's Digital Talent Bank) to find innovative ways to work on bridging gaps in digital skills and IT human resource shortfalls, including upskilling and reskilling employees, retaining talent with essential technical skills and recruitment of students. The agency will continue promoting a strong workplace culture, a healthy work-life balance, foster values and ethics and advance on the Equity, Diversity and Inclusion Action Plan.
Furthermore, it will focus on existing employees and continue its effort to achieve greater diversity and inclusion across its workforce and promote and support accessibility through the Accessibility, Accommodation and Adaptive Computer Technology (AAACT) trainings, GC Accessibility Passport, and other training resources. Statistics Canada continues its collaboration with federal partners to access IT services and support to realize its modernization objectives and to achieve the agency's priority to build and adopt a complete enabling infrastructure through the reduction of duplicative solutions, enhancement of digital infrastructure, automation of manual processes and shifting to open-source language. To address uncertainties, the agency is working closely with its federal partners, while adhering to the agency's notable financial planning management practices, integrated strategic planning framework as well as strengthening its financial stewardship.
Approval by senior officials
Approved by:
André Loranger, Chief Statistician
Ottawa, Ontario
Signed on: August 14th, 2024
Melanie Forsberg, Acting Chief Financial Officer
Ottawa, Ontario
Signed on: August 13th, 2024
Appendix
Statement of Authorities (unaudited) This table displays the departmental authorities for fiscal years 2023-2024 and 2024-2025. The row headers provide information by type of authority, Vote 105 – Net operating expenditures, Statutory authority and Total Budgetary authorities. The column headers provide information in thousands of dollars for Total available for use for the year ending March 31; used during the quarter ended June 30; and year to date used at quarter-end of both fiscal years.
Fiscal year 2024-2025
Fiscal year 2023–2024
Total available for use for the year ending March 31, 2025 note *
Used during the quarter ended June 30, 2024
Year-to-date used at quarter-end
Total available for use for the year ending March 31, 2024Table note *
Used during the quarter ended June 30, 2023
Year-to-date used at quarter-end
in thousands of dollars
Vote 1 — Net operating expenditures
648,228
174,055
174,055
530,377
166,191
166,191
Statutory authority — Contribution to employee benefit plans
88,419
22,105
22,105
89,458
18,724
18,724
Total budgetary authorities
736,647
196,160
196,160
619,835
184,915
184,915
Table note *
Includes only Authorities available for use and granted by Parliament at quarter-end.
Departmental budgetary expenditures by Standard Object (unaudited) This table displays the departmental expenditures by standard object for fiscal years 2023-2024 and 2024-2025. The row headers provide information by standard object for expenditures and revenues. The column headers provide information in thousands of dollars for planned expenditures for the year ending March 31; expended during the quarter ended June 30; and year to date used at quarter-end of both fiscal years.
Fiscal year 2024-2025
Fiscal year 2023–2024
Planned expenditures for the year ending March 31, 2025
Expended during the quarter ended June 30, 2024
Year-to-date used at quarter-end
Planned expenditures for the year ending March 31, 2024
Reply to clients within 30 calendar days or in accordance with legislated timelines under the ATIA.
90%
88.89%
91.67%
66.67%
Client Services – Custom Products
Client Services – Custom Products
Client Services – Custom Products
Service Standard
Target (%)
Results Q1 (April to June 2024)
Results Q2 (July to September 2024)
Results Q3 (October to December 2024)
Results Q4 (January to March 2025)
Acknowledge receipt for request of product and/or service within 2 business days.
95%
99.12%
98.49%
98.85%
Deliver products or services on a contractual basis within the mutually agreed-upon time.
95%
97.05%
97.98%
99.01%
Consumer Price Index (CPI)
Consumer Price Index (CPI)
Consumer Price Index (CPI)
Service Standard
Target (%)
Results Q1 (April to June 2024)
Results Q2 (July to September 2024)
Results Q3 (October to December 2024)
Results Q4 (January to March 2025)
The Consumer Price Index is released every month, about three weeks after the price observation period.
95%
100%
100%
100%
Send acknowledgment receipt to all clients (except media) within 24 hours.
95%
100%
100%
100%
Contact Us – General Information to data users and technical support to survey respondents
Contact Us – General Information to data users and technical support to survey respondents
Contact Us – General Information to data users and technical support to survey respondents
Service Standard
Target (%)
Results Q1 (April to June 2024)
Results Q2 (July to September 2024)
Results Q3 (October to December 2024)
Results Q4 (January to March 2025)
Acknowledge receipt or answer an e-mail within 2 business days.
85%
100%
100%
100%
Communicate via email in the official language of the client's choice.
100%
100%
100%
100%
Provide telephone service during regular business hours, from 8:30 am to 4:30 pm in all Canadian time zones.
85%
92.85%
91.01%
84.84%
Information about Surveys and for Survey Participants
Information about Surveys and for Survey Participants
Information about Surveys and for Survey Participants
Service Standard
Target (%)
Results Q1 (April to June 2024)
Results Q2 (July to September 2024)
Results Q3 (October to December 2024)
Results Q4 (January to March 2025)
Post survey information within 24 HRS of start of collection.
95%
100%
100%
100%
Labour Force Survey
Labour Force Survey
Labour Force Survey
Service Standard
Target (%)
Results Q1 (April to June 2024)
Results Q2 (July to September 2024)
Results Q3 (October to December 2024)
Results Q4 (January to March 2025)
Data is released every month, 10 days after the collection period. A Daily article, a publication, a public use microdata file and 65 CODR tables are available on release day.
95%
100%
100%
100%
Acknowledge receipts or answer an e-mail within 2 business days.
95%
99.31%
98.34%
99.79%
Fill basic information requests and orders for readily available products within 2 business days of receipt.
95%
100%
100%
100%
My StatCan
My StatCan
My StatCan
Service Standard
Target (%)
Results Q1 (April to June 2024)
Results Q2 (July to September 2024)
Results Q3 (October to December 2024)
Results Q4 (January to March 2025)
Reply to clients within 2 business days.
90%
100%
100%
100%
Read our Analysis
Read our Analysis
Read our Analysis
Service Standard
Target (%)
Results Q1 (April to June 2024)
Results Q2 (July to September 2024)
Results Q3 (October to December 2024)
Results Q4 (January to March 2025)
Publish 228 working days per year at 8:30am.
95%
100%
98.36%
100%
Release of Statistical Data on Balance of Payment
Release of Statistical Data on Balance of Payment
Release of Statistical Data on Balance of Payment
Service Standard
Target (%)
Results Q1 (April to June 2024)
Results Q2 (July to September 2024)
Results Q3 (October to December 2024)
Results Q4 (January to March 2025)
The data for the Balance of Payments are published within 60 days after the quarter.
95%
100%
100%
100%
Release of Statistical Data on Census of Population
Release of Statistical Data on Census of Population
Release of Statistical Data on Census of Population
Service Standard
Target (%)
Results Q1 (April to June 2024)
Results Q2 (July to September 2024)
Results Q3 (October to December 2024)
Results Q4 (January to March 2025)
Data is published 18 months after Census Day.
100%
N/A
N/A
N/A
Release of Statistical Data on Employment, Payroll and Hours
Release of Statistical Data on Employment, Payroll and Hours
Release of Statistical Data on Employment, Payroll and Hours
Service Standard
Target (%)
Results Q1 (April to June 2024)
Results Q2 (July to September 2024)
Results Q3 (October to December 2024)
Results Q4 (January to March 2025)
Data is released every month, 60 days after the collection period.
95%
100%
100%
100%
Acknowledge receipt or answer an e-mail within 2 business days.
95%
100%
100%
100%
Fill basic information requests and orders for readily available products within 2 business days of receipt.
95%
100%
100%
100%
Release of Statistical Data on Enterprise Finances
Release of Statistical Data on Enterprise Finances
Release of Statistical Data on Enterprise Finances
Service Standard
Target (%)
Results Q1 (April to June 2024)
Results Q2 (July to September 2024)
Results Q3 (October to December 2024)
Results Q4 (January to March 2025)
The data for the Quarterly Financial Survey are published 60 days after the reference period.
90%
100%
100%
100%
The data for the Annual Financial and Taxation Survey are published 18 months after the reference period.
90%
100%
N/A
N/A
Release of Statistical Data on Industrial Product Price Index (IPPI)
Release of Statistical Data on Industrial Product Price Index (IPPI)
Release of Statistical Data on Industrial Product Price Index (IPPI)
Service Standard
Target (%)
Results Q1 (April to June 2024)
Results Q2 (July to September 2024)
Results Q3 (October to December 2024)
Results Q4 (January to March 2025)
Respond to client enquiries within 2 business days.
90%
100%
100%
100%
Data released within 1 month of reference period.
100%
100%
100%
100%
Mean Annual Revision less than 0.5 percentage points.
100%
N/A
100%
100%
Release of Statistical Data on International Trade
Release of Statistical Data on International Trade
Release of Statistical Data on International Trade
Service Standard
Target (%)
Results Q1 (April to June 2024)
Results Q2 (July to September 2024)
Results Q3 (October to December 2024)
Results Q4 (January to March 2025)
Monthly Merchandise Trade data are published within 35-40 days after the reference month.
95%
100%
100%
100%
Release of Statistical Data in Manufacturing Sector
Release of Statistical Data in Manufacturing Sector
Release of Statistical Data in Manufacturing Sector
Service Standard
Target (%)
Results Q1 (April to June 2024)
Results Q2 (July to September 2024)
Results Q3 (October to December 2024)
Results Q4 (January to March 2025)
The data are published within 45 days after the reference month.
100%
83.33%
83.33%
66.67%
Survey coefficients and response rates are respected, as are revisions to previous months' data.
100%
100%
100%
100%
Release of Statistical Data on the Monthly Gross Domestic Product (GDP) by Industry
Release of Statistical Data on the Monthly Gross Domestic Product (GDP) by Industry
Release of Statistical Data on the Monthly Gross Domestic Product (GDP) by Industry
Service Standard
Target (%)
Results Q1 (April to June 2024)
Results Q2 (July to September 2024)
Results Q3 (October to December 2024)
Results Q4 (January to March 2025)
The data for the Monthly GDP are published 60 days after the reference month.
100%
100%
100%
100%
Release of Statistical Data on the Quarterly Gross Domestic Product (GDP)
Release of Statistical Data on the Quarterly Gross Domestic Product (GDP)
Release of Statistical Data on the Quarterly Gross Domestic Product (GDP)
Service Standard
Target (%)
Results Q1 (April to June 2024)
Results Q2 (July to September 2024)
Results Q3 (October to December 2024)
Results Q4 (January to March 2025)
The data for the Quarterly GDP are published within 60 days after the quarter.
100%
100%
100%
100%
Release of Statistical Data on Retail Trade
Release of Statistical Data on Retail Trade
Release of Statistical Data on Retail Trade
Service Standard
Target (%)
Results Q1 (April to June 2024)
Results Q2 (July to September 2024)
Results Q3 (October to December 2024)
Results Q4 (January to March 2025)
The data are published within 2 months after the reference month.
95%
100%
100%
100%
Survey coefficients and response rates are respected, as are revisions to previous months' data.
95%
100%
100%
100%
Release of Statistical Data on Wholesale Trade
Release of Statistical Data on Wholesale Trade
Release of Statistical Data on Wholesale Trade
Service Standard
Target (%)
Results Q1 (April to June 2024)
Results Q2 (July to September 2024)
Results Q3 (October to December 2024)
Results Q4 (January to March 2025)
The data are published within 45 days after the reference month.
100%
83.33%
83.33%
100%
Survey coefficients and response rates are respected, as are revisions to previous months' data.
100%
100%
100%
100%
Research Data Centres (RDC)
Research Data Centres (RDC)
Research Data Centres (RDC)
Service Standard
Target (%)
Results Q1 (April to June 2024)
Results Q2 (July to September 2024)
Results Q3 (October to December 2024)
Results Q4 (January to March 2025)
Have project proposals reviewed and approved in 8 weeks from receipt of a complete file.
80%
87.18%
92.78%
92.23%
Statistical Capacity Building – Workshops, Training and Conferences
Statistical Capacity Building – Workshops, Training and Conferences
Statistical Capacity Building – Workshops, Training and Conferences
Service Standard
Target (%)
Results Q1 (April to June 2024)
Results Q2 (July to September 2024)
Results Q3 (October to December 2024)
Results Q4 (January to March 2025)
National webinars will be offered in both official languages within 3 months.
The Survey of Household Spending (SHS) is a national survey that gathers information on the spending habits of Canadians and allows Statistics Canada to measure changes in these spending patterns. It looks at how much households pay for, among others, food, clothing, shelter and transportation.
To continue to provide good quality data in a timely manner and to address challenges such as the response burden and costs associated with the survey, Statistics Canadas seeks to better understand how SHS users and stakeholders use the data. The main goal of the consultation is to gather information from external SHS users about the data they use, the frequency, the purpose (their outcome) and the specific products they use (how they access SHS data).
How to get involved
This consultative engagement initiative is now closed.
Statistics Canada is committed to respecting the privacy of consultation participants. All personal information created, held, or collected by the agency is kept strictly confidential; it is protected by the Privacy Act. For more information on Statistics Canada's privacy policies, please consult the privacy notice.
Results
Summary results of the engagement initiatives will be published online when available.
The Statistics Canada Symposium 2024 Organizing Committee is committed to providing an atmosphere in which respect for others and intellectual growth are valued and the free expression and exchange of ideas are encouraged. Consistent with this commitment, it is our policy that all participants in Symposium activities enjoy an inclusive environment that is free from harassment, retaliation, and unlawful discrimination. The Symposium aims to welcome and support people of all backgrounds and identities. This includes, but is not limited to, members of any race, ethnicity, culture, national origin, immigration status, social and economic class, educational level, sex, sexual orientation, gender identity and expression, age, size, family status, political belief, religion, and mental and physical ability.
All participants—including, but not limited to, attendees, Statistics Canada employees, students, registered guests, staff, contractors, and exhibitors—in any Symposium session or other activity—whether official or unofficial—agree to comply with all rules and conditions of the activities. Your registration or attendance at any Symposium event indicates your agreement to abide by this policy and its terms.
Expected Behavior
Adopt, model and support the norms of professional respect necessary to promote the conditions for healthy exchange of scientific ideas.
Speak and conduct yourself professionally; do not insult or disparage other participants.
Be conscious of hierarchical structures in the community, specifically the existence of stark power differentials between junior and senior participants—noting that fear of retaliation from seniors can make it difficult for juniors to express discomfort, rebuff unwelcome advances, and report violations of the conduct policy.
Be sensitive to body language and other non-verbal signals and respond respectfully.
Unacceptable Behavior
Violent threats or language directed against another person
Discriminatory jokes and language
Inclusion of unnecessary sexually explicit, violent, or otherwise sensitive materials in presentations
Posting (or threatening to post), without permission, other people's personally identifying information online, including on social networking sites
Personal insults including, but not limited to, those using racist, sexist, homophobic, or xenophobic terms
Unwelcome solicitation of emotional or physical intimacy such as sexual advances; propositions; sexual flirtations; sexually-related touching; and graphic gestures or comments about sex or another person's dress, body, or sexual activities
Advocating for, encouraging, or dismissing the severity of any of the above behaviors.
If you are being harassed, if you notice that someone else is being harassed, or if you have any other concerns related to violation of the Symposium Code of Conduct, please send an email to statcan.symposium2024-symposium2024.statcan@statcan.gc.ca
If a participant engages in harassing behavior at a Symposium event, the conference organizers may take any action they deem appropriate, including warning the offender or expulsion from the conference. Participants asked to stop any harassing behavior are expected to comply immediately.
We expect participants to follow these rules at all Symposium activities, including in interactions with the Symposium staff/volunteers, conference and workshop venues, and conference-related social events, so that all participants can enjoy an engaging exchange of ideas is a welcoming setting.