Statistics Canada 2024-25 Departmental plan
On this page
Read a summary of the Departmental plan
![]() PDF version (PDF, 1.31 MB)
PDF version (PDF, 1.31 MB)
Copyright information
© His Majesty the King in Right of Canada, as represented by the Minister of Innovation, Science and Industry, 2024
Catalogue no. 11-635-X2024001
ISSN 2371-7718
From the Minister

The Honourable François-Philippe Champagne
Minister of Innovation, Science and Industry
It is our pleasure to present the 2024-25 Departmental Plan for Statistics Canada, which lays out the key priorities the agency is working to advance for the benefit of all Canadians.
As the demand for information and data increases, Statistics Canada will continue to lead in its role as a trusted data steward. Its ongoing work will support key government priorities and ensure that all levels of government have the data they require to make informed decisions and govern effectively.
We are pleased to note that Statistics Canada will continue to build on previous investments in modernization to meet the evolving needs of Canadians for trusted and reliable statistical information. The agency will proudly work towards building the next generation of statistical programs and operations. This will include ongoing efforts across the agency to improve statistical programs and operations by leveraging innovative tools, methods and technologies.
For Statistics Canada, 2024-25 will also be an important year of preparation ahead of the 2026 Census of Population. This flagship project remains essential as it provides the most comprehensive statistical portrait of the country's increasingly diverse population.
In addition, the agency's Disaggregated Data Action Plan remains a critical initiative that sheds light on the challenges faced by specific groups and communities. The detailed data released by the agency provide invaluable information and insights on gender gaps, racism and other systemic barriers that must be considered to apply fairness and inclusion to decisions that impact the entire population.
We invite you to read this report to learn more about how Innovation, Science and Economic Development Canada and Statistics Canada are working with Canadians of all backgrounds and in all regions—urban and rural—to position Canada as a leader in the global economy.
The Honourable François-Philippe Champagne
Minister of Innovation, Science and Industry
From the Chief Statistician

Anil Arora
Chief Statistician of Canada
In 2023, Canada's population reached 40 million people. As Canada's national statistical agency, Statistics Canada was right there to capture that moment, put it in context and provide the country with an accurate picture of its changing demographic profile. In times of growth and change, we see just how important data can be—not only to take stock of what's going on around us, but to make sense of those changes, measure their impact and make informed decisions about the future.
Today, Canada's population is not only bigger, but more diverse than it has ever been. Understanding what that means is essential to developing sound economic, social and environmental agendas as the country charts its future trajectory. As an agency, it is our job to continually evolve to keep pace with those changes.
I believe the future is something we shape using the best data and facts at our disposal and not something that we should simply drift into. As the pace of technological, social, economic and environmental change continues to accelerate, we must be equipped to keep up. This includes leveraging technologies like cloud computing to make collaboration and data sharing faster and easier, which we have achieved with projects such as Data Analytics Services and the Virtual Data Lab. Another example is exploring the potential of artificial intelligence to optimize processes and results, and to help us link data in ways that will provide deeper insights.
Continuous modernization of the national statistical system to better serve the country is therefore a priority for us at Statistics Canada. In fact, it is at the heart of our new strategic plan, which will guide our activities over the next year and serves as a framework for this departmental plan. One of our three strategic priorities is to build the next generation of statistical programs and operations. This goes hand in hand with our second priority, which is to continue building a complete enabling infrastructure by leveraging cutting-edge technologies to optimize our activities and deliver even better data to Canadians. Making sure we have the people and expertise needed to deliver that work is equally important. Therefore, our third priority is shaping a healthy, diverse and skilled workforce to meet the current and future needs of Canadians.
The activities we have planned in 2024-25 all align with these priorities. While we will continue providing the accurate data and insights Canadians have come to trust, our strategic plan will ensure we stay focused on the future. This will help us adapt to changes in our field, as well as the evolving need for more granular and complex datasets on a variety of topics.
Our agency will also continue to be guided by the advice and recommendations provided by the Canadian Statistics Advisory Council (CSAC), the Federal-Provincial-Territorial Consultative Council on Statistical Policy, the Advisory Council on Ethics and Modernization of Microdata Access, and the well-functioning ecosystem of subject matter advisory groups. The work outlined in this departmental plan aligns with the four key recommendations provided in the CSAC’s fourth annual report — The Way Forward: Addressing Challenges Facing the National Statistical System, which are to engage Canadians and policy makers in a modern national statistical system, invest in data science and analytical skills, develop innovative data flows, and recognize the role of data stewardship.
These recommendations align with our priorities and our commitment to Canadians. Every day, Statistics Canada's data and research are used by governments, municipalities, businesses, non-profits and regular Canadians looking for the insights they need to make informed decisions on all kinds of issues. This is a great privilege, but also a responsibility that we take very seriously.
We also recognize that, as demand for information continues to grow, the data landscape is becoming more complex, generating new challenges and increased competition. Data have become an invaluable commodity, and a service, but finding the right information, and making sure it is reliable, is not always as easy as it seems. With the flow of information increasing, we must also be mindful of disinformation and misinformation, the role of standards, biases and interoperability.
Statistics Canada has built a solid reputation that is founded on more than a century of work providing reliable data to Canadians. This trust is hard-earned and never taken for granted. It allows us to speak with authority and to provide national and international leadership as new ways to collect, manage and share data emerge. We hold ourselves to the highest standards to keep that trust, which is based on solid frameworks that protect privacy and confidentiality, as well as sound governance that ensures the ethical and responsible handling of data at every stage. This trust also hinges on our ability to make the data we produce accessible to all. As the data landscape becomes more complex, we will continue to help Canadians make sense of it by being transparent and also through education and data literacy.
I have had the privilege of working for Statistics Canada since 1988 and the great honour of leading it since 2016. While this is my last departmental plan as Canada's Chief Statistician, I have no doubt that the agency will continue to deliver the trusted insights Canadians need to make informed decisions and tackle emerging challenges thoughtfully and with confidence, thanks to the dedication and commitment of an inspired workforce.
Anil Arora
Chief Statistician of Canada
Plans to deliver on core responsibilities and internal services
Core responsibilities and internal services:
Statistical information
In this section
Description of core responsibility
Statistics Canada's core responsibility is to produce objective, high-quality statistical information for the whole of Canada. The statistical information produced relates to the commercial, industrial, financial, social, economic, environmental and general activities and conditions of the people of Canada.
Quality of life impacts
Being able to rely on high-quality statistical information is essential to the well-being and quality of life of Canada's population. Statistics Canada provides critical data on issues that have very tangible outcomes in everyday life, from measuring the cost of living with the Consumer Price Index to tracking changes in the labour market with the Labour Force Survey or measuring demographic trends within communities. The agency provides Canadians with the insights they need to make informed decisions on issues that affect their well-being, including the domains covered in the Quality of Life Framework for Canada.
Given Statistics Canada's mandate and the importance of high-quality statistical information to all levels of government, the agency's contribution is most evident in the domain of good governance. The data provided by the agency are used by public institutions every single day and are essential to developing programs and policies that meet the needs of Canada's population. These data support evidence-based decision making and enable the good governance Canadians expect and deserve.
In addition, Statistics Canada plays a key role in developing and maintaining the statistical program that supports the Quality of Life Framework for Canada and measures its impact. In other words, Statistics Canada creates the data infrastructure that other departments use to report on their impact for different quality of life indicators. The Quality of Life Statistics Program therefore supports the Government of Canada as it continues to better integrate quality of life measures into a variety of decision-making and reporting processes, under the leadership of the Treasury Board of Canada Secretariat.
Statistics Canada works to continuously improve quality of life measures, address key data gaps and bring together important economic, social and environmental datasets. These are made available to Canadians through the agency's online Quality of Life Hub, which facilitates the sharing of data and metadata. The hub helps inform decision making and budgeting and can also be used to measure the impacts of policies and programs.
Alongside the Treasury Board of Canada Secretariat, the Department of Finance Canada and the Privy Council Office (PCO), Statistics Canada will continue to support interdepartmental governance for the Quality of Life Statistics Program. The agency will actively engage with other federal departments and agencies to align efforts and ensure that the program keeps supporting the integration of quality of life measures into budgeting and decision making. Statistics Canada will also continue working with international partners to harmonize standards and processes related to quality of life.
Results and targets
Table 1: Indicators, results and targets for departmental result
The following table shows, for each departmental result related to statistical information, the indicators, the results from the three most recently reported fiscal years, the targets and target dates approved in 2024–25.
| Indicator | 2020-21 result | 2021-22 result | 2022-23 result | Target | Date to achieve |
|---|---|---|---|---|---|
| High-quality statistical information is available to Canadians | |||||
| Number of post-release corrections due to accuracy for mission-critical programs | 19 | 7 | 11 | 0Table 1 note 1 | March 31, 2025 |
| Percentage of international standards with which Statistics Canada conforms | 88% | 88% | 98% | 90%Table 1 note 2 | March 31, 2025 |
| Number of statistical products available on the website | 40,738 | 43,184 | 46,318 | 51,750 | March 31, 2025 |
| Number of Statistics Canada data tables available on the Open Data Portal | 7,755 | 8,088 | 8,884 | 9,315 | March 31, 2025 |
| High-quality statistical information is accessed by Canadians | |||||
| Number of visits to Statistics Canada's website | 28,193,955 | 45,972,326 | 31,283,576 | 24,000,000Table 1 note 3 | March 31, 2025 |
| Number of hits on Statistics Canada's Application Programming Interface (API) | 3,899,779 | 5,950,252 | 10,073,000 | 10,802,520 | March 31, 2025 |
| Percentage of website visitors that found what they were looking for | Not available | Not available | 78% | 78%Table 1 note 4 | March 31, 2025 |
| Number of interactions on social media | 1,211,316 | 13,174,481 | 1,012,981 | 525,000Table 1 note 3 | March 31, 2025 |
| High-quality statistical information is relevant to Canadians | |||||
| Number of media citations of Statistics Canada data | 253,171 | 139,078 | 213,229 | 86,000Table 1 note 3 | March 31, 2025 |
| Number of journal citations | 33,596 | 40,248 | 44,271 | 38,000Table 1 note 5 | March 31, 2025 |
| Percentage of users satisfied with statistical information | Not available | Not available | 80% | 80% | March 31, 2025 |
|
|||||
The financial, human resources and performance information for Statistics Canada's program inventory is available on GC InfoBase.
Plans to achieve results
Statistics Canada's planned activities for 2024-25 all support its core responsibility, which is to produce objective, high-quality statistical information for Canadians. The agency will continue to deliver regular data releases throughout the year, while also monitoring emerging challenges and opportunities in the overall statistical landscape.
Statistics Canada's current strategic plan is focused on improving the quality of the data it releases and giving itself the means to do so in a modern and efficient manner. This plan is built around three main priorities that will guide new and ongoing projects:
- Build the next generation of statistical programs and operations.
- Build and adopt a complete enabling infrastructure.
- Shape a healthy, diverse and skilled workforce to meet the current and future needs of Canadians.
These strategic priorities, along with their associated objectives, will allow the agency to strengthen its infrastructure and programs to ensure it adapts to a rapidly changing environment and continues to meet Canadians' evolving needs for trusted data by leveraging innovative tools and processes. Since all activities at Statistics Canada in 2024-25 will be aligned with the three strategic priorities identified in the plan, they are presented accordingly in the section that follows.
Strategic Priority 1: Advance the next generation of statistical programs and operations
Given the complex and rapidly changing statistical landscape, it is essential for the agency to continuously improve its statistical programs to meet the evolving needs of Canadians and policy makers for trusted and reliable statistics. This includes adopting new advanced methodologies, which will have an impact on the delivery of many different projects that provide essential data to Canadians. The agency will also continue to find new and innovative ways to make information easier to access for stakeholders, policy makers and the general public.
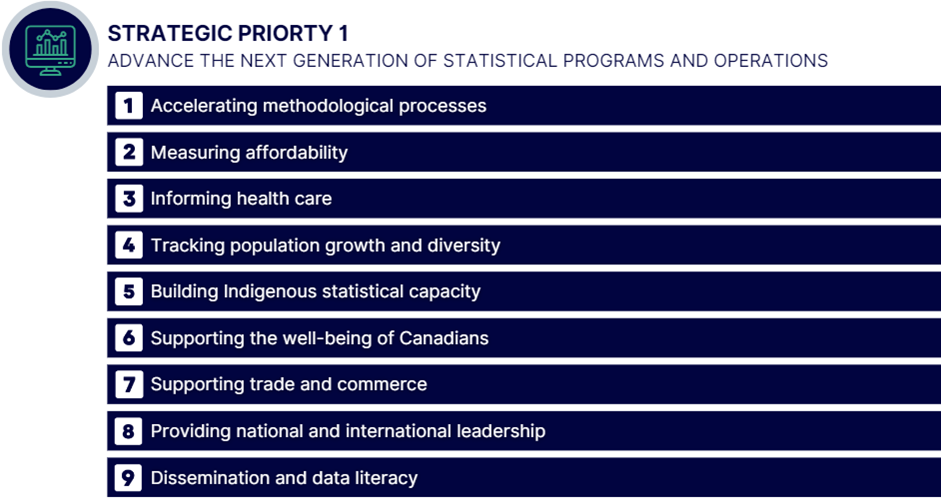
Text description of Strategic Priority 1
Strategic Priority 1: Advance the next generation of statistical programs and operations
- Accelerating methodological processess
- Measuring affordability
- Informing health care
- Tracking population growth and diversity
- Building Indigenous statistical capacity
- Supporting the well-being of Canadians
- Supporting trade and commerce
- Providing national and international leadership
- Dissemination and data literacy
Accelerating methodological processes
In response to various external factors affecting the collection, compilation and dissemination of statistical information, Statistics Canada will adapt its methodological processes. Through the methodological acceleration program, the agency will work to implement modern approaches to address various survey collection and processing challenges. These will leverage modern technical advancements and better fit the new digital nature of the Canadian data ecosystem.
Ongoing work across the agency will aim to adopt and develop new statistical methods, as well as streamline program costs. This will include testing and adjusting sample designs, leveraging greater machine learning techniques, and using modelling and small area estimation to complement data collection. The agency will therefore continue to build on its long-standing expertise in modelling to advance the development and use of analysis and microsimulation models, including the new retirement income model.
Leveraging artificial intelligence
To further align with the Government of Canada's digital objectives, the agency will operationalize greater amounts of large language models and generative artificial intelligence (AI). This will help create efficiencies by automating processes and will improve service delivery to Canadians.
To reduce its survey footprint, Statistics Canada expects to increase its use of administrative data. The objective is to minimize response burden, take advantage of the richness and coverage of available data from various sources, and leverage the agency's modern infrastructure to process these data. Linking data from different sources will help provide deeper insights on a wide variety of topics.
Measuring affordability
Statistics Canada produces statistical information that measures economic activity to provide timely updates on price changes experienced by Canadian consumers. Price indexes cover many aspects of the economy, including food, services and producer prices. The agency will continue to monitor inflation and demonstrate how prices affect everyday life in Canada.
The agency will focus on providing Canadians with more tools and information on food prices in the country. It will also evaluate the effects of final demand and intermediate demand price changes in consumer pricing on goods and services used by businesses in their production process.
This price index will allow policy makers, businesses and economists to better understand inflationary pressures along the supply chain so they can provide insights into potential inflationary trends in the future. The project will lead to high-quality statistical information that is available, accessible and relevant.

In 2023-24, Statistics Canada collaborated with Innovation, Science and Economic Development Canada (ISED) and Agriculture and Agri-Food Canada, to develop the new Food Price Data Hub. The hub gives Canadians access to a centralized source of information on food prices in the country. The hub will be regularly updated as new data and tools become available in 2024-25 to help Canadians make informed decisions about their food budget and other purchases.
In partnership with stakeholders, including the Canada Mortgage and Housing Corporation and Infrastructure Canada, Statistics Canada will also develop data strategies to better coordinate and align social and economic statistics related to housing. This work will support the development of housing-related policies and regulations to serve the Canadian population.
Informing health care
In 2024-25, Statistics Canada will focus on expanding and strengthening health care programs by providing timelier and more disaggregated population health data. To help improve decision making on all aspects of health in Canada, the agency will
- establish the Canadian Health Survey on Children and Youth as an annual exercise, increasing its frequency to provide timely insights and fill data gaps
- begin collection for the new Canadian Sexual and Reproductive Health Survey, from which data will be published in summer 2025
- continue helping Health Canada develop and implement the Canadian Dental Care Plan by working with key partners to develop baseline data on the oral health of Canadians—gathered through the Canadian Oral Health Survey and the Canadian Health Measures Survey—to inform policy decisions on how Canadians receive oral health care services in the coming years.
Statistics Canada will also support the work of federal, provincial and territorial governments to improve the health care system while adapting to the changing needs of Canadians. One way is through the Working Together Plan, which was developed jointly by these governments to identify a set of shared health priorities to improve integrated health care for Canadians.
In collaboration with Health Canada, the Public Health Agency of Canada (PHAC), the Canadian Institutes of Health Research (CIHR), the Canadian Institute for Health Information (CIHI), and the Canada Health Infoway, Statistics Canada will contribute to the Plan by measuring improvements in access to family health services, mental health and substance use services, and electronic health information. The agency also aims to work with the newly established Health Workforce Canada to produce indicators on the health workforce. In addition, Statistics Canada will support the implementation of the Shared Pan-Canadian Interoperability Roadmap. This project will help advance digital health tools and improve the ability of health care service providers to share health information among themselves and with patients.
Tracking population growth and diversity
Understanding Canada's demographic trends is at the heart of Statistics Canada's mandate. Several programs are in place to keep track of changes and provide more detailed insights into the country's growing diversity.

With the next Census of Population planned for 2026, preparation will be ramping up, with important statistical tests slated for May 2024 to improve the collection and quality of data. Leading-edge methods, data science and modelling will be leveraged during these tests and will be supported by a sampling design that uses experimental control panels. Statistics Canada will also look at reducing the response burden on Canadians by increasing its use of administrative data. Since the Census of Agriculture is conducted in parallel with the Census of Population, it will also undergo testing in 2024 in preparation for 2026.
Supporting the Action Plan for Official Languages
The new Action Plan for Official Languages 2023-2028 includes funding for Statistics Canada to build an ecosystem of data related to children who are eligible for instruction in the minority official language, as well as projections of that population.

Statistics Canada's Disaggregated Data Action Plan (DDAP) will continue to break down and analyze information even further in order to provide detailed data that reflect the level of diversity in Canada to help address gender gaps, racism and other systemic barriers. This innovative and critical initiative supports a whole-of-government approach to improve the collection, analysis, availability and publication of disaggregated data, as well as access to these data. As part of this effort, Statistics Canada will also provide updated standards and training to support the use of disaggregated data across other departments.
Statistics Canada's work under the DDAP in 2024-25 will include, among other projects, processing data from the Survey on Giving, Volunteering and Participating; collecting data for the Survey on Family Transitions; and releasing the fifth panel of the DDAP-funded Survey Series on People and their Communities.
Statistics Canada will continue to publish high-quality statistics on non-permanent residents (NPRs) living in Canada. The agency will continue its strong partnership and collaboration with Immigration, Refugees and Citizenship Canada to release estimates on NPRs, as this information is crucial to understanding international immigration in Canada and developing sound policy.
Statistics Canada will also work to link social indicators from the Census of Population and other social data sources to data on farm employment and ownership. This linkage project aims to give Canadians a better understanding of farming communities by providing relevant disaggregated data at the finest level of detail possible. This will help identify factors such as the Indigenous identity of farmers, their gender and whether they belong to any racialized groups.
Building Indigenous statistical capacity

As the Government of Canada continues to strengthen and renew its relationship with Indigenous peoples, Statistics Canada is committed to helping First Nations people, Métis and Inuit build the sustainable data capacity they need to deliver effective services to their communities and participate meaningfully with other levels of government.
Statistics Canada will carry out the third year of work related to Phase 1 of the Transformational Approach to Indigenous Data. This initiative leverages Statistics Canada's expertise to
- support Indigenous partners in building capacity through the production of co-developed research projects around issues that are important and relevant to them
- support Indigenous partners in developing and sustaining statistical capacity through training
- improve the visibility of Indigenous peoples in Canada's national statistics.
Leveraging web panels to reduce data gaps for First Nations people, Métis and Inuit
Statistics Canada is conducting the Survey Series on First Nations People, Métis and Inuit across Canada, including Nunavut, the Northwest Territories and Yukon. This web panel series will consist of three short surveys covering key information on health care access and discrimination, food affordability, employment and income, and emergency preparedness.
The internal Indigenous Data Directive will also be implemented to guide the creation, use, dissemination and governance of Indigenous data. The Indigenous Data Directive will support Government of Canada commitments, including the United Nations Declaration on the Rights of Indigenous Peoples Act Action Plan, the Truth and Reconciliation Commission Calls to Action, and the Data Strategy for the Federal Public Service. The directive will provide a coherent and coordinated agency-wide approach to navigate a path forward in support of Indigenous data sovereignty and support self-determination and reconciliation.
Supporting the well-being of Canadians
Ensuring the well-being of Canadians starts with having access to the data needed to make informed decisions. Over the next year, Statistics Canada will continue to report on various factors that impact the daily life of Canadians.
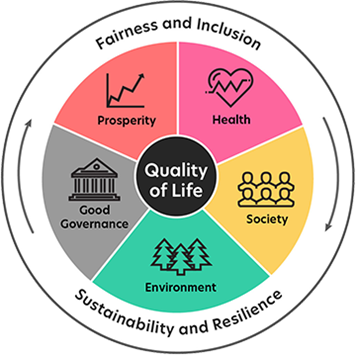
Text description of the diagram of the Quality of Life Framework
This image illustrates the Quality of Life Framework for Canada. It is represented as a circular graphic with the term "Quality of Life" in a circle at its centre. The circular graphic is divided into five segments which represent each of the five domains of the framework: Prosperity, Health, Society, Environment, and Good Governance. The two lenses of the framework, Fairness and Inclusion and Sustainability and Resilience, encircle the image, represented by curved arrows.
In fact, the agency plays a key role in implementing Canada's Quality of Life Framework, which aims to better incorporate quality of life measures "beyond gross domestic product" into decision making and budgeting. In 2024-25, Statistics Canada will continue to improve these measures; address key data gaps; and bring together important economic, social and environmental datasets through its online Quality of Life Hub.
Statistics Canada will continue to collaborate with Public Safety Canada and the Department of Justice Canada to release new information on justice and public safety. These publications will include data and analysis on repeated contact—or "re-contact"—with the criminal justice system; insights on criminal court outcomes for Indigenous, Black and other racialized accused people; and a simulation model of pathways through the criminal justice system.
In 2024-25, the agency will also collect responses for the second cycle of the Survey of Safety in Public and Private Spaces. Through an increased sample size of more than 150,000, data from the survey will shed light on the nature and characteristics of various forms of gender-based violence for numerous subpopulations of interest, including First Nations people, Métis and Inuit; 2SLGBTQ+ people; racialized groups; women with disabilities; and women living in rural communities.
Enhancing the labour statistics program
Statistics Canada will use ongoing processes to identify operational efficiencies, with a focus on the Labour Force Survey and the Survey of Employment, Payrolls and Hours. The agency will identify and document longer-term opportunities to enhance the labour statistics program by aligning it with the development and implementation of a national e-payroll system.
Supporting trade and commerce
Statistics Canada is committed to providing timely information on all aspects of the country's trade activity, both internal and international.
The agency will continue to modernize several of its statistical programs in the socio-economic domains to maintain or improve the granularity and accuracy of the data, as well as their relevance to Canadians. This includes the Annual Survey of Manufacturing and Logging Industries and the Annual Capital Expenditures Survey.
In 2024-25, Statistics Canada, working in close collaboration with the provinces and territories, as well as key federal government organizations such as ISED and PCO, will launch the Canadian Internal Trade Hub to provide key data and statistical products related to internal trade, such as internal labour mobility. The goal is to create a one-stop shop on internal trade statistics that all Canadians can access.
Measuring internal trade
In addition to the Canadian Internal Trade Hub, Statistics Canada will also carry out a new survey on internal trade in 2024-25, to shed light on the extent to which Canadian enterprises are conducting business in other provinces.
Statistics Canada's partnership with the Canada Border Services Agency (CBSA) will continue and grow to incorporate new data from the CBSA and centralize the production of international trade statistics, which are an important economic indicator. This change will ensure government resources are allocated efficiently and trade data are consistent overall, making them more accessible and providing real-time validation and analysis.
Budget 2023 provided $14 million over four years, starting in 2023-24, for Transport Canada to work with Statistics Canada. The objective is to develop transportation supply chain data that will inform decisions aimed at reducing congestion, making supply chains more efficient and planning for future infrastructure.

Text description of Promotional image for Canadian Tourism
Canada 365: Welcoming the World. Every Day.
Federal Tourism Growth Strategy
Canadian Tourism
In 2024-25, Statistics Canada will embark on a modernization initiative for the Tourism Statistics Program that will support the new Federal Tourism Growth Strategy. The project will be mainly centred on the National Travel Survey and the Visitor Travel Survey (VTS). It will look at alternative data sources and will also address a major data gap, as visitors accessing Canada by land are currently not being surveyed by the VTS.
Providing national and international leadership
Statistics Canada has a proven record of success and has earned a strong reputation, both at home and abroad, as a trusted and reliable data agency. It is therefore often asked to provide advice, share its expertise and help develop new standards or best practices adapted to emerging trends or challenges. As it continues to move forward in a data-driven society, the agency will have many opportunities to showcase its leadership.
Statistics Canada will focus on developing and promoting standards that enable high-quality disaggregated data products. These standards, published on Standards, data sources and methods, are recognized as a cornerstone of data coordination and ensure that the key basic concepts that define the data are understood. Statistics Canada will prioritize promoting the adoption of these foundational standards to government departments to facilitate the sharing of insights and overall data coordination within the Government of Canada. Two key data reference standards have been approved and adopted to date: one on the Canadian provinces and territories and another on the industry classification system. Moving forward, foundational data standards will be brought forward for approval to support the DDAP's essential disaggregation of subcategories of Indigenous people, gender, disability status and ethnocultural diversity.
Statistics Canada will continue to provide leadership, expertise and support functions for the implementation of the renewed 2023-2026 Data Strategy for the Federal Public Service. The agency will support the Treasury Board of Canada Secretariat and PCO in building a whole-of-government approach to improve the collection, analysis, availability and publication of data, while facilitating the identification, review and endorsement of data reference standards and frameworks to scale to the Government of Canada enterprise level.
The agency will continue to be an international leader in its field and support the international statistical system. To ensure the agency has robust and compatible data under the international statistical system, it will coordinate with and participate actively in various working groups, committees and other ad hoc statistical events in 2024-25. Specifically, the agency will support major international statistical initiatives related to the United Nations Statistical Commission, the United Nations Economic Commission for Europe's Conference of European Statisticians, and the Organisation for Economic Co-operation and Development's Committee on Statistics and Statistical Policy.
Following the publication of the 2021 Canadian Data Governance Standardization Collaborative Roadmap, the Standards Council of Canada launched the AI and Data Governance Standardization Collaborative, with Statistics Canada co-chairing the steering committee. The agency will play a key role in supporting the Pan-Canadian Artificial Intelligence Strategy and the forthcoming implementation of the Artificial Intelligence and Data Act. This includes participating in key international standard-setting bodies and developing new international work item proposals, as well as national standard-based deliverables and conformity assessment pilots.
Dissemination and data literacy

Text description of Promotional image for the StatCAN app
Our StatsCAN app has gotten a fresh new look!
Download or update the app today.
Download on the [Apple] App Store
Get it on Google Play
Statistics Canada will continue to find new and innovative ways to make information easier to access, while sharing its knowledge and expertise to help all Canadians develop their data literacy skills.
The Connecting with Canadians strategy will outline opportunities to adapt Statistics Canada's publishing model to meet the changing needs and behaviours of users in a flexible manner and reach the agency's many target audiences. In 2024-25, the agency will focus on the following:
- publishing high-quality, meaningful content on multiple platforms throughout the day, in a timely manner and in a format that is suitable for Canadians
- engaging Canadians through one-on-one interactions and developing new ways to showcase data and products, based on user needs
- reaching Canadians to create awareness while continuing to build and maintain trust in the agency.
Statistics Canada will also continue to leverage The Daily and expand the use of StatsCAN Plus, the StatsCAN app and the Eh Sayers podcast to ensure that statistical information reaches more Canadians.
Statistics Canada will keep investing in data literacy initiatives to increase statistical understanding and contribute to evidence-based decision making in Canada. The agency will build on the suite of products and courses available to Canadians.
The agency will also update the existing infrastructure for both the Social Data Linkage Environment and the Longitudinal Social Data Development Program to respond to the increased need for data linkages and harmonized indicators derived from administrative data. These efforts will allow Statistics Canada to take advantage of more efficient cloud functionality and diversify the range of statistical software used for data integration work.
Strategic Priority 2: Adopt a complete enabling infrastructure
An important way to support improved statistical operations is to ensure that Statistics Canada can rely on a modern enabling infrastructure. This includes adopting cutting-edge software and technologies, such as cloud computing and machine learning, to support data collection, analysis and management. These changes will make operations faster and more efficient, allowing the agency to deliver even deeper insights for Canadians.

Text description of Strategic Priority 2
Strategic Priority 2: Adopt a complete enabling infrastructure
- Promoting data-driven processes
- Heightening cloud-enabled services
- Leveraging artificial intelligence and machine learning
- Cyber security and privacy
Promoting data-driven processes
To transform itself into a national statistical agency that is even more modern and responsive to a data-driven world, Statistics Canada will continue to advance its data-driven processes. This will allow the agency to capitalize on the latest technology, maintain its relevance and enhance how it delivers services to Canadians.

An important business transformation initiative is currently underway to drive this change. This includes the Analytical Diversification project, which aims to shift the agency towards the use of open-source products such as R and Python. Aligned with the Government of Canada's Digital Ambition and digital principles, this will ensure consistency, accuracy and reliability in Statistics Canada's data-driven processes.
This work will also simplify cloud data management and aid in optimizing costs, allowing the agency to focus on maintaining and scaling cloud storage solutions that are tailored to its specific needs. Striking a balance between openness and privacy, this project will implement robust access controls to ensure that sensitive data are accessible only to authorized personnel. By adopting these measures, the agency can foster an environment of shared knowledge while upholding its ethical and legal responsibilities for data privacy.
Developing geolocated products
In preparation for the 2026 Census, Statistics Canada will develop several new geographic products. Key components of the statistical infrastructure will also be updated, such as the statistical frame of dwellings, the road network, the topographic data, and the administrative and statistical area boundaries used to create the geographic frame for collecting and disseminating census data.
By revamping social data processing through modern and agile approaches, Statistics Canada is set to develop a cutting-edge processing system in 2024-25. This initiative aims to enhance data ingestion, storage and processing methods, catering to the diverse analytical needs of statistical social programs. The new system will streamline operations; diminish redundant work; and introduce new capabilities, such as open-source analytical tools. By consolidating multiple legacy systems, this endeavour will not only ensure business continuity but also reduce manual interventions and repetitive tasks.
Furthermore, the agency will prioritize its Business Register and Statistical Building Register infrastructure so that it remains comprehensive and up to date and reflects Canada's ever-changing landscape. Improving this key infrastructure for surveys, statistical programs and the census will support efficient operations on a wide variety of social, economic and environmental topics, while providing Canadians with high-quality data and insights.
Heightening cloud-enabled services
Statistics Canada will continue to modernize service delivery by strengthening cloud-enabled services and fostering projects that aim to become cloud-native. The agency will update its cloud strategy to support program outcomes, resulting in greater efficiencies and better services from a streamlined cloud infrastructure. This will include leveraging the use of the secure cloud to conduct the 2026 Census of Population as much as possible.
The cloud program will enable secure, centralized cloud services to support the agency's statistical programs and activities in an effective and efficient way. This will ensure that all statistical programs are using the cloud well to fulfill their mandate.
For example, the agency is comprehensively redesigning its T1 business tax system to modernize and streamline the processing and management of business tax data. This initiative introduces automation and quality improvements to harness the power of cloud computing and open-source software, while increasing efficiencies for the agency and the Canadian population.
The Virtual Data Lab environment, which provides seamless and flexible access to datasets through a protected cloud environment, will be expanded to improve access and diversify data availability. The objective is to provide high-performance computing for academic research and facilitate access from smaller academic institutions located in remote regions. The agency will also work with the Canadian Research Data Centre Network to further improve and expand access to data for academic researchers. It will ensure that public use microdata files and confidential microdata files are made available through all access solutions, are representative of all Statistics Canada subject-matter areas and align with the interests of data users.
Leveraging artificial intelligence and machine learning

AI is set to change how work is done in many sectors and will certainly impact the fields of data and statistics. It is Statistics Canada's responsibility as a modern and forward-looking agency to stay on top of this emerging technology. The agency will not only play an active role in developing new standards on the use of AI across the government, but also take steps to safely integrate the technology into its own activities. This will support greater efficiency and improve the treatment of complex datasets.
With robotic process automation, Statistics Canada aims to streamline operations by automating manual, repetitive tasks. The initiative aims to minimize mundane work and also optimize resources for more strategic endeavours.
AI has already been used in several projects, including one geared towards users of international merchandise trade data who are interested in quantities and average unit prices of imported and exported goods, further broken down by country or other key dimension variables. Quantity data, which contribute to implicit unit prices, are not always accurately reported in customs documents. To improve the quality of these statistics, Statistics Canada developed and recently implemented a supervised machine learning process to identify and correct outlier unit prices within the millions of import transactions compiled monthly.
Cyber security and privacy

Canadians' privacy has always been a top concern for Statistics Canada. Given the vast repository of information it manages, the agency holds itself to a high standard in terms of the privacy and confidentiality of personal information. To protect the information of Canadians, the agency will continue to develop its modern infrastructure of methods, technologies and processes that enable secure data linkages and microdata access.
Additionally, the agency will continue to fortify its privacy measures by implementing governance structures and technical solutions for effective data de-identification, without compromising the agency's capability to conduct meaningful data analytics, sharing and innovation.
Statistics Canada's cyber security program will continue to evolve to protect the agency's infrastructure and data through improvements to risk assessment, vulnerability management and incident response programs. The cyber security program will continue to align with Government of Canada enterprise initiatives, including Secure Cloud Enablement and Defence, and the Cloud Access Security Broker, to ensure that Statistics Canada's infrastructure and data remain protected and secure in the agency's cloud environment.
Strategic Priority 3: Shape a healthy, diverse and skilled workforce to meet the current and future needs of Canadians
An important part of Statistics Canada's modernization journey is creating a more diverse workplace that is inclusive, equitable and respectful. Several internal projects will promote this goal and ensure that employees feel empowered and inspired to deliver on the agency's priorities and to serve Canadians. This is an important commitment for Statistics Canada, not just as an employer, but as a national statistical agency that aims to reflect Canada's diversity to better serve Canadians.
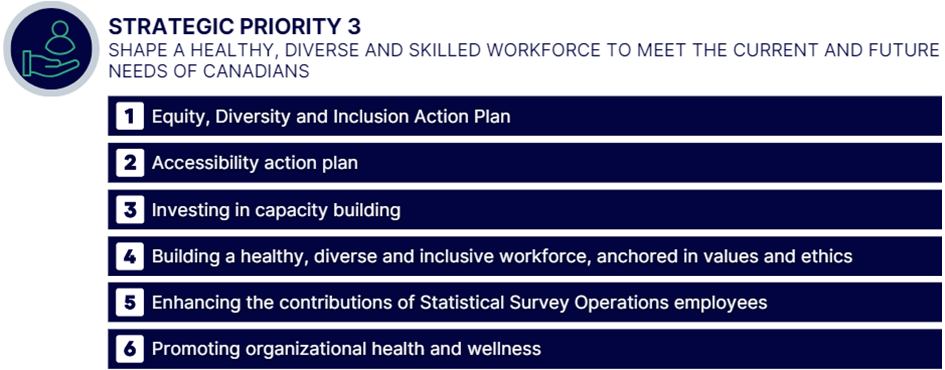
Text description of Strategic Priority 3
Strategic Priority 3: Shape a healthy, diverse and skilled workforce to meet the current and future needs of Canadians
- Equity, Diversity and Inclusion Action Plan
- Accessibility action plan
- Investing in capacity building
- Building a healthy, diverse and inclusive workforce, anchored in values and ethics
- Enhancing the contributions of Statistical Survey Operations employees
- Promoting organizational health and wellness
Equity, Diversity and Inclusion Action Plan

Statistics Canada's 2021-2025 Equity, Diversity and Inclusion Action Plan aims to ensure continued engagement, cohesion and progress to build an agency and a workforce that reflect the identities, abilities, backgrounds, cultures, skills, perspectives and experiences of Canada's evolving population. The agency is a leader in creating and maintaining an inclusive work environment that fosters a sense of belonging and is fair, equitable, supportive, welcoming and respectful. As a result of the agency's efforts, the overall self-identification rate in October 2023 was at 87.5%, which is a 20% increase compared with two years before. In addition, as of October 2023, representation had increased across all groups in the agency, exceeding targets based on labour market availability and workforce availability and closing previous gaps.
In November 2023, Statistics Canada welcomed employees of Statistical Survey Operations, formerly a separate employer. This important change has led to shifts in the agency's overall self-identification rate and representation across the four employment equity groups. The agency will continue its sustained efforts to increase the self-identification rate, close gaps, and build and maintain a diverse and inclusive workforce and workplace. This work will include producing guidance for establishing mandatory equity, diversity and inclusion training requirements and developing tools to provide dynamic employment equity progress reports. Statistics Canada will also offer training and information sessions (e.g., official languages training programs, sponsorship programs) and create various communication products, including self-declaration awareness campaigns.
Accessibility action plan
In compliance with the Accessible Canada Act, Statistics Canada launched its 2023-2025 accessibility action plan to build an accessibility-confident culture and a solid foundation where products, services, the workplace and workspaces are accessible by design. This plan aims to ensure that all Statistics Canada employees across the country are supported in a barrier-free environment, with their accessibility needs met.
As they become available, Statistics Canada will leverage and integrate new accessible formats, such as American Sign Language and langue des signes québécoise, braille, and web accessibility for screen readers, to ensure that Canadians can access its data with ease. The agency will produce guidance on accessibility requirements for software development to ensure they are respected. It will also work to provide its staff with accessible internal communications, training and information sessions, as well as quarterly reports to track and monitor progress and challenges.
Investing in capacity building
Fostering the next generation of data leaders requires an investment in capacity building, with a dedicated focus on successfully shifting the agency towards advanced methods and integrated data. Statistics Canada will continue to invest in its learning culture, enhancing knowledge across economic and social priorities, while developing the analytical skills of recruits, who will ensure that the agency continues to meet the information needs of Canadians. Internal training for employees at all levels will also be prioritized to strengthen knowledge on innovative methods to integrate data, survey design and processes; develop a horizontal understanding of business data; and build data analytical skills.
Building a healthy, diverse and inclusive workforce, anchored in values and ethics
Statistics Canada remains dedicated to actively addressing the Clerk of the Privy Council's Call to Action on Anti-Racism, Equity, and Inclusion in the Federal Public Service. This commitment extends to embracing the Message from the Clerk: Bringing our values and ethics to life in our changing environment. The objective is to integrate public sector values into the work environment, ensuring it is devoid of racism and discrimination. This will foster a culture where every employee experiences safety, respect, dignity and fairness.
Leveraging diverse networks, resources and leadership, Statistics Canada is committed to cultivating a workplace that is both respectful and inclusive. This entails establishing a safe space, where employees at every level can openly address and discuss work-related concerns, explore options, access resources, and use tools. Additionally, to strengthen the understanding of ethics across the agency, Statistics Canada will continue to deepen conversations on values and ethics through meetings with employees at all levels, and through support and tools from the Office of Values and Ethics, as well as the agency's Integrity and Respect Champion and integrity and respect awareness officers.
Enhancing the contributions of Statistical Survey Operations employees
Following the transition of Statistical Survey Operations interviewers to the core public service, and as benefits for these front-line employees start to materialize (such as higher pay rates, stabilized workloads, improved schedules, and expanded opportunities for career development and mobility within the federal public service), additional training and coaching will be provided in 2024-25. This is aimed at integrating new responsibilities and aligning them with Statistics Canada's modernization efforts, ensuring the ongoing relevance of the agency's workforce and making service delivery to Canadians more efficient.
Promoting organizational health and wellness
To build a diverse and more inclusive workforce, Statistics Canada must ensure the psychological health of its employees. To achieve this, the agency's health team will analyze data and disseminate findings from the Employee Wellness Survey, collected in late 2023. It will also provide a detailed toolkit for managers to help them identify actions they can take to support the psychological health of employees. Moreover, targeted interventions will be rolled out, and their impact will be measured to identify what works to improve psychological health in the workforce.
In addition to analyzing data from the Employee Wellness Survey, Statistics Canada will also release several pulse surveys throughout the year to better understand the employee experience. These will provide managers with the information they need to implement action plans to improve wellness-related issues. The delivery and promotion of wellness-related programming, including the Employee Assistance Program, facilitated training and workshops, will complement this work in an overall effort to build a healthy workforce.
Key risks
By continuously monitoring its internal and external environment, Statistics Canada addresses uncertainties related to its core responsibilities. The agency adopted an integrated risk management process to identify, assess and prioritize risks and respond to them. This approach guides the agency's business planning to ensure the timeliness, reliability and quality of its statistics. The agency has identified, assessed and ranked the following six corporate risksKey risk note * and developed corresponding strategies to mitigate each risk.
- Public trust: There is a risk that Statistics Canada may not be perceived as a trusted national statistical office.
Mitigation strategy: Communicate with Canadians to build awareness and promote public trust. - Organizational resilience: With resources being the agency's most valuable assets, it must continuously reassess its processes, implement major transformational initiatives, and transform to support employees through various people management strategies, ensuring adaptability to changing priorities for thriving in a continuously changing environment. The risks are outlined as follows:
- Empowering workforce excellence: There is a risk that Statistics Canada may not be able to deliver on its mandate effectively because of challenges in maintaining a high-performing, diverse and healthy workforce.
Mitigation strategy: Enhance and develop strategies that foster trust and a positive work environment to continue to build on a strong organizational culture. As well as addressing the agency's needs in recruitment, development, management and well-being of a diverse, skilled workforce and an inclusive and accessible workplace. - Operational resiliency: There is a risk that Statistics Canada may see an impact in the delivery of its programs and services because of the introduction of major transformation initiatives in technology, infrastructure, business, and strategic processes.
Mitigation strategy: Build and implement a complete enabling infrastructure by enacting transformation initiatives with a clear, purpose and commitment to removing barriers. Also, enable the development of the next generation of statistical programs and operations by creating frameworks, adopting innovative digital solutions and collaborating with partners to bridge gaps in the agency's capabilities.
- Empowering workforce excellence: There is a risk that Statistics Canada may not be able to deliver on its mandate effectively because of challenges in maintaining a high-performing, diverse and healthy workforce.
- Privacy and confidentiality: There is a risk that Statistics Canada may experience a privacy breach or wrongful disclosure of information.
Mitigation strategy: Ensure that controls and safeguards are in place to manage and protect the vast amount of confidential and sensitive information, strengthen the agency's data ethics and governance processes, and regularly assess the agency's information security and information technology posture. - Financial management: There is a risk that Statistics Canada may not be able to deliver on its mandate effectively because of fiscal constraints.
Mitigation strategy: Ensure effective financial management excellence through comprehensive managerial training and the continuous strengthening of processes and strategic investment, fostering awareness among managers about their accountabilities and financial responsibilities to deliver programs while optimizing the value obtained from public resources. - Relevance: There is a risk that Statistics Canada's statistical information and services may not meet the evolving needs and expectations of users.
Mitigation strategy: Continue to modernize internal operations to address the evolving data needs of external stakeholders. - Accuracy: There is a risk that Statistics Canada may not be able to acquire high-quality data or release accurate statistics.
Mitigation strategy: Strengthen instruments for validating methods and processes, ensure management practices are integrated into processes, and investigate published errors to identify and address deficiencies.
Snapshot of planned resources in 2024–25
- Planned spending: $654,143,413
- Planned full-time resources: 6,228
Related government priorities
Gender-based analysis plus

Statistics Canada's Centre for Gender, Diversity and Inclusion Statistics, created in 2018 and now supported by the Disaggregated Data Action Plan (DDAP), enables data users to more easily find disaggregated and intersectional data, analytical products and insights. The centre continues to address important gaps in available data and analysis; support data development and capacity-building strategies to measure gender, diversity and inclusion outcomes; and advance Gender-based Analysis Plus (GBA Plus) knowledge and capacity in Canada. Through the implementation of the DDAP, Statistics Canada is making progress in addressing information gaps and is providing more detailed data on the lived experiences of diverse population groups to support decision making aimed at addressing racism, inequalities and other systemic barriers.
The key objectives of the centre are to make equity, diversity and inclusion statistical insights available to Canadians; lead in the use of standards to measure identity factors across the government and beyond; and build GBA Plus capacity with other governmental or non-governmental organizations in their statistical activities. The centre created the Gender, Diversity and Inclusion Statistics Hub, which serves as the primary platform for disseminating products and information related to disaggregated and intersectional data. In 2024-25, the centre will continue its engagement with external partners to improve the hub's features and the functionalities available to users. To further improve data holdings, enhance data disaggregation and create research products, Statistics Canada also created the Sex, Gender and Sexual Orientation Statistics to report on the Gender Results Framework and will continue to update data annually where possible.
United Nations 2030 Agenda for Sustainable Development and the UN Sustainable Development Goals
Text description of Promotional image for the Sustainable Development Goals
Sustainable Development Goals
- No poverty
- Zero hunger
- Good health and well-being
- Quality education
- Gender equality
- Clean water and sanitation
- Affordable and clean energy
- Decent work and economic growth
- Industry, innovation and infrastructure
- Reduced inequalities
- Sustainable cities and communities
- Responsible consumption and production
- Climate action
- Life beyond water
- Life on land
- Peace, justice and strong institutions
- Partnerships for the goals
Statistics Canada will continue to play a key role in implementing the 2030 Agenda for Sustainable Development and the Sustainable Development Goals (SDGs).
Internationally, the agency is a senior member and co-chair of the Inter-agency and Expert Group on SDG Indicators (IAEG-SDGs). Beginning in late 2023 and continuing into 2024, the IAEG-SDGs will work on a revision of the Global Indicator Framework (GIF) for SDGs. This will include examining the 232 existing global indicators and undertaking a global consultation to determine whether any changes should be made to the framework.
Statistics Canada will assist in reporting on the GIF for Canada and finish migrating the agency's global indicator data hub to the Open SDG platform. This will provide users with an interactive experience to view Canada's reporting on the global indicators, as well as significantly increase the data disaggregation for the global indicators.
Domestically, Statistics Canada will carry on reporting on the Canadian Indicator Framework (CIF) for SDGs through the CIF data hub, including expanding data disaggregation whenever possible. In 2023, the agency also reviewed the CIF to determine whether changes to the indicators were necessary, an initiative that entailed a government-wide consultation.
In addition, Statistics Canada created a measure that was integrated into the Open SDG platform that will inform Canadians on the progress made to date on each indicator. The agency is also developing a tool to assess the quality of non-official data, allowing non-official data sources to be integrated to bridge data gaps in the reporting on both the GIF and the CIF.
More information on Statistics Canada's contributions to Canada's Federal Implementation Plan on the 2030 Agenda and the Federal Sustainable Development Strategy can be found in our Departmental Sustainable Development Strategy.
Program inventory
Statistical Information is supported by the following programs:
- Economic and Environmental Statistics
- Socio-economic Statistics
- Censuses
- Cost-Recovered Statistical Services
- Centres of Expertise.
Supporting information on planned expenditures, human resources, and results related to Statistics Canada's program inventory is available on GC InfoBase.
Internal services
In this section
Description
Internal services are the services that are provided within a department so that it can meet its corporate obligations and deliver its programs. There are 10 categories of internal services:
- management and oversight services
- communications services
- legal services
- human resources management services
- financial management services
- information management services
- information technology services
- real property management services
- materiel management services
- acquisition management services
Plans to achieve results
In 2024-25, Statistics Canada's internal services will guide and support the agency's new strategic plan, which aims to boost program impact, improve operations, and empower a diverse and high-performing workforce.
Through internal planning and the implementation of workforce strategies, the agency will prioritize building a diverse, inclusive and accessible workforce, while ensuring that current and future employees are well equipped and have access to new training opportunities. The agency will continue to modernize and improve its information management infrastructure and tools, as well as conduct meaningful internal consultations and audits that will provide support and solutions to meet organizational and employee needs.
Human resource planning
The composition of Statistics Canada's workforce has evolved significantly over the last few years, with 45% of the workforce having joined the agency since 2020. In addition, in November 2023, Statistics Canada welcomed employees of Statistical Survey Operations, formerly a separate employer, as part of its broader workforce governed by the Public Service Employment Act. The agency's workforce adjusts to respond to the cyclical nature and staffing needs of the Census program. Similarly, Statistics Canada's cost-recovery system results in the growth and contraction of its workforce based on the evolving needs of our stakeholders and policy makers. These important changes demonstrate an evolving workforce landscape, requiring sustained efforts to build and maintain a thriving employee culture and a psychologically healthy workplace, all while ensuring the agency has the skilled talent needed to continue to deliver timely statistical insights to Canadians. In light of these changes, Statistics Canada will update and refresh its Integrated Business and Human Resources Plan to enhance talent engagement by empowering employees and managers with resources and guidance at all stages of employees' careers. Furthermore, the agency will continue to build a diverse workforce representative of Canada's current and evolving population and promote and foster an inclusive and accessible workplace and a healthy, safe and secure hybrid work environment.
Statistics Canada was a government leader with the early adoption of a hybrid work model in September 2022, prior to the implementation of the Treasury Board's Direction on Prescribed Presence in the Workplace in April 2023. A hybrid work model is a critical part of Statistics Canada's modern workforce strategy. The agency established a robust hybrid framework to ensure continued adherence to the direction and articulate expectations for hybrid work. The agency also implemented a modern measurement strategy to track compliance, using integrated human resources administrative data and turnstile data.
It has since noted a significant increase in compliance with the framework and expects to see further improvement in 2024. Through ongoing collaboration with Public Services and Procurement Canada, the agency will also continue its office modernization project to update workspaces, furniture and equipment to further support a seamless hybrid experience for employees.
Learning and leadership
Statistics Canada will ensure a cohesive approach to learning and leadership, with a focus on analytical diversification and Government of Canada mandatory training. This will allow the agency to support the retention of diverse talent and contribute to the Government of Canada's priority of developing the next generation of public service leaders.
The introduction of new training options for open-source technologies and modern information technology (IT) practices in 2024-25 will help the agency deliver on its goal of upskilling its workforce. It will also nurture a diverse workforce that is agile and able to continue delivering relevant insights to Canadians at an ever-increasing pace.
Information technology
Statistics Canada's IT activities and outputs will help programs and projects to achieve the agency's strategic priority of building the next generation of statistical programs and operations.
Through digital leadership, Statistics Canada will have a balanced, well-architected and affordable digital footprint to provide Canadians with trusted data, statistical services and insights to support decision making.
Enhanced use of the cloud will result in significant business value for the agency and will reduce time for processing and analytics, reduce the number of copies of datasets by standardizing infrastructure and leveraging application programming interfaces, and augment security and privacy by implementing a leading access management platform. By enhancing cloud computing, the agency can drive cost efficiencies, foster innovation and support improved service delivery to Canadians.
Statistics Canada will advance its IT program through the lens of the user experience, by focusing on enabling its hybrid work model and objectives to achieve a more agile, inclusive and equipped workforce. It will also digitalize the onboarding process for new employees and improve the availability of accessible tools and technologies. The agency will lead and support digital talent and leadership strategies to build a workforce for digital-first delivery by aligning and engaging with the Treasury Board of Canada Secretariat and enterprise-wide community management initiatives, as articulated by the Directive on Digital Talent. The agency will also continue to develop digital talent using programs to support recruitment from Indigenous and neurodiverse population groups.
Improving the infrastructure for Statistics Canada employees provides a foundation to enhance the efficiency with which they can deliver products and services to Canadians, in terms of timeliness, granularity, accuracy and relevance. It will also enable the agency to move towards accessibility compliance, as mandated by the Accessible Canada Act.
Internal audit and evaluation
In 2024-25, the Audit and Evaluation Branch will conduct audits, evaluations and advisory engagements to generate insight into the appropriateness of decision making, governance structures and processes that enable the agency's employees to operate effectively within a strong management system. Moreover, evaluations with a user-centric focus will assess the relevance of programs and provide insight into the degree to which user needs are being considered and met in program design and delivery.
Snapshot of planned resources in 2024–25
- Planned spending: $82,496,920
- Planned full-time resources: 595
Related government priorities
Aligned with the Government of Canada's commitment to economic reconciliation with Indigenous people, Statistics Canada will actively contribute to improved socio-economic outcomes by increasing opportunities for First Nations, Métis and Inuit businesses through the procurement process.
Planning for contracts awarded to Indigenous businesses
Statistics Canada is committed to attaining the minimum target of 5% of the total value of procurement expenditures awarded to Indigenous businesses. Its strategy is to consider Indigenous businesses overall when planning a procurement process. Statistics Canada is conducting monthly monitoring to ensure that it is on track to meet or exceed the 5% target. The agency has established its forecast results based on past performance and consultation with internal clients for commodities where it has been successful in awarding contracts to Indigenous businesses.
The deputy head approved one exception for cloud services. Firstly, as a pathfinder in the government, Statistics Canada recently completed a significant migration to the cloud. The current cloud framework does not include an Indigenous business. Secondly, the cloud procurement has a substantial monetary value and would impact the achievement of the target. If Indigenous businesses are in the next cloud procurement framework, Statistics Canada will explore options to provide opportunities to these businesses.
Table 2: Total percentage of contracts with Indigenous businesses
| 5% reporting field | 2022-23 actual result | 2023-24 forecast result | 2024-25 planned result |
|---|---|---|---|
| Total percentage of contracts with Indigenous businesses | 8.27% | 5.1% | 5.1% |
Statistics Canada has adjusted its internal documentation to ensure that Indigenous businesses are considered for each requirement, and the procurement team regularly discusses challenges and successes and exchanges best practices. The agency's planned outreach activities are inviting Indigenous-owned companies to competitive processes and using set-aside strategies.
Planned spending and human resources
This section provides an overview of Statistics Canada's planned spending and human resources for the next three fiscal years and compares planned spending for 2024–25 with actual spending from previous years.
Spending
Table 3: Actual spending summary for core responsibilities and internal services ($ dollars)
The following table shows information on spending for each of Statistics Canada's core responsibilities and for its internal services for the previous three fiscal years. Amounts for the current fiscal year are forecasted based on spending to date.
| Core responsibilities and internal services | 2021-22 actual expenditures | 2022-23 actual expenditures | 2023-24 forecast spending |
|---|---|---|---|
| Statistical Information | 920,977,524 | 731,447,169 | 774,368,657 |
| Internal services | 89,989,424 | 110,581,024 | 85,947,503 |
| Total gross expenditures | 1,010,966,948 | 842,028,193 | 860,316,160 |
| Respendable revenue | -127,583,773 | -159,349,013 | -135,397,777 |
| Total net expenditures | 883,383,175 | 682,679,180 | 724,918,383 |
Explanation of table 3
Statistics Canada is funded by two sources: direct parliamentary appropriations and cost-recovery activities. It has the authority to generate $120 million annually in respendable revenue, related to two streams: statistical surveys and related services, and custom requests and workshops. If exceeded, a request can be made to increase the authority, as was the case in the last few years.
In recent years, respendable cost-recovery revenue has contributed between $120 million and $159 million annually to the agency's total resources. A large portion of this respendable revenue comes from federal departments to fund specific statistical projects. Respendable revenue increased in 2022-23 because of additional work associated with extra demands following the slowdown during the COVID-19 pandemic, as the easing of restrictions allowed collection of statistical information to resume. It was also associated with an increase in demands related to the 2021 Census.
Spending peaked in 2021-22, when the 2021 Census of Population and the 2021 Census of Agriculture were conducted. This is followed by a significant decrease in subsequent years as these activities wind down. This is typical for the agency because of the cyclical nature of the Census Program.
Table 4: Budgetary planning summary for core responsibilities and internal services (dollars)
The following table shows information on spending for each of Statistics Canada's core responsibilities and for its internal services for the upcoming three fiscal years.
| Core responsibilities and internal services | 2024-25 budgetary spending (as indicated in Main Estimates) | 2024-25 planned spending | 2025-26 planned spending | 2026-27 planned spending |
|---|---|---|---|---|
| Statistical Information | 774,143,413 | 774,143,413 | 818,320,102 | 1,084,058,981 |
| Internal services | 82,496,920 | 82,496,920 | 77,797,636 | 77,630,510 |
| Total gross expenditures | 856,640,333 | 856,640,333 | 896,117,738 | 1,161,689,491 |
| Respendable revenue | -120,000,000 | -120,000,000 | -120,000,000 | -120,000,000 |
| Total net expenditures | 736,640,333 | 736,640,333 | 776,117,738 | 1,041,689,491 |
Explanation of table 4
Reflected in 2024-25 are planned resources for new initiatives from Budget 2023, including the Canadian Dental Care Plan, Building a World-class Health Data System for Canadians and the Action Plan for Official Languages. These new initiatives are offset by the initiative to refocus government spending. Funding related to the Canadian Dental Care Plan for 2025-26 has not been secured yet. Funding for cloud operations for 2025-26 is not included in the planned spending because the enterprise-wide funding model is being developed. In the absence of an enterprise-wide funding model by 2025-26, funding will be sourced by Treasury Board of Canada Secretariat resources for that year.
Spending will begin to ramp up and peak in 2026-27 when the 2026 Census of Population and 2026 Census of Agriculture are conducted. This is typical for the agency because of the cyclical nature of the Census Program.
Table 5: 2024–25 budgetary gross and net planned spending summary (dollars)
The following table reconciles gross planned spending with net planned spending for 2024–25.
| Core responsibilities and internal services | 2024-25 gross planned spending | 2024-25 planned revenues netted against spending | 2024-25 planned net spending |
|---|---|---|---|
| Statistical Information | 774,143,413 | -120,000,000 | 654,143,413 |
| Internal services | 82,496,920 | 0 | 82,496,920 |
| Total | 856,640,333 | -120,000,000 | 736,640,333 |
Explanation of table 5
Statistics Canada has the authority to generate $120 million annually in respendable revenue, which is reflected in the 2024-25 planned revenues netted against expenditures.
Funding
Figure 1: Departmental spending 2021–22 to 2026–27
The following graph presents planned spending (voted and statutory expenditures) over time.
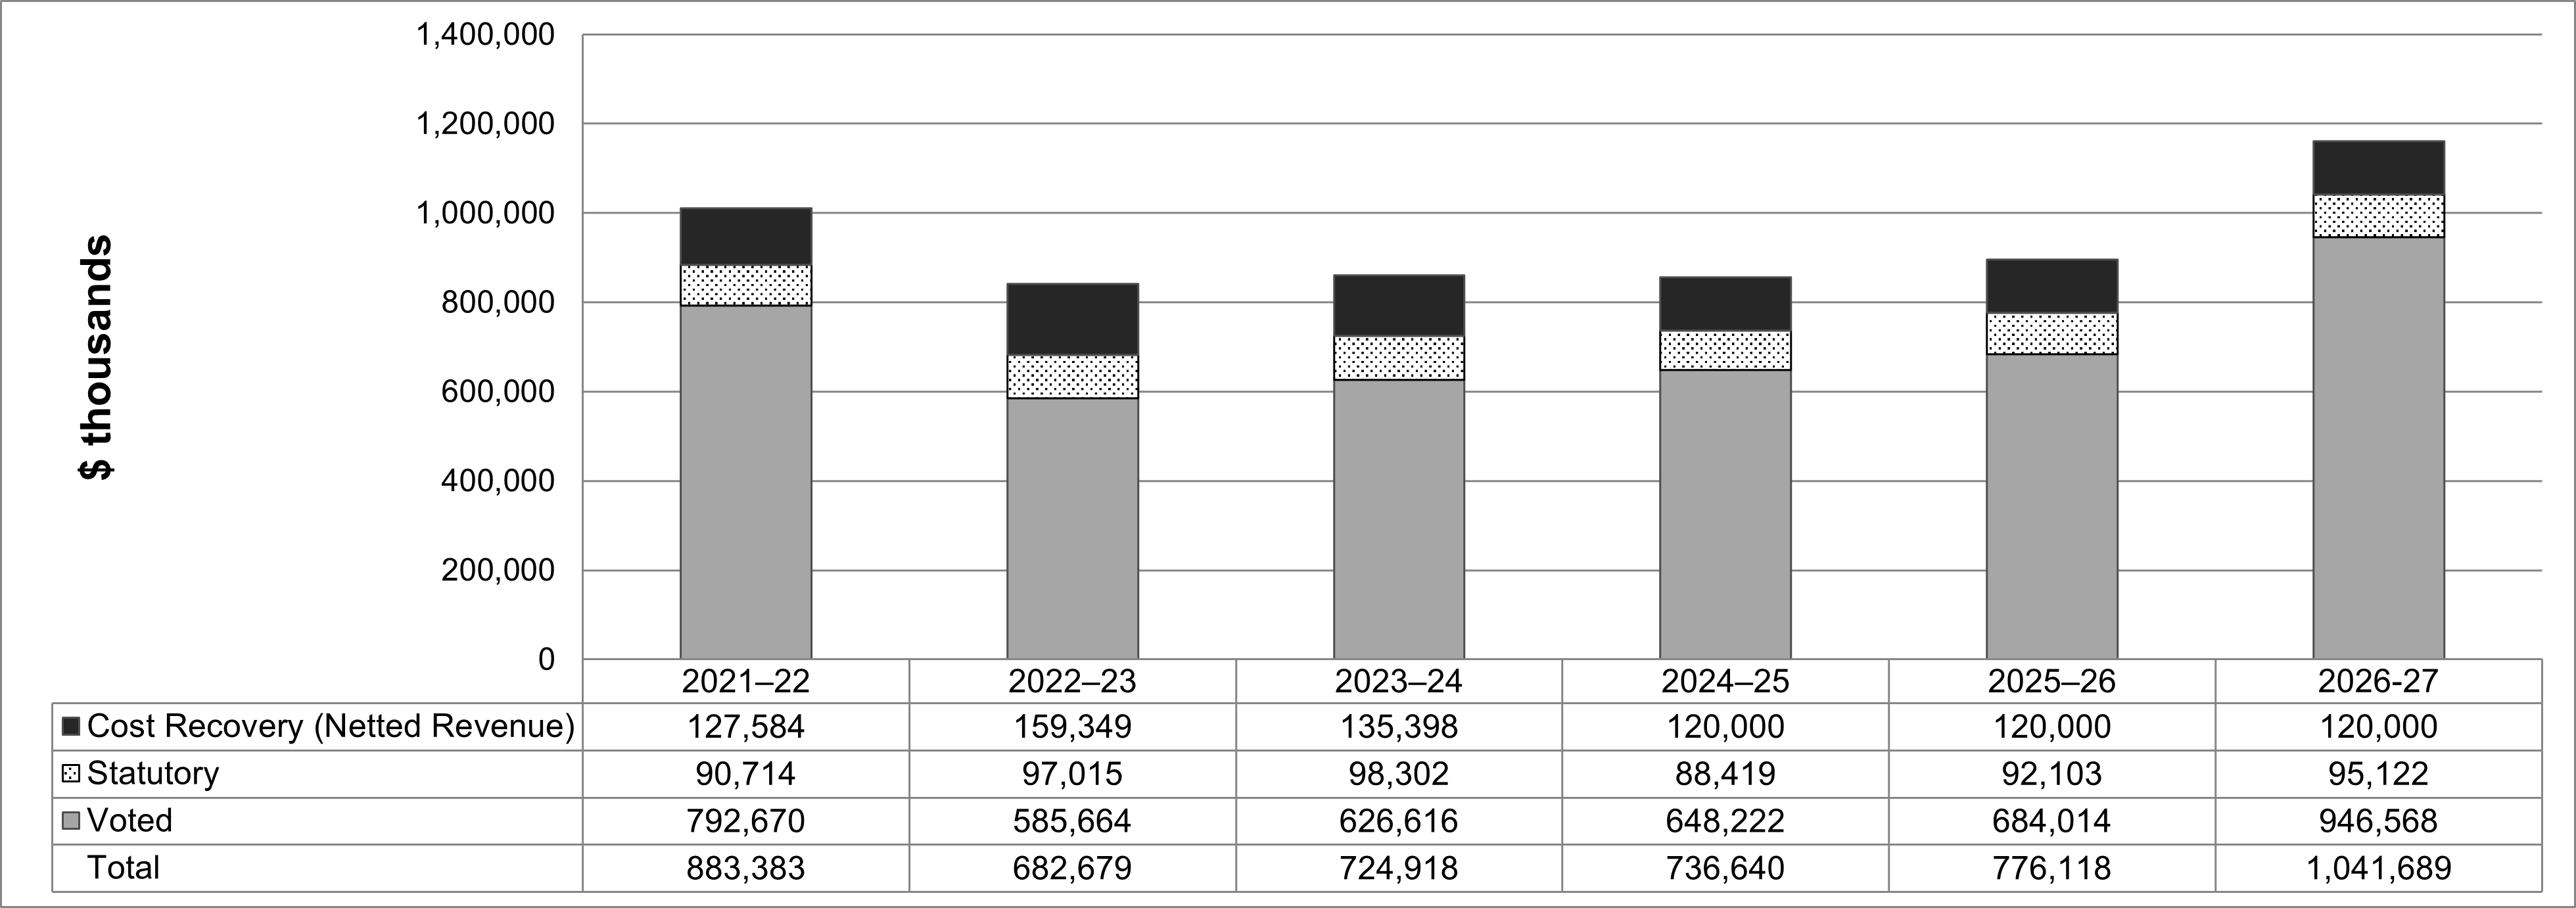
Text description of figure 1
| 2021–22 | 2022–23 | 2023–24 | 2024–25 | 2025–26 | 2026-27 | |
|---|---|---|---|---|---|---|
| Cost Recovery (Netted Revenue) | 127,584 | 159,349 | 135,398 | 120,000 | 120,000 | 120,000 |
| Statutory | 90,714 | 97,015 | 98,302 | 88,419 | 92,103 | 95,122 |
| Voted | 792,670 | 585,664 | 626,616 | 648,222 | 684,014 | 946,568 |
| Total | 883,383 | 682,679 | 724,918 | 736,640 | 776,118 | 1,041,689 |
Explanation of figure 1
The graph above shows that spending peaked in 2021-22, when the 2021 Census of Population and the 2021 Census of Agriculture were conducted. This is followed by a significant decrease in subsequent years as these activities wind down. Spending will begin to ramp up and will peak again in 2026-27, when the 2026 Census of Population and 2026 Census of Agriculture are conducted. This pattern is typical for the agency because of the cyclical nature of the Census Program. Funding for the 2026 Census of Population and Census of Agriculture was approved in 2023-24, with the first year of funding being 2023-24.
Estimates by vote
Information on Statistics Canada's organizational appropriations is available in the 2024–25 Main Estimates.
Future-oriented condensed statement of operations
The future-oriented condensed statement of operations provides an overview of Statistics Canada's operations for 2023–24 to 2024–25.
The forecast and planned amounts in this statement of operations were prepared on an accrual basis. The forecast and planned amounts presented in other sections of the Departmental Plan were prepared on an expenditure basis. Amounts may therefore differ.
A more detailed future-oriented statement of operations and associated notes, including a reconciliation of the net cost of operations with the requested authorities, are available at Statistics Canada's website.
Table 6: Future-oriented condensed statement of operations for the year ending March 31, 2025 (dollars)
| Financial information | 2023-24 forecast results | 2024-25 planned results | Difference (2024-25 planned results minus 2023-24 forecast results) |
|---|---|---|---|
| Total expenses | 979,235,252 | 1,017,500,551 | 38,265,299 |
| Total revenues | 135,397,777 | 120,000,000 | -15,397,777 |
| Net cost of operations before government funding and transfers | 843,837,475 | 897,500,551 | 53,663,076 |
Explanation of table 6
The increase in planned expenditures for 2024-25 is mainly explained by an increase in funding for the 2026 Census of Population and 2026 Census of Agriculture, as well as new initiatives announced in Budget 2023, which are offset by the initiative to refocus government spending. These new initiatives include the Canadian Dental Care Plan, Building a World-class Health Data System for Canadians and the Action Plan for Official Languages.
Statistics Canada has the authority to generate $120 million annually in respendable revenue, related to two streams: statistical surveys and related services, and custom requests and workshops. This amount may vary from year to year based on demand and the cyclical nature of the agency's cost-recovered services.
Human resources
Table 7: Actual human resources for core responsibilities and internal services
The following table shows a summary of human resources, in full-time equivalents (FTEs), for Statistics Canada's core responsibilities and for its internal services for the previous three fiscal years. Human resources for the current fiscal year are forecasted based on year to date.
| Core responsibilities and internal services | 2021-22 actual FTEs | 2022-23 actual FTEs | 2023-24 forecast FTEs |
|---|---|---|---|
| Statistical Information | 7,186 | 7,005 | 6,714 |
| Internal services | 713 | 833 | 587 |
| Total gross expenditures | 7,899 | 7,838 | 7,301 |
| Respendable revenue | -1,542 | -1,785 | -1,293 |
| Total | 6,357 | 6,053 | 6,008 |
Explanation of table 7
Similar to trends seen in planned spending, changes in FTEs from year to year are largely explained by the cyclical nature of the Census Program. Activity peaked in 2021-22, when the 2021 Census of Population and 2021 Census of Agriculture were conducted, and decreases sharply thereafter as these activities wind down.
Internal services resources from 2021-22 to 2022-23 included resources from temporary funding related to an initiative approved in 2018-19 to migrate the agency's infrastructure to the cloud.
Respendable revenue from 2021-22 to 2022-23 included FTE resources for additional work associated with extra demands following the slowdown during the COVID-19 pandemic, as the easing of restrictions allowed collection of statistical information to resume. It was also associated with an increase in demands related to the 2021 Census.
Table 8: Human resources planning summary for core responsibilities and internal services
The following table shows information on human resources, in full-time equivalents (FTEs), for each of Statistics Canada's core responsibilities and for its internal services planned for 2024–25 and future years.
| Core responsibilities and internal services | 2024-25 planned FTEs | 2025-26 planned FTEs | 2026-27 planned FTEs |
|---|---|---|---|
| Statistical Information | 6,228 | 6,466 | 6,773 |
| Internal services | 595 | 572 | 570 |
| Total gross expenditures | 6,823 | 7,038 | 7,343 |
| Respendable revenue | -1,190 | -1,190 | -1,190 |
| Total | 5,633 | 5,848 | 6,153 |
Explanation of table 8
Overall, Statistics Canada is expecting to maintain its capacity for delivering ongoing statistical programs in future years, with no significant shifts in resources. Similar to trends seen in planned spending, changes in FTEs from year to year are largely explained by the cyclical nature of the Census Program. Activity will begin to ramp up and will peak again in 2026-27, when the 2026 Census of Population and 2026 Census of Agriculture are conducted.
Reflected in 2024-25 are planned FTEs for new initiatives from Budget 2023, including the Canadian Dental Care Plan, Building a World-class Health Data System for Canadians and the Action Plan for Official Languages. Resources for the Canadian Dental Care Plan for 2025-26 are not included because the funding has not been secured yet. Resources for cloud operations for 2025-26 are not included in the planned FTEs because the enterprise-wide funding model is being developed.
Planned FTEs for respendable revenue are expected to maintain the same levels over the next three years.
Corporate information
Organizational profile
Appropriate minister(s):
The Honourable François-Philippe Champagne, P.C., M.P.
Institutional head:
Anil Arora
Ministerial portfolio:
Innovation, Science and Economic Development
Enabling instrument(s):
Year of incorporation / commencement:
The Dominion Bureau of Statistics was established in 1918. In 1971, with the revision of the Statistics Act, the agency became Statistics Canada.
Other:
Under the Statistics Act, Statistics Canada is required to collect, compile, analyze, abstract and publish statistical information relating to the commercial, industrial, financial, social, economic and general activities and condition of the people of Canada.
Statistics Canada has two primary objectives:
- provide statistical information and analysis on the economic and social structure and functioning of Canadian society, as a basis for developing, operating and evaluating public policies and programs; for public and private decision making; and for the general benefit of all Canadians
- promote the quality, coherence and international comparability of Canada's statistics through collaboration with other federal departments and agencies and the provinces and territories, in accordance with sound scientific standards and practices.
Statistics Canada's head office is located in Ottawa. There are regional offices across the country in Halifax, Sherbrooke, Montréal, Toronto, Sturgeon Falls, Winnipeg, Edmonton and Vancouver. There are also 35 research data centres located throughout the country in academic institutions. In addition, there are five secure rooms available for access by employees of federal departments and selected provincial ministries. These centres provide researchers with access to microdata from population and household survey programs in a secure setting. Canadians can follow the agency on Facebook, Instagram, LinkedIn, Reddit, X (Twitter) and YouTube.
Organizational contact information
Mailing address:
Statistics Canada
150 Tunney's Pasture Driveway
Ottawa, Ontario
K1A 0T6
Telephone:
- Toll-free: 1-800-263-1136
- International: 1-514-283-8300
TTY:
1-800-363-7629
Fax:
1-514-496-4879
Email:
Website(s):
Supplementary information tables
The following supplementary information tables are available on Statistics Canada's website:
Information on Statistics Canada's departmental sustainable development strategy can be found on Statistics Canada's website.
Federal tax expenditures
Statistics Canada's Departmental Plan does not include information on tax expenditures.
Tax expenditures are the responsibility of the Minister of Finance. The Department of Finance Canada publishes cost estimates and projections for government‑wide tax expenditures each year in the Report on Federal Tax Expenditures.
This report provides detailed information on tax expenditures, including objectives, historical background and references to related federal spending programs, as well as evaluations, research papers and gender-based analysis plus.
Definitions
List of terms
- appropriation (crédit)
- Any authority of Parliament to pay money out of the Consolidated Revenue Fund.
- budgetary expenditures (dépenses budgétaires)
- Operating and capital expenditures; transfer payments to other levels of government, organizations or individuals; and payments to Crown corporations.
- core responsibility (responsabilité essentielle)
- An enduring function or role performed by a department. The intentions of the department with respect to a core responsibility are reflected in one or more related departmental results that the department seeks to contribute to or influence.
- Departmental Plan (plan ministériel)
- A document that sets out a department's priorities, programs, expected results and associated resource requirements, covering a three‑year period beginning with the year indicated in the title of the report. Departmental Plans are tabled in Parliament each spring.
- departmental result (résultat ministériel)
- A change that a department seeks to influence. A departmental result is often outside departments' immediate control, but it should be influenced by program-level outcomes.
- departmental result indicator (indicateur de résultat ministériel)
- A factor or variable that provides a valid and reliable means to measure or describe progress on a departmental result.
- departmental results framework (cadre ministériel des résultats)
- A framework that consists of the department's core responsibilities, departmental results and departmental result indicators.
- Departmental Results Report (rapport sur les résultats ministériels)
- A report on a department's actual performance in a fiscal year against its plans, priorities and expected results set out in its Departmental Plan for that year. Departmental Results Reports are usually tabled in Parliament each fall.
- full‑time equivalent (équivalent temps plein)
- A measure of the extent to which an employee represents a full person‑year charge against a departmental budget. Full‑time equivalents are calculated as a ratio of assigned hours of work to scheduled hours of work. Scheduled hours of work are set out in collective agreements.
- gender-based analysis plus (GBA Plus) (analyse comparative entre les sexes plus [ACS Plus])
- An analytical tool used to support the development of responsive and inclusive policies, programs and other initiatives. GBA Plus is a process for understanding who is impacted by the issue or opportunity being addressed by the initiative; identifying how the initiative could be tailored to meet diverse needs of the people most impacted; and anticipating and mitigating any barriers to accessing or benefitting from the initiative. GBA Plus is an intersectional analysis that goes beyond biological (sex) and socio-cultural (gender) differences to consider other factors, such as age, disability, education, ethnicity, economic status, geography, language, race, religion, and sexual orientation.
- government-wide priorities (priorités pangouvernementales)
- For the purpose of the 2024–25 Departmental Plan, government-wide priorities are the high-level themes outlining the government's agenda in the 2021 Speech from the Throne: building a healthier today and tomorrow; growing a more resilient economy; bolder climate action; fighter harder for safer communities; standing up for diversity and inclusion; moving faster on the path to reconciliation and fighting for a secure, just, and equitable world.
- horizontal initiative (initiative horizontale)
- An initiative in which two or more federal organizations are given funding to pursue a shared outcome, often linked to a government priority.
- Indigenous business (enterprise autochtones)
- As defined on the Indigenous Services Canada website in accordance with the Government of Canada's commitment that a mandatory minimum target of 5% of the total value of contracts is awarded to Indigenous businesses annually.
- non‑budgetary expenditures (dépenses non budgétaires)
- Net outlays and receipts related to loans, investments and advances, which change the composition of the financial assets of the Government of Canada.
- performance (rendement)
- What an organization did with its resources to achieve its results, how well those results compare to what the organization intended to achieve, and how well lessons learned have been identified.
- plan (plan)
- The articulation of strategic choices, which provides information on how an organization intends to achieve its priorities and associated results. Generally, a plan will explain the logic behind the strategies chosen and tend to focus on actions that lead up to the expected result.
- planned spending (dépenses prévues)
- For Departmental Plans and Departmental Results Reports, planned spending refers to those amounts presented in the Main Estimates.
A department is expected to be aware of the authorities that it has sought and received. The determination of planned spending is a departmental responsibility, and departments must be able to defend the expenditure and accrual numbers presented in their Departmental Plans and Departmental Results Reports. - program (programme)
- Individual or groups of services, activities or combinations thereof that are managed together within a department and that focus on a specific set of outputs, outcomes or service levels.
- program inventory (répertoire des programmes)
- An inventory of a department's programs that describes how resources are organized to carry out the department's core responsibilities and achieve its planned results.
- result (résultat)
- An external consequence attributed, in part, to an organization, policy, program or initiative. Results are not within the control of a single organization, policy, program or initiative; instead, they are within the area of the organization's influence.
- statutory expenditures (dépenses législatives)
- Expenditures that Parliament has approved through legislation other than appropriation acts. The legislation sets out the purpose of the expenditures and the terms and conditions under which they may be made.
- target (cible)
- A measurable performance or success level that an organization, program or initiative plans to achieve within a specified time period. Targets can be either quantitative or qualitative.
- voted expenditures (dépenses votées)
- Expenditures that Parliament approves annually through an Appropriation Act. The vote wording becomes the governing conditions under which these expenditures may be made.