Archived – Quarterly Financial Report for the quarter ended September 30, 2013

Statement outlining results, risks and significant changes in operations, personnel and program

A) Introduction

Statistics Canada's mandate

Statistics Canada is a member of the Industry portfolio.

Statistics Canada's role is to ensure that Canadians have access to a trusted source of statistics on Canada that meet their highest priority needs.

The Agency's mandate derives primarily from the Statistics Act. The Act requires that the Agency collects, compiles, analyzes and publishes statistical information on the economic, social, and general conditions of the country and its people. It also requires that Statistics Canada conducts the Census of Population and the Census of Agriculture every fifth year, and protects the confidentiality of the information with which it is entrusted.

Statistics Canada also has a mandate to co-ordinate and lead the national statistical system. The Agency is considered a leader, among statistical agencies around the world, in co-ordinating statistical activities to reduce duplication and reporting burden.

More information on Statistics Canada's mandate, roles, responsibilities and programs can be found in the 2013–2014 Main Estimates and in the Statistics Canada 2013–2014 Report on Plans and Priorities.

The quarterly financial report:

Statistics Canada has the authority to collect and spend revenue from other government departments and agencies, as well as from external clients, for statistical services and products.

Basis of presentation

This quarterly report has been prepared by management using an expenditure basis of accounting. The accompanying Statement of Authorities includes the agency's spending authorities granted by Parliament and those used by the agency consistent with the Main Estimates for the 2013-2014 fiscal year. This quarterly report has been prepared using a special purpose financial reporting framework designed to meet financial information needs with respect to the use of spending authorities.

The authority of Parliament is required before moneys can be spent by the Government. Approvals are given in the form of annually approved limits through appropriation acts or through legislation in the form of statutory spending authority for specific purposes.

As part of the Parliamentary business of supply, the Main Estimates must be tabled in Parliament on or before March 1 preceding the new fiscal year. Budget 2012 was tabled in Parliament on March 29, after the tabling of the Main Estimates on February 28, 2012. As a result, the measures announced in Budget 2012 could not be reflected in the 2012–2013 Main Estimates.

In fiscal year 2012-2013, frozen allotments were established by Treasury Board authority in departmental votes to prohibit the spending of funds already identified as savings measures in Budget 2012. In 2013-2014, the changes to departmental authorities were reflected in the 2013–2014 Main Estimates tabled in Parliament.

The Agency uses the full accrual method of accounting to prepare and present its annual departmental financial statements that are part of the departmental performance reporting process. However, the spending authorities voted by Parliament remain on an expenditure basis.

B) Highlights of fiscal quarter and fiscal year-to-date results

This section highlights the significant items that contributed to the net decrease in resources available for the year, as well as actual expenditures for the quarter ended September 30.
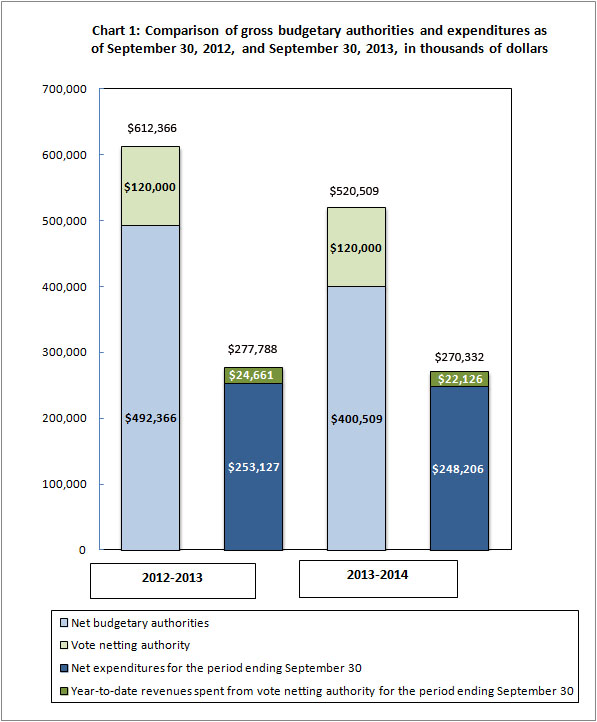
Description for chart 1

Chart 1 outlines the gross budgetary authorities, which represent the resources available for use for the year as of September 30.

Significant changes to authorities

There were no changes to Statistics Canada's authorities in the second quarter.

Total authorities available for 2013-2014 have decreased by $91.9 million, or 15%, from the previous year, from $612.4 million to $520.5 million (Chart 1). This net decrease was mostly the result of the following:

  • decreased funding for the 2011 Census of Population and the National Household Survey ($43.3 million), as well as the 2011 Census of Agriculture ($1.9 million) as the programs are winding down
  • reductions related to Budget 2012 ($18.3 million), which were included in the 2013–2014 Main Estimates
  • the carry-forward amount has not been received as of the end of the second quarter of 2013-2014 as it was in 2012-2013
  • partly offset by an increase in funding for collective agreements ($9.2 million).

In addition to the appropriations allocated to the Agency through the Main Estimates, Statistics Canada also has vote net authority within Vote 105, which entitles the Agency to spend revenues collected from other government departments, agencies, and external clients to provide statistical services. Vote netting authority is stable at $120 million in each of the fiscal years 2012-2013 and 2013-2014.

Significant changes to expenditures

Total expenditures recorded for the second quarter, ending September 30, 2013, decreased $16.9 million, or 11%, from the same quarter of the previous year, from $147.9 million to $131.0 million. Year-to-date expenditures recorded to the end of the second quarter decreased $7.4 million, or 3%, from $277.8 million to $270.3 million. (See Table A: Year-to-year Variation in Departmental Expenditures by Standard Object.)

Statistics Canada spent approximately 52% of its authorities by the end of the second quarter, compared with 45% in the same quarter of 2012-2013.

Table summary
This table displays the variance of departmental expenditures by standard object between fiscal 2012-2013 to 2013-2014. The variance is calculated for the year to date expenditures as of the end of the second quarter. The row headers provide information by standard object. The column headers provide information in thousands of dollars and percentage variance for the year to date variation as of the end of the second quarter.

Table A: Variation in Departmental Expenditures by Standard Object (unaudited)
Variation in Departmental Expenditures by Standard Object Q2 year-to-date variation
$'000 %
(01) Personnel -10,830 -4.2
(02) Transportation and communications -831 -14.3
(03) Information -5 -2.6
(04) Professional and special services 949 21.3
(05) Rentals 532 9.3
(06) Repair and maintenance 131 98.5
(07) Utilities, materials and supplies 306 41.4
(08) Acquisition of land, buildings and works - -
(09) Acquisition of machinery and equipment 2,340 436.6
(10) Transfer payments - -
(12) Other subsidies and payments -48 -87.3
Total gross budgetary expenditures -7,456 -2.7
Less revenues netted against expenditures
Revenues -2,535 -10.3
Total net budgetary expenditures -4,921 -1.9

01) Personnel: In early 2013-2014, Statistics Canada incurred expenditures for severance liquidations related to the signing of collective agreements. These expenditures were offset by reduced payments related to the Workforce Adjustment Directive and by lower salary expenditures resulting from a smaller workforce.

09) Acquisition of machinery and equipment: The increase was the result of acquiring computer equipment in the first quarter.

The decrease in revenues was primarily the result of timing differences between years for the receipts of funds and scheduled key deliverables.

C) Risks and uncertainties

Budgetary pressures, arising from reduced appropriations and reduced cost-recovery revenues, resulted in financial and human resource management challenges in 2012-2013. To manage human resource risks, the Agency opted to move quickly to implement all mandated program adjustments and corresponding workforce reductions. To manage financial risks, given uncertainties over the timing of costs arising from workforce adjustment and the speed of implementation of program adjustments, additional controls were implemented on non-salary expenditures and a number of significant expenditures were re-profiled.

In 2013-2014, Statistics Canada plans to continue to meet these challenges with the following actions and mitigation strategies:

  • additional analysis, monitoring and validation of financial and human resources information through a modified monthly financial package for budget holders
  • review of monthly project dashboards in place across the Agency to monitor project issues, risks and alignment with approved budgets
  • continued realignment and reprioritization of work.

D) Significant changes to operations, personnel and programs

2011 Census of Population and the National Household Survey

Data quality studies for the 2011 Census and National Household Survey will continue through 2013-2014. Major releases for the 2011 National Household Survey occurred on May 8th, June 26th, and September 11th 2013, and are now complete.

E) Budget 2012 implementation

This section provides an overview of the savings measures announced in Budget 2012 that are being implemented to refocus government and programs, make it easier for Canadians and businesses to deal with their government, as well as modernize and reduce the back office.

Statistics Canada's savings target as announced in Budget 2012 Economic Action Plan is $33.9 million by 2014-2015. This reduction is being implemented progressively, beginning with $8.3 million on April 1, 2012, rising to $18.3 million on April 1, 2013, in order to achieve the full reduction by April 1, 2014. The reductions, as of April 1, 2013, have been reflected in Statistics Canada's Main Estimates. To meet this target, Statistics Canada has focused resources where they are most needed.

The savings incurred through these program adjustments represent moderate reductions in the production of statistics to support development, administration, and evaluation of policy, while continuing to meet the public's highest priority needs. In some cases, the information will continue to be available in a different format. A full list of program adjustments is available online.

Expenditures in the current quarter of 2013-2014 are lower than in the same quarter of the previous fiscal year. The reduction is mainly the result of the reduced workforce required after implementing the program adjustments mentioned above.

There are no financial risks or uncertainties related to these reductions.

Approval by senior officials

The original version was signed by
Wayne R. Smith, Chief Statistician
Stéphane Dufour, Chief Financial Officer

Table summary
This table displays the departmental expenditures by standard object for the fiscal year 2012-2013. The row headers provide information by standard object for expenditures and revenues. The column headers provide information in thousands of dollars for planned expenditures for the year ending March 31; expended during the quarter ended September 30; and year to date used at quarter-end 2012-2013.

Departmental budgetary expenditures by Standard Object (unaudited)
  Fiscal year 2013-2014
Planned expenditures for the year ending March 31, 2014 Expended during the quarter ended September 30, 2013 Year-to-date used at quarter-end
in thousands of dollars
Expenditures
(01) Personnel 419,449 119,296 249,327
(02) Transportation and communications 26,173 2,581 4,972
(03) Information 2,656 120 189
(04) Professional and special services 33,940 3,553 5,404
(05) Rentals 9,224 4,000 6,248
(06) Repair and maintenance 11,951 231 264
(07) Utilities, materials and supplies 12,355 577 1,045
(08) Acquisition of land, buildings and works - - -
(09) Acquisition of machinery and equipment 4,586 677 2,876
(10) Transfer payments - - -
(12) Other subsidies and payments 175 2 7
Total gross budgetary expenditures 520,509 131,037 270,332
Less revenues netted against expenditures
Revenues 120,000 7,063 22,126
Total revenues netted against expenditures 120,000 7,063 22,126
Total net budgetary expenditures 400,509 123,974 248,206
Table summary
This table displays the departmental expenditures by standard object for the fiscal year 2013-2014. The row headers provide information by standard object for expenditures and revenues. The column headers provide information in thousands of dollars for planned expenditures for the year ending March 31; expended during the quarter ended September 30; and year to date used at quarter-end 2013-2014.

Departmental budgetary expenditures by Standard Object (unaudited)
  Fiscal year 2012-2013
Planned expenditures for the year ending March 31, 2013 * Expended during the quarter ended September 30, 2012 Year-to-date used at quarter-end
in thousands of dollars
Expenditures
(01) Personnel 462,103 137,635 260,157
(02) Transportation and communications 36,595 2,927 5,804
(03) Information 4,812 117 195
(04) Professional and special services 45,908 2,976 4,455
(05) Rentals 11,603 3,423 5,717
(06) Repair and maintenance 21,345 112 132
(07) Utilities, materials and supplies 17,984 296 739
(08) Acquisition of land, buildings and works - - -
(09) Acquisition of machinery and equipment 11,213 430 536
(10) Transfer payments 561 - -
(12) Other subsidies and payments 242 10 55
Total gross budgetary expenditures 612,366 147,926 277,788
Less revenues netted against expenditures
Revenues 120,000 19,606 24,661
Total revenues netted against expenditures 120,000 19,606 24,661
Total net budgetary expenditures 492,366 128,320 253,127
Table summary
This table displays the departmental authorities for the fiscal year 2013-2014. The row headers provide information by type of authority, Vote 105 – Net operating expenditures and Budgetary Statutory authorities. The column headers provide information in thousands of dollars for Total available for use for the year ending March 31; used during the quarter ended September 30; and year to date used at quarter-end for 2013-2014.

Statement of Authorities (unaudited)
  Fiscal year 2013-2014
Total available for use for the year ending March 31, 2014* Used during the quarter ended September 30, 2013 Year-to-date used at quarter-end
in thousands of dollars
Vote 105 – Net operating expenditures 338,342 108,432 217,122
Statutory authority – Contribution to employee benefit plans 62,167 15,542 31,084
Total budgetary authorities 400,509 123,974 248,206
Table summary
This table displays the departmental authorities for the fiscal year 2012-2013. The row headers provide information by type of authority, Vote 105 – Net operating expenditures and Budgetary Statutory authorities. The column headers provide information in thousands of dollars for Total available for use for the year ending March 31; Used during the quarter ended September 30; and year to date used at quarter-end for 2012-2013.

Statement of Authorities (unaudited)
  Fiscal year 2012-2013
Total available for use for the year ended March 31, 2013*,** Used during the quarter ended September 30, 2012 Year-to-date used at quarter-end
in thousands of dollars
Vote 105 – Net operating expenditures 423,208 111,030 218,547
Statutory authority – Contribution to employee benefit plans 69,158 17,290 34,580
Total budgetary authorities 492,366 128,320 253,127

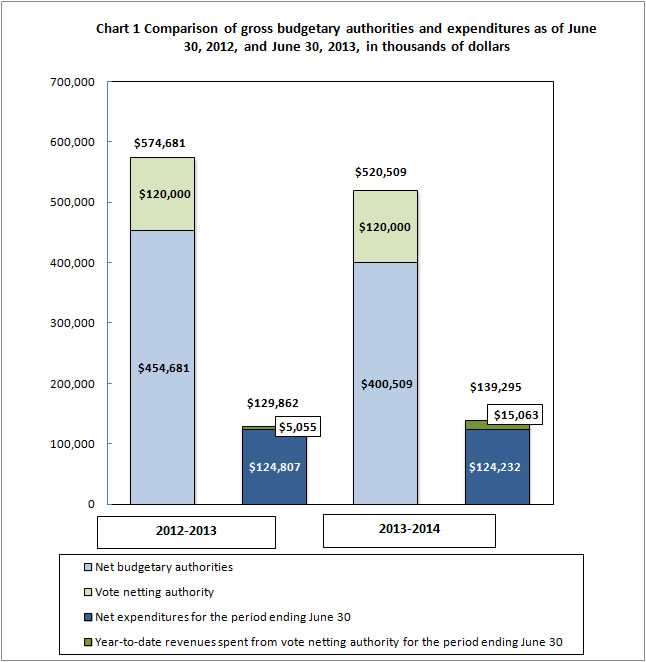
Description for chart 1
Comparison of gross budgetary authorities and expenditures as of June 30, 2012, and June 30, 2013, in thousands of dollars

This bar graph shows Statistics Canada's budgetary authorities and expenditures, in thousands of dollars, as of June 30, 2012 and 2013:

  • As at June 30, 2012
    • Net budgetary authorities: $454,681
    • Vote netting authority: $120,000
    • Total authority: $574,681
    • Net expenditures for the period ending June 30: $124,807
    • Year-to-date revenues spent from vote netting authority for the period ending June 30: $5,055
    • Total expenditures: $129,862
  • As at June 30, 2013
    • Net budgetary authorities: $400,509
    • Vote netting authority: $120,000
    • Total authority: $520,509
    • Net expenditures for the period ending June 30: $124,232
    • Year-to-date revenues spent from vote netting authority for the period ending June 30: $15,063
    • Total expenditures: $139,295


Archived – Quarterly Financial Report for the Quarter Ended Ended June 30, 2013

Statement outlining results, risks and significant changes in operations, personnel and program

A) Introduction

Statistics Canada's mandate

Statistics Canada is a member of the Industry Portfolio.

Statistics Canada's role is to ensure that Canadians have access to a trusted source of statistics on Canada that meet their highest priority needs.

The Agency's mandate derives primarily from the Statistics Act. The Act requires that the Agency collects, compiles, analyzes and publishes statistical information on the economic, social, and general conditions of the country and its people. It also requires that Statistics Canada conducts the Census of Population and the Census of Agriculture every fifth year, and protects the confidentiality of the information with which it is entrusted.

Statistics Canada also has a mandate to coordinate and lead the national statistical system. The Agency is considered a leader among statistical agencies around the world in co‑ordinating statistical activities to reduce duplication and reporting burden.

More information on Statistics Canada's mandate, roles, responsibilities and programs can be found in the 2013–2014 Main Estimates and in the Statistics Canada 2013–2014 Report on Plans and Priorities.

The quarterly financial report

Statistics Canada has the authority to collect and spend revenue from other government departments and agencies, as well as from external clients, for statistical services and products.

Basis of presentation

This quarterly report has been prepared by management using an expenditure basis of accounting. The accompanying Statement of Authorities includes the agency's spending authorities granted by Parliament and those used by the agency consistent with the Main Estimates for the 2013-2014 fiscal year. This quarterly report has been prepared using a special purpose financial reporting framework designed to meet financial information needs with respect to the use of spending authorities.

The authority of Parliament is required before moneys can be spent by the Government. Approvals are given in the form of annually approved limits through appropriation acts or through legislation in the form of statutory spending authority for specific purposes.

As part of the Parliamentary business of supply, the Main Estimates must be tabled in Parliament on or before March 1 preceding the new fiscal year. Budget 2012 was tabled in Parliament on March 29, after the tabling of the Main Estimates on February 28, 2012. As a result, the measures announced in Budget 2012 could not be reflected in the 2012-2013 Main Estimates.

In fiscal year 2012-2013, frozen allotments were established by Treasury Board authority in departmental votes to prohibit the spending of funds already identified as savings measures in Budget 2012. In 2013-2014, the changes to departmental authorities were reflected in the 2013-2014 Main Estimates tabled in Parliament.

The Agency uses the full accrual method of accounting to prepare and present its annual departmental financial statements that are part of the departmental performance reporting process. However, the spending authorities voted by Parliament remain on an expenditure basis.

B) Highlights of fiscal quarter and fiscal year-to-date results

This section highlights the significant items that contributed to the net decrease in resources available for the year, as well as actual expenditures for the quarter ended June 30.

Description for chart 1


Chart 1 outlines the gross budgetary authorities, which represent the resources available for use for the year as of June 30.

Significant changes to authorities

Total authorities available for 2013-2014 have decreased by $54.2 million, or 9%, from the previous year, from $574.7 million to $520.5 million (Chart 1). This net decrease was mostly the result of the following:

  • decreased funding for the 2011 Census of Population and the National Household Survey ($43.3 million), as well as the 2011 Census of Agriculture ($1.9 million)
  • reductions for Budget 2012 ($18.3 million), which were included in the 2013-2014 Main Est­imates
  • partly offset by an increase in funding for collective agreements ($9.2 million).

In addition to the appropriations allocated to the Agency through the Main Estimates, Statistics Canada also has vote net authority within Vote 105, which entitles the Agency to spend revenues collected from other government departments, agencies, and external clients to provide statistical services. Vote netting authority is stable for 2012-2013 and 2013-2014 at $120 million in each of the fiscal years.

Significant changes to expenditures

Total expenditures recorded for the first quarter, ending June 30, 2013, increased by $9.4 million, or 7%, from the same quarter of the previous year, from $129.9 million to $139.3 million (see Table A: Year-to-year Variation in Departmental Expenditures by Standard Object).

Statistics Canada spent approximately 26% of its authorities by the end of the first quarter, compared with 23% in the same quarter of 2012-2013.

Table A: Year-to-year Variation in Departmental expenditures by Standard Object (Q1 2012-2013 to Q1 2013-2014) (unaudited)
This table displays the variance of departmental expenditures by standard object between fiscal 2012-2013 to 2013-2014. The variance is calculated for the first quarter variances. The row headers provide information by standard object. The column headers provide information in thousands of dollars and percentage variance for the first quarter variances.
Departmental Expenditures Variation by Standard Object Year-to-year variation, Q1 2012-2013 to Q1 2013-2014
000$ %
(01) Personnel 7,509 6.1
(02) Transportation and communications -485 -16.9
(03) Information -8 -10.4
(04) Professional and special services 372 25.2
(05) Rentals -45 -2.0
(06) Repair and maintenance 12 57.1
(07) Utilities, materials and supplies 25 5.7
(08) Acquisition of land, building and works - -
(09) Acquisition of machinery and equipment 2,093 1,974.5
(10) Transfer payments - -
(12) Other subsidies and payments -40 -88.9
Total gross budgetary expenditures 9,433 7.3
Less revenues netted against expenditures
Revenues 10,008 198.0
Total net budgetary expenditures -575 -0.5

01) Personnel: In the first quarter of 2013-2014, Statistics Canada incurred expenditures for severance liquidations related to the signing of collective agreements and a small amount related to the Workforce Adjustment Directive. These expenditures were partly offset by lower salary expenditures resulting from a smaller workforce.

09) Acquisition of machinery and equipment:The increase was the result of acquiring computer equipment in the first quarter.

The increase in revenues was primarily the result of a timing difference in the receipt of funds from a census cost-sharing agreement with another government department. In 2013-2014, the funds were received in the first quarter; in 2012-2013, they were received in the second quarter.

C) Risks and uncertainties

Budgetary pressures, arising from reduced appropriations and reduced cost-recovery revenues, resulted in significant challenges for financial and human resource management in 2012-2013. To manage human resource risks, the Agency opted to move quickly to implement all mandated program adjustments and corresponding workforce reductions. To manage financial risks, given uncertainties over the timing of costs arising from workforce adjustment and the speed of implementation of program adjustments, additional controls were implemented on non-salary expenditures and a number of significant expenditures were re-profiled.

In 2013-2014, Statistics Canada plans to continue to meet these challenges with the following actions and mitigation strategies:

  • additional analysis, monitoring and validation of financial and human resources information through a modified monthly financial package for budget holders
  • review of monthly project dashboards in place across the Agency to monitor project issues, risks and alignment with approved budgets
  • continued realignment and reprioritization of work.

D) Significant changes to operations, personnel and programs

2011 Census of Population and the National Household Survey

Major releases for the 2011 National Household Survey are scheduled from May through August 2013: data certification and processing activities are progressing as planned. Data quality studies for the 2011 Census and National Household Survey will continue through 2013-2014.

E) Budget 2012 implementation

This section provides an overview of the savings measures announced in Budget 2012 that are being implemented to refocus government and programs; make it easier for Canadians and business to deal with their government; and modernize and reduce the back office.

Statistics Canada's savings target as announced in Budget 2012 Economic Action Plan is $33.9 million by 2014-2015. This reduction is being implemented progressively, beginning with $8.3 million on April 1, 2012, rising to $18.3 million on April 1, 2013, in order to achieve the full reduction by April 1, 2014. The reductions as of April 1, 2013 have been reflected in Statistics Canada's Main Estimates. To meet this target, Statistics Canada has focused resources where they are most needed.

The savings incurred through these program adjustments represent moderate reductions in the production of statistics to support development, administration, and evaluation of policy, while continuing to meet the public's highest priority needs. In some cases, the information will continue to be available in a different format. A full list of program adjustments is available online.

Expenditures in the current quarter of 2013-2014 are lower, excluding the costs associated with severance liquidation, than in the same quarter of the previous fiscal year. The $11.5 million reduction is mainly the result of the reduced workforce required after implementing the program adjustments mentioned above.

There are no financial risks or uncertainties related to these reductions.

Approval by senior officials

The original version was signed by
Wayne R. Smith, Chief Statistician
Stéphane Dufour, Chief Financial Officer

Table 2 Departmental budgetary expenditures by Standard Object (unaudited) This table displays the departmental expenditures by standard object for the fiscal year 2013-2014. The row headers provide information by standard object for expenditures and revenues. The column headers provide information in thousands of dollars for planned expenditures for the year ending March 31; expended during the quarter ended June 30; and year to date used at quarter-end 2013-2014.
  Fiscal year 2013-2014
Planned expenditures for the year ending March 31, 2014 Expended during the quarter ended June 30, 2013 Year to date used at quarter-end
in thousands of dollars
Expenditures
(01) Personnel 419,449 130,031 130,031
(02) Transportation and communications 26,173 2,391 2,391
(03) Information 2,656 69 69
(04) Professional and special services 33,940 1,851 1,851
(05) Rentals 9,224 2,248 2,248
(06) Repair and maintenance 11,951 33 33
(07) Utilities, materials and supplies 12,355 468 468
(08) Acquisition of land, building and works - - -
(09) Acquisition of machinery and equipment 4,586 2,199 2,199
(10) Transfer payments - - -
(12) Other subsidies and payments 175 5 5
Total gross budgetary expenditures 520,509 139,295 139,295
Less revenues netted against expenditures
Revenues 120,000 15,063 15,063
Total revenues netted against expenditures 120,000 15,063 15,063
Total net budgetary expenditures 400,509 124,232 124,232
Table 3 - This table displays the departmental expenditures by standard object for the fiscal year 2012-2013. The row headers provide information by standard object for expenditures and revenues. The column headers provide information in thousands of dollars for planned expenditures for the year ending March 31; expended during the quarter ended June 30; and year to date used at quarter-end 2012-2013.
  Fiscal year 2012-2013
Planned expenditures for the year ending March 31, 2013 * Expended during the quarter ended June 30, 2012 Year-to-date used at quarter-end
in thousands of dollars
Expenditures
(01) Personnel 462,103 122,522 122,522
(02) Transportation and communications 26,759 2,876 2,876
(03) Information 3,681 77 77
(04) Professional and special services 34,641 1,479 1,479
(05) Rentals 8,475 2,293 2,293
(06) Repair and maintenance 16,069 21 21
(07) Utilities, materials and supplies 13,801 443 443
(08) Acquisition of land, building and works - - -
(09) Acquisition of machinery and equipment 8,424 106 106
(10) Transfer payments 561 - -
(12) Other subsidies and payments 167 45 45
Total gross budgetary expenditures 574,681 129,862 129,862
Less revenues netted against expenditures
Revenues 120,000 5,055 5,055
Total revenues netted against expenditures 120,000 5,055 5,055
Total net budgetary expenditures 454,681 124,807 124,807
Table 4 Statement of Authorities (unaudited)
This table displays the departmental authorities for the fiscal year 2013-2014. The row headers provide information by type of authority, Vote 105 – Net operating expenditures and Budgetary Statutory authorities. The column headers provide information in thousands of dollars for Total available for use for the year ending March 31; used during the quarter ended June 30; and year to date used at quarter-end for 2013-2014.
  Fiscal year 2013-2014
Total available for use for the year ending March 31, 2014* Used during the quarter ended June 30, 2013 Year to date used at quarter-end
in thousands of dollars
Vote 105 – Net operating expenditures 338,342 108,690 108,690
Statutory authority – Contribution to employee benefit plans 62,167 15,542 15,542
Total Budgetary authorities 400,509 124,232 124,232
Table 5 - Statement of Authorities (unaudited)
This table displays the departmental authorities for the fiscal year 2012-2013. The row headers provide information by type of authority, Vote 105 – Net operating expenditures and Budgetary Statutory authorities. The column headers provide information in thousands of dollars for Total available for use for the year ending March 31; Used during the quarter ended June 30; and year to date used at quarter-end for 2012-2013.
  Fiscal year 2012-2013
Total available for use for the year ended March 31, 2013* , ** Used during the quarter ended June 30, 2012 Year to date used at quarter-end
in thousands of dollars
Vote 105 – Net operating expenditures 385,523 107,517 107,517
Statutory authority – Contribution to employee benefit plans 69,158 17,290 17,290
Total Budgetary authorities 454,681 124,807 124,807

Video - Canadian Agriculture Statistics

Catalogue number: Catalogue number: 11-629-x

Issue number: 2014002

November 2014

Canadian Agriculture Statistics - Transcript

Census of Agriculture Video: Description of visuals

(Video title appears onscreen.)

Statistics Canada's produces a wealth of high-quality information on farms and farmers in Canada. This includes data concerning production and farming practices, demographics and economic indicators. For example, did you know: that in 2011, there were 22 farms for every supermarket in Canada.

(The camera begins panning downward to reveal a barn in front of a landscape and a tractor to the left of the barn. The camera then pans backwards to reveal a chicken, a cow and a pig. As the camera pans, the words "Production and farming practices, demographics and economics" are displayed onscreen.)

(The camera pans away from the first scene, and through the number "0" within the number "2011." The number rotates, and then disappears. A supermarket appears on screen. The camera pans backwards to reveal a map of Canada, and 22 images of farms are scattered around the map.)

The total greenhouse area in Canada was equivalent to over 14,000 regulation size National Hockey League rinks.

(The camera pans backwards through a greenhouse. After a couple of seconds, the vegetation inside the greenhouse transforms into an NHL hockey rink. The words "14,000 NHL hockey rinks" appear on screen, and two hockey players are seen skating on the ice.)

Canada produced enough chickens for every person in Toronto to have 6 wings during every Toronto Maple Leafs game in one regular season.

(The camera pans backward to reveal a living room. The previous scene appears on the television screen located on the wall which is bookended by two speakers. The camera stops to see a man sitting on the couch watching television. The screen shot of the living room cracks like an egg. Each half of the frame separates and moves out of view.)

Canada produced 7.7 billion eggs, which provided enough protein for everyone in Saskatchewan and Manitoba for a year.

(An egg moving backwards appears onscreen. The words "7.7 billion" are shown rotating around the egg. The egg suddenly falls through the sky. Several other eggs are seen free- falling behind the main one. The main egg hits the ground to form a map of Canada and the yolk highlights the provinces, "Saskatchewan" and "Manitoba.")

Canada produced enough apples to give all the people living in five provinces an apple a day for a whole year.

(The camera pans to the right (the previous scene disappears) into an orchard. The camera moves quickly forward through an orchard, and focuses on an apple falling off a tree. The apple contains a Canadian map. The provinces of Alberta, Saskatchewan, Manitoba, Nova Scotia and Prince Edward Island light up, and flags identify these provinces.)

The total supply of beef and veal in Canada was enough to provide each Canadian with a hamburger every day for a year.

(The bottom half of a hamburger bun is displayed in front of the map, and is quickly dressed with meat, lettuce and the top half of the hamburger bun to form a complete hamburger. The camera pans backwards, and a bite is taken out of the burger. A calendar appears below the hamburger, and the pages are ripped off, one by one, from January to December. A Canadian flag then appears overtop the calendar.)

The 2011 Census of Agriculture found that less than 1% of Canadians are farm operators. Yet all Canadians participate in the agri-food sector when they buy items at the grocery store. Statistics Canada opens the doors on agriculture in Canada, with high-quality information that ranges from the farm to the grocery aisle. Visit the Statistics Canada website to learn more!

(A tractor passes in front of the scene, revealing farmland. Bales of hay, three chickens and two cows appear on screen. The words "Less than 1% of Canadians are farm operators" appear on a sign onscreen. The camera pans backward from the farmland into a supermarket, where a silhouette of a woman is seen shopping, as well as a silhouette of a man pushing a cart though the market. This scene fades out through the window of a barn to reveal a landscape. Still moving backwards, a chicken appears and crows, with the website address www.statcan.gc.ca/agriculturestatistics coming out of its beak.)

(The scene fades to black, but the website address remains in view.)

(The website address fades to black, and the Canada wordmark fades in.)

2011 Census of Agriculture

Archived information

Archived information is provided for reference, research or recordkeeping purposes. It is not subject to the Government of Canada Web Standards and has not been altered or updated since it was archived. Please "contact us" to request a format other than those available.

Date modified:

Releases

Archived information

Archived information is provided for reference, research or recordkeeping purposes. It is not subject to the Government of Canada Web Standards and has not been altered or updated since it was archived. Please "contact us" to request a format other than those available.

Data products
Description Geography level Release date
Farm and farm operator data: All farm and farm operator variables for 2011 and 2006 to the census division level. Only 2011 data will be published for the census consolidated subdivisions. Canada, province, territory, census agricultural region, census division and census consolidated subdivision May 10, 2012
Selected historical farm and operator data from the Census of Agriculture: Available without charge in CANSIM: Tables 004-0001 to 004-0017. Canada and province December 10, 2012
Agriculture–National Household Survey linkage data: A socioeconomic overview of the farm population available without charge in CANSIM: Tables 004-0100 to 004-0129. Canada and province November 27, 2013
Reference products
Description Geography level Release date
Reference maps: The reference maps provide the geographic boundaries, codes and names for all geographic areas appearing in data tables for the 2011 Census of Agriculture. Canada (excluding the territories), province, census agricultural region, census division and census consolidated subdivision May 10, 2012
Geography products
Description Geography level Release date
2011 Census agricultural regions boundary file and reference guide: A cartographic boundary file that delineates census agricultural regions, the subprovincial geographic areas created for disseminating agriculture statistics. Canada (excluding the territories), province and census agricultural region May 10, 2012
Agricultural ecumene boundary file and reference guide: A boundary file that delineates areas of significant agricultural activity in Canada as indicated by the 2011 Census of Agriculture. This file is generalized for small-scale mapping. Canada (excluding the territories), province and census division August 2012
Analytical products
Description Geography level Release date
Canadian Agriculture at a Glance: Short, analytical articles on the agriculture sector accompanied by charts, tables, maps and full-colour photos. All available geographic areas as analysis requires Planned dates:
February 18, 2014
March 18, 2014
April 22, 2014
May 29, 2014
July 29, 2014
August 26, 2014
October 28, 2014
Custom products and services
Description Geography level Release date
Custom products and services using client-defined data combinations from the 2011 Census of Agriculture farm and operator databases. Census of Agriculture standard geographic areas and user-defined areas (subject to confidentiality) May 10, 2012
Custom products and services from the census geographic component database. Census of Agriculture standard geographic areas and user-defined areas (subject to confidentiality) Fall 2012
Custom products and services from the Agriculture–Population database. Census of Agriculture standard geographic areas and user-defined areas (subject to confidentiality) November 27, 2013
Custom products and services from the historical databases. Census of Agriculture standard geographic areas and user-defined areas (subject to confidentiality) Available anytime

Contact information: Census of Agriculture, Data and Subject-Matter Consulting, 1-800-236-1136, 613-951-1090 or STATCAN.infostats-infostats.STATCAN@canada.ca.

Date modified:

Environmental statistics: measuring natural capital for the long-term well-being of Canadians

 
Statistics Canada presents Talking Stats. —Connecting. Collaborating. Learning—

The presentation highlighted Statistics Canada’s changing role in providing environmental statistics. Topics addressed included the growing focus on ecosystems and ecosystem goods and services statistics; the benefits of environment-economic accounting; and areas for future development such as working with other data partners and developing a comprehensive approach to statistics on environment activity and the “green economy”. This presentation was followed by a panel discussion with experts.

When: Thursday, October 2, 2014, 9:00 a.m. to 12:00 p.m. (noon)

Where: Holiday Inn Vancouver Centre, Arbutus Ballroom, Main level, 711 West Broadway, Vancouver, British Columbia

Cost: Free

Registration is closed.

Presentor

Wayne R. Smith, Chief Statistician of Canada, Statistics Canada

Wayne R. Smith, Chief Statistician of Canada, Statistics Canada

Mr. Smith completed an Honours BA and Master of Economics at Carleton University in Ottawa. He joined Statistics Canada in 1981. From 2004 to 2010, as Assistant Chief Statistician, he was responsible for a variety of programs and surveys. In September 2010, by order-in-council, Mr. Smith was appointed interim Chief Statistician, and confirmed as Chief Statistician of Canada in January 2011.


Moderator

Kevin Roberts, Director, Environment, Energy and Transportation Statistics Division, Statistics Canada

Kevin Roberts, Director, Environment, Energy and Transportation Statistics Division, Statistics Canada

Mr. Roberts graduated from Carleton University in Geography in 1987 and joined Statistics Canada that same year. He worked in the Geography Division and for the Census of Population project. He subsequently moved to the industrial statistics domain where he was responsible for managing the manufacturing statistics program. In 2010, he was appointed as Director for the Operations and Integration Division and last April, he became the Director of the newly formed Environment, Energy and Transportation Statistics Division.


Panelists

Carolyn Cahill, Assistant Director, Environment, Energy and Transportation Statistics Division, Statistics Canada

Carolyn Cahill, Assistant Director, Environment, Energy and Transportation Statistics Division, Statistics Canada

Ms. Cahill holds a Bachelor’s degree of Applied Science in Mechanical Engineering from the University of Ottawa (1990) and a Master’s degree of Environmental Studies from York University (1994). She has worked on Statistics Canada’s Environmental Statistics Program since 2006. She is currently responsible for delivering this program which includes surveys, environmental-economic accounts and analytical publications.

 
Frank Came, Senior Advisor, GLOBE Group

Frank Came, Senior Advisor, GLOBE Group

Mr. Came is a graduate of the National Defense College of Canada and a former Officer in the Royal Canadian Navy. He has been with the GLOBE Group since 2003 and holds extensive experience in the environmental and sustainable development sectors, both in business and government. Through his extensive national and international network, Mr. Came has developed an in-depth understanding of the environmental business sector having served as President of the British Columbia Environment Industries Association. He has served in senior positions at Treasury Board of Canada Secretariat and Privy Council Office; and was a Director General at Western Economic Diversification Canada.

 
Elisa Campbell, Director of Regional and Strategic Planning, Metro Vancouver

Elisa Campbell, Director of Regional and Strategic Planning, Metro Vancouver

Ms. Campbell completed an Honours BA in Political Science at the University of Toronto and a Bachelors of Architecture at the University of British Columbia. She has worked for many years at the forefront of implementing solutions for resilient, prosperous, and livable built and natural environments in the context of global urbanization and a warming planet. Her expertise and work in environmental planning, urban design, green buildings, and low carbon communities has earned recognition from the Canadian Institute of Planners, the American Society of Landscape Architects, the Canadian Home Builders Society, and others.

 
Dr. John Nyboer, Executive Director, Canadian Industrial Energy End-use Data and Analysis Centre, Simon Fraser University

Dr. John Nyboer, Executive Director, Canadian Industrial Energy End-use Data and Analysis Centre, Simon Fraser University

Dr. Nyboer has undergraduate degrees in biology from the University of Alberta, and education from the University of Toronto, and holds a Master and a Doctorate in Natural Resource Management from Simon Fraser University. He has over 25 years’ experience in data analysis, energy modelling, policy, and analysis and issues related to greenhouse gas emissions. His current work has garnered him an international reputation in the development and use of energy data and the development of energy intensity and energy efficiency indicators for industry.

 
Jay Ritchlin, Director, Western Region, David Suzuki Foundation

Jay Ritchlin, Director, Western Region, David Suzuki Foundation

Mr. Ritchlin has a degree in biology from Kenyon College and has worked in environmental science, advocacy and education for 15 years. He leads the Western Region team in its efforts to achieve sustainable fisheries and aquatic management in Canada. Mr. Ritchlin oversees the sustainable seafood project and provides additional support for the identification of sustainable aquaculture producers and the assessment of emerging seafood certification schemes. He is also on the steering committee of the World Wildlife Fund (WWF) Salmon Aquaculture Dialogues and the technical advisory board of the Aquaculture Stewardship Council.


A Nation of Contrasts: Recent Regional Demographic Trends in Canada

 
Statistics Canada presents Talking Stats. —Connecting. Collaborating. Learning—

The presentation illustrated the many changes that have occurred in recent years in Canada by showing recent changes at the provincial and territorial level in fertility, immigration and internal migration and the impact on population growth, population age structure, ethno-cultural diversity and families. This presentation was followed by a panel discussion with experts and audience questions.

When: Tuesday, June 17, 2014, 9:00 a.m. to 12:00 p.m. (noon)

Where: World Trade and Convention Centre, 1800 Argyle Street, Halifax, Nova Scotia

Cost: Free

Registration is closed.

Presenter

Wayne R. Smith, Chief Statistician of Canada, Statistics Canada

Wayne R. Smith, Chief Statistician of Canada, Statistics Canada

Mr. Smith completed an Honours BA and Master of Economics at Carleton University in Ottawa. He joined Statistics Canada in 1981. From 2004 to 2010, as Assistant Chief Statistician, he was responsible for a variety of programs and surveys. In September 2010, by order-in-council, Mr. Smith was appointed interim Chief Statistician, and confirmed as Chief Statistician of Canada in January 2011.


Moderator

Yvan Clermont

Yvan Clermont, Director, Demography Division, Statistics Canada

Mr. Clermont graduated from the University of Montréal in Economics in 1987 (Bachelor of Science) and from Les Hautes Études Commerciales in Applied Economics in 1990 (Master of Science). In his current position he is responsible for planning and directing the activities related to the production, integration, analysis and projections of Canadian demographic data and indicators.


Panelists

Dr. Janice Keefe

Dr. Janice Keefe, PhD, Full Professor, Department of Family Studies and Gerontology, Mount Saint Vincent University

In 2002, Dr. Keefe was selected as Mount Saint Vincent’s first Canada Research Chair in Aging and Caregiving Policy which she held from 2002 to 2012. She has received provincial, national and international recognition of her research, most recently from the Canadian Healthcare Association for her contribution to Continuing Care in Canada. In 2006, she was awarded the Lena Isabel Jodrey Chair in Gerontology and appointed Director of the Nova Scotia Centre on Aging.

 
Dr. Michael Haan

Dr. Michael Haan, PhD, Associate Professor, Departments of Economics and Sociology, and Canada Research Chair in Population and Social Policy, University of New Brunswick

From 2005 to 2010, Dr. Haan held an academic appointment at the University of Alberta, where he was Winspear-Archer Research Fellow in Immigration and Social Policy. He is currently working with the Province’s Population Growth Division to evaluate the province’s recruitment and retention efforts (focusing in particular on the Provincial Nominee Program and Canadian Experience Class).

 
Dr. Howard Ramos

Dr. Howard Ramos, PhD, Associate Professor, Department of Sociology and Social Anthropology, Dalhousie University

Political sociologist, Dr. Ramos investigates issues of social justice and equity. He has published articles on immigration, ethnicity, race, human rights, social movements, Indigenous mobilization and Atlantic Canada. His work was published in Canadian Ethnic Studies, Journal of International Migration and Integration, and Social Forces. Recently, in collaboration with Alexandra Dobrowolsky, Dr. Ramos published the report Expanding the Vision: Why Nova Scotia Should Look Beyond Econocentric Immigration Policy, for the Canadian Centre for Policy Alternative, in Nova Scotia.

 
Laurent Martel

Laurent Martel, Chief, Demographic Analysis and Projections Section, Demography Division, Statistics Canada

Mr. Martel has a Master’s degree in demography from the University of Montreal as well as advanced studies in economic demography from the Institut d’Études Politiques de Paris. He has been with Statistics Canada since 1997 and he is responsible for many statistical programs related to demography such as population projections as well as demographic analysis, including analysis of census demographic data. He is a member of the editorial board of the Cahiers Québécois de Démographie and has been the elected president of the Association internationale des démographes de langue française between 2008 and 2012.

 
Thomas Storring

Thomas Storring, Director, Economics and Statistics Division, Nova Scotia Department of Finance and Treasury

Mr. Storring holds a BA in Economics from the Acadia University and an MPhil in Economics from the University of Oxford. His current responsibilities include generating economic and demographic forecasts for use in Provincial Budget planning and policy analysis as well as analyzing current economic and social conditions in Nova Scotia. The Economics and Statistics Division of the Department of Finance and Treasury Board maintains some of the most extensive data and analytical content published by the Provincial Government.


Integrated Business Statistics Program (IBSP)

Reporting Guide

This guide is designed to assist you as you complete the Annual Capital Expenditures Survey

Preliminary Estimate for 2014 and Intentions for 2015. If you need more information, please call the Statistics Canada Help Line at the number below.

Help Line: 1-877-604-7828 or 1-800-972-9692

Your answers are confidential.

Statistics Canada is prohibited by law from releasing any information it collects which could identify any person, business, or organization, unless consent has been given by the respondent or as permitted by the Statistics Act.

Table of contents

Data-sharing agreements
Record linkages
Reporting period information
Definition
Industry characteristics

Data sharing Agreements

To reduce respondent burden, Statistics Canada has entered into data-sharing agreements with provincial and territorial statistical agencies and other government organizations, which have agreed to keep the data confidential and use them only for statistical purposes. Statistics Canada will only share data from this survey with those organizations that have demonstrated a requirement to use the data.


Section 11 of the Statistics Act provides for the sharing of information with provincial and territorial statistical agencies that meet certain conditions. These agencies must have the legislative authority to collect the same information, on a mandatory basis, and the legislation must provide substantially the same provisions for confidentiality and penalties for disclosure of confidential information as the Statistics Act. Because these agencies have the legal authority to compel businesses to provide the same information, consent is not requested and businesses may not object to the sharing of the data.

For this survey, there are Section 11 agreements with the provincial and territorial statistical agencies of Newfoundland and Labrador, Nova Scotia, New Brunswick, Quebec, Ontario, Manitoba, Saskatchewan, Alberta, British Columbia, and the Yukon.

The shared data will be limited to information pertaining to business establishments located within the jurisdiction of the respective province or territory.

Section 12 of the Statistics Act provides for the sharing of information with federal, provincial or territorial government organizations. Under Section 12, you may refuse to share your information with any of these organizations by writing a letter of objection to the Chief Statistician and returning it with the completed questionnaire. Please specify the organizations with which you do not want to share your data.

For this survey, there are Section 12 agreements with the statistical agencies of Prince Edward Island, the Northwest Territories and Nunavut as well as Natural Resources Canada and Environment Canada.

For agreements with provincial and territorial government organizations, the shared data will be limited to information pertaining to business establishments located within the jurisdiction of the respective province or territory.

Record linkages

To enhance the data from this survey, Statistics Canada may combine it with information from other surveys or from administrative sources.

Reporting period information

For the purpose of this survey, please report information for your 12 month fiscal period for which the Final day occurs on or between April 1, 2014 - March 31, 2015 for 2014 and April 1, 2015 - March 31, 2016 for 2015.

May 2013 - April 2014 (04/14)
June 2013 - May 2014 (05/14)
July 2013 - June 2014 (06/14)
Aug. 2013 - July 2014 (07/114)
Sept. 2013 - Aug. 2014 (08/14)
Oct. 2013 - Sept. 2014 (09/14)
Nov. 2013 - Oct. 2014 (10/14)
Dec. 2013 - Nov. 2014 (11/14)
Jan. 2014 - Dec. 2014 (12/14)
Feb. 2014 - Jan. 2015 (01/15)
March 2014 - Feb. 2015 (02/15)
April 2014 - March 2015 (03/15)

Here are other examples of fiscal periods that fall within the required dates:

  • September 18, 2014 to September 15, 2015 (e.g., floating year-end)
  • June 1, 2014 to December 31, 2015 (e.g., a newly opened business)

Definitions

What are Capital Expenditures?

Capital Expenditures are the gross expenditures on fixed assets for use in the operations of your organization or for lease or rent to others.

Include:

  • Cost of all new buildings, engineering, machinery and equipment which normally have a life of more than one year and are charged to fixed asset accounts
  • Modifications, acquisitions and major renovations
  • Capital costs such as feasibility studies, architectural, legal, installation and engineering fees
  • Subsidies
  • Capitalized interest charges on loans with which capital projects are financed
  • Work done by own labour force
  • Additions to work in progress

How to Treat Leases

Include:

  • assets acquired as a lessee through either a capital or financial lease;
  • assets acquired for lease to others as an operating lease.

Exclude

  • assets acquired for lease to others, either as a capital or financial lease.

Information for Government Departments

The following applies to government departments only:

Include

  • all capital expenditures without taking into account the capitalization threshold of your department;
  • Grants and/or subsidies to outside entities (e.g., municipalities, agencies, institutions or businesses) are not to be included;
  • Departments are requested to exclude from reported figures budgetary items pertaining to any departmental agency and proprietary crown corporation as they are surveyed separately;
  • Federal departments are to report expenditures paid for by the department, regardless of which department awarded the contract;
  • Provincial departments are to include any capital expenditures on construction (exclude outlays for land) or machinery and equipment, for use in Canada, financed from revolving funds, loans attached to revolving funds, other loans, the Consolidated Revenue Fund or special accounts.

Industry characteristics

Report the value of the projects expected to be put in place during the year. Include the gross expenditures (including subsidies) on fixed assets for use in the operations of your organization or for lease or rent to others. Include all capital costs such as feasibility studies, architectural, legal, installation and engineering fees as well as work done by your own labour force.

New Assets, Renovation, Retrofit (Column 1), includes both existing assets being upgraded and acquisitions of new assets

The following explanations are Not applicable to government departments:

  • include - Capitalized interest charges on loans with which capital projects are financed
  • exclude - If you are capitalizing your leased fixed assets as a lessee in accordance with the Canadian Institute of Chartered Accountants’ recommendations, please exclude the total of the capitalization of such leases during the year from capital expenditures

Purchase of Used Canadian Assets (Column 2)

Definition: Used fixed assets may be defined as existing buildings, structures or machinery and equipment which have been previously used by another organization in Canada that you have acquired during the time period being reported on this questionnaire.

Explanation: The objective of our survey is to measure gross annual new acquisitions to fixed assets separately from the acquisition of gross annual used fixed assets in the Canadian economy as a whole.

Hence, the acquisition of a used fixed Canadian asset should be reported separately since such acquisitions would not change the aggregates of our domestic inventory of fixed assets, it would simply mean a transfer of assets within Canada from one organization to another.

Imports of used assets, on the other hand, should be included with the new assets (Column 1) because they are newly acquired for the Canadian economy.

Work in Progress:
Work in progress represents accumulated costs since the start of capital projects which are intended to be capitalized upon completion.

Typically capital investment includes any expenditure on an asset in which its’ life is greater than one year. Capital items charged to operating expenses are defined as expenditures which could have been capitalized as part of the fixed assets, but for various reasons, have been charged to current expenses.

Land
Capital expenditures for land should include all costs associated with the purchase of the land that are not amortized or depreciated.

Residential Construction
Report the value of residential structures including the housing portion of multi-purpose projects and of townsites with the following Exceptions:

  • buildings that have accommodation units without self-contained or exclusive use of bathroom and kitchen facilities (e.g., some student and senior citizen residences)
  • the non-residential portion of multi-purpose projects and of townsites
  • associated expenditures on services

The exceptions should be included in the appropriate construction (e.g., non-residential) asset.

Non-Residential Building Construction (excluding land purchase and residential construction)
Report the total cost incurred during the year of building and engineering construction (contract and by own employees) whether for your own use or rent to others. Include also:

  • the cost of demolition of buildings, land servicing and of site-preparation
  • leasehold and land improvements
  • townsite facilities, such as streets, sewers, stores, schools

Non-residential engineering construction

Report the total cost incurred during the year of engineering construction (contract and by own employees) whether for your own use or rent to others. Include also:

  • the cost of demolition of buildings, land servicing and of site-preparation
  • oil or gas pipelines, including pipe and installation costs
  • all preconstruction planning and design costs such as engineer and consulting fees and any materials supplied to construction contractors for installation, etc.
  • communication engineering, including transmission support structures, cables and lines, etc.
  • electric power engineering, including wind and solar plants, nuclear production plants, power distribution networks, etc.

Machinery and Equipment
Report total cost incurred during the year of all new machinery, whether for your own use or for lease or rent to others. Any capitalized tooling should also be included. Include progress payments paid out before delivery in the year in which such payments are made. Receipts from the sale of your own fixed assets or allowance for scrap or trade-in should not be deducted from your total capital expenditures. Any balance owing or holdbacks should be reported in the year the cost is incurred.

Include:

  • automobiles, trucks, professional and scientific equipment, office and store furniture and appliances
  • computers (hardware and software), broadcasting, telecommunication and other information and communication technology equipment
  • motors, generators, transformers
  • any capitalized tooling expenses
  • progress payments paid out before delivery in the year in which such payments are made
  • any balance owing or holdbacks should be reported in the year the cost is incurred

Software

Capital expenditures for software should include all costs associated with the purchase of software.

Include:

  • Pre-packaged software
  • Custom software developed in-house/own account
  • Custom software design and development, contracted out

Research and Development

Research and development (R&D) comprise creative work undertaken on a systematic basis in order to increase the stock of knowledge, including knowledge of man, culture and society, and the use of this stock of knowledge to devise new applications. Basic and applied research is experimental or theoretical work undertaken primarily to acquire new knowledge of the underlying foundation of phenomenon and observable facts. Experimental development is systematic work, drawing on existing knowledge gained from research and/or practical experience, which is directed to producing new materials, products or devices, installing new process, systems and services, or improving substantially those already produced or installed.

Capacity Utilization (Manufacturing Companies only)

Capacity use (utilization) is calculated by taking the actual production level for an establishment (production can be measured in dollars or units) and dividing it by the establishment’s capacity production level.

Capacity production is defined as maximum production attainable under normal conditions.

To calculate capacity production, follow the establishment’s operating practices with respect to the use of productive facilities, overtime, workshifts, holidays, etc. For example, if your plant normally operates with one shift of eight hours a day five days a week then capacity will be calculated subject to these conditions and not on the hypothetical case of three shifts a day, seven days a week.

Example:
Plant “A” normally operates one shift a day, five days a week and given this operating pattern capacity production is 150 units of product “A” for the month. In that month actual production of product “A” was 125 units. The capacity utilization rate for plant “A” is (125/150) * 100 = 83%

Now suppose that plant “A” had to open a shift on Saturdays to satisfy an abnormal surge in demand for product “A”. Given this plant’s normal operating schedule, capacity production remains at 150 units. Actual production hasgrown to 160 units, so capacity utilization would be (160/150) * 100 = 107%.