Geographical map of 2006 Census Metropolitan Area of St. Catharines - Niagara, Ontario
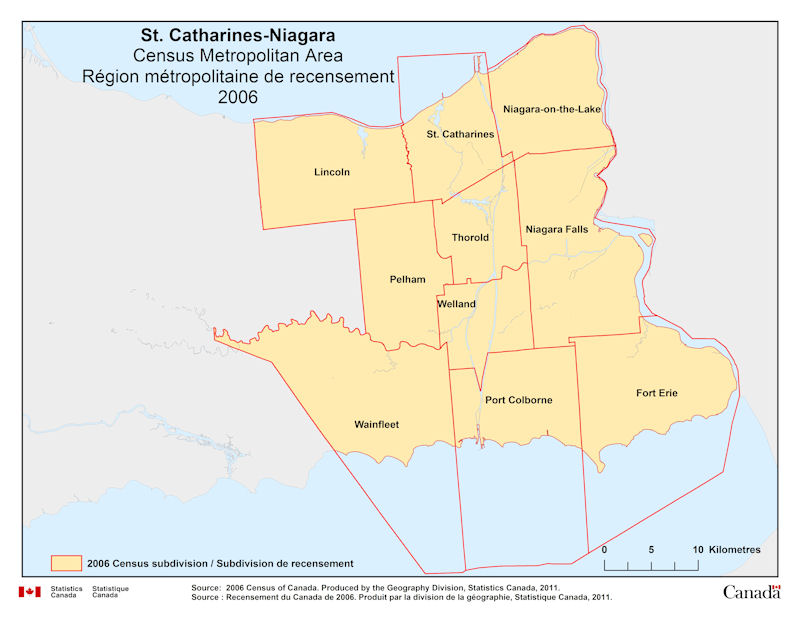
Geographical map of 2006 Census Metropolitan Area of St. Catharines - Niagara, Ontario. The following Census subdivisions are listed within this region: Fort Erie, Lincoln, Niagara Falls, Niagara-on-the-Lake, Pelham, Port Colborne, St. Catharines, Thorold, Wainfleet, Welland.
Source: 2006 Census of Canada. Produced by the Geography Division, Statistics Canada, 2011.